
5 minute read
THE EFFECT OF AUDITORY AND VISUAL STIMULI ON REACTION TIME

THE EFFECT OF AUDITORY AND VISUAL STIMULI ON REACTION TIME Loren Yusef (Year 10) Science Faculty, The Illawarra Grammar School, Western Avenue, Mangerton, 2500
ABSTRACT
Advertisement
Our ability to react to stimuli is key to many daily activities we all perform. This experiment investigates if the type of stimuli (either auditory or visual) affects the speed of a person’s reaction time. Participants of this experiment were asked to complete each type of reaction time test 5 times to compare their averaged results. When all data was collated, it was found that this set of participants on average, had a faster reaction time to visual stimuli, however, a closer look at the data reveals that this is not conclusive and that there is no clear difference in reaction time based on stimuli. Although further experimentation and data collection need to be done to confirm these results, it seems that a person’s reaction time can simply be dependent on their personal factors.
Introduction
Our reflexes and ability to react to things in our surroundings are key parts of our everyday life. From catching a ball or driving a car, our ability to have fast reactions to a situation is often very important to our survival or ability to protect ourselves.
Our brains receive lots of information and stimuli which it then processes and determines if there is a need to react to the information it receives. This has been part of human survival instincts from primitive times, particularly regarding our flight, fight or freeze reaction.
There are different types of stimuli, the main 2 being visual and auditory. Visual stimuli are any information we process with our eyes. Auditory stimuli are information we receive via sound and our ears. There have been some studies that suggest that our brains can process auditory stimuli faster than visual stimuli, allowing us to react faster. This experiment aims to test this theory, through online reaction time tests completed by several participants.
Method
A computer was set up with the visual and auditory reaction tests in a quiet place. Then participants were brought over and given instructions on how to complete the reaction time tests. The visual reaction test was completed 5 times by the participant, and then they completed the auditory reaction time test 5 times, with all results being recorded. A total of 20 participants took part in this experiment, providing a total of 200 reaction times to be averaged and compared.
Results
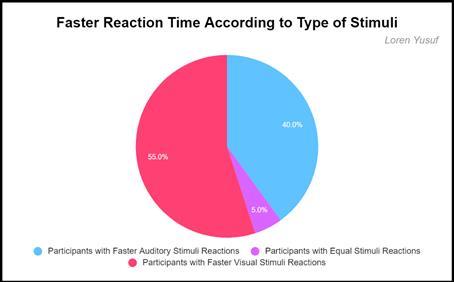
Although the averaged results did seem to reflect that responses to visual stimuli were faster, a closer look at the data reveals that the results are less conclusive than they first seemed. 40% of participants had a faster reaction to auditory stimuli, 5% had equally fast reactions to both stimuli, and 55% had a faster reaction to visual reaction times. Through increasing the number of participants, and consequently the pool of results, it will be easier to determine if this
62
data happened to be influenced by the smaller pool of participants or if reaction times simply depends on the person and the situation.
Discussion
Although this experiment had a wellplanned method and effectively sought out its aim, further data and experimentation would be beneficial. This experiment was conducted on a relatively small group of participants and would therefore benefit greatly from further data collection from a larger group such as 50-100 participants. This would help resolve some of the complications and differences reflected in the data. Although the averaged results did seem to reflect that responses to visual
63
stimuli were faster, a closer look at the data reveals that the results are less conclusive than they first seemed.
This experiment fulfilled its aim to investigate the effect different stimuli (auditory or visual) have on the reflex reaction time of a person. Although the results were not particularly conclusive (with almost a 50/50 split in the data), they do provide a base point at which further investigation can continue to provide more conclusive results.
This experiment ensured validity by controlling all other variables which could have affected the results. Some of these variables included the age of participants (all participants being of 15-17 years old), time of day (with all participants completing the test within 1 hour during the middle of the day), removal ofmajor distractions (with the tests being conducted in a quiet space outside the classroom away from other devices and students), and system variables (with all tests being conducted on the same computer, using the same websites, and same volume/brightness for auditory and visual tests). The considerations of all of these factors and the elimination of additional effects have resulted in valid data being collected from all participants.
This experiment also ensured the accuracy of all the data collected. Due to the controlling of all other variables, all the reaction times collected from individuals and the overall group were within a small range of each other. Further, all reaction times were measured in milliseconds to ensure that the data collected was precise and easily reflect any change or patterns revealed by the data.
The reliability of the data collected in this experiment is also ensured through the method. This experiment collected reaction times from 20 participants, preventing and specific individual factors from altering the data and making any outliers clear. Further, each participant repeated each test 5 times to ensure the accuracy of individual results and eliminate any outlier reaction times within a participant’s performance.
References
Jain, A, Bansal, R, Kumar, A & Singh, K 2015, ‘A comparative study of visual and auditory reaction times on the basis of gender and physical activity levels of medical first year students’, International Journal of Applied and Basic Medical Research, vol. 5, no. 2, p. 124, viewed 17 November 2021, <https://www.ncbi.nlm.nih.gov/pmc/article s/PMC4456887/>. Shelton, J & Kumar, GP 2010, ‘Comparison between Auditory and Visual Simple Reaction Times’, Neuroscience and Medicine, vol. 01, no. 01, pp. 30–32, viewed 9 November 2021, <https://www.scirp.org/html/42400003_2689.htm>. Solanki, J, Joshi, N, Shah, C, HB, M & PA, G 2012, ‘A Study of Correlation between Auditory and Visual Reaction Time in Healthy Adults’, International Journal of Medicine and Public Health, vol. 2, no. 2, pp. 36–38, <https://www.ijmedph.org/sites/default/file s/IntJMedPublicHealth_2012_2_2_36_108 395.pdf>.
64
