The Boston condominium market did not contract in Q1 2026. It recalibrated.
Boston recorded 432 condominium sales in Q1, down roughly 10% from the 478 recorded in Q1 2025, but 3% above Q1 2024. Read in isolation, the year-over-year decline reads as softness. Read in cycle, it reads as a market finding its level after a brief, development-driven surge.
Geopolitics reset the release calendar. The Iran conflict, beginning in February, introduced a layer of cost and capital uncertainty that developers absorbed by tightening release strategy rather than discounting price. Equity market softness at quarter end reinforced the caution.
The Federal Reserve held. After three rate cuts in the second half of 2025, Q1 2026 opened with the 30-year fixed near 6.1%, meaningful relief from the 7.3% peak of 2023, but not yet the catalyst the market is waiting for. The threshold that re-engages buyers and sellers in scale sits below 6%.
Inventory bifurcated. MLS supply rose modestly, to 750 listings from 719. But the visible market is only part of the story. Across Boston’s twelve most consequential new-construction buildings, 484 units sit in shadow inventory, supply that has not yet entered MLS. That figure does not include One Harbor Shore, a roughly 122-unit waterfront development queued for delivery this August, which represents the next wave of pipeline supply on top of the 484. The result is a two-speed market: constrained resale supply in established neighborhoods, and a substantial layer of new-construction supply at the high end that has yet to fully surface.
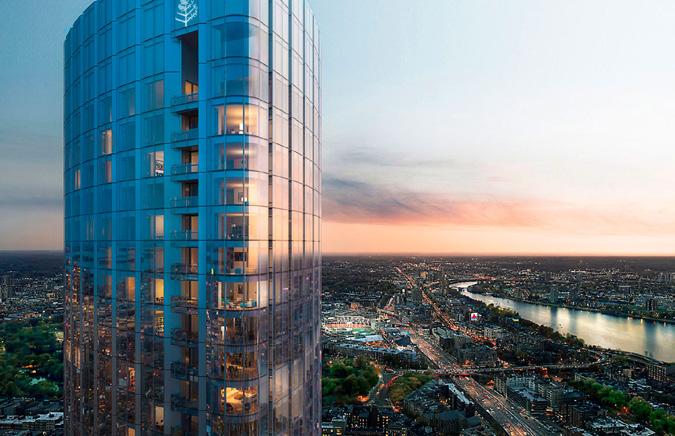
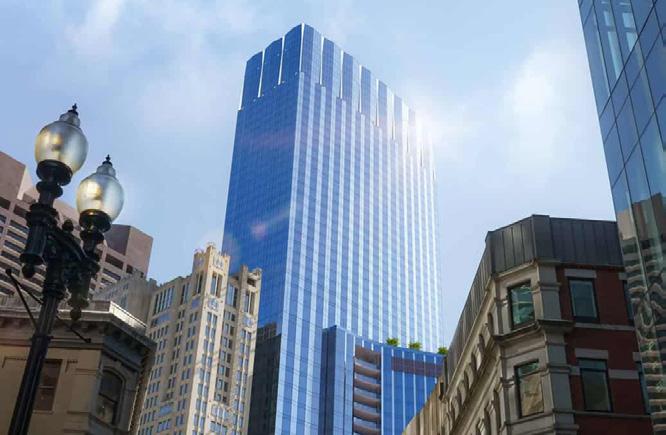
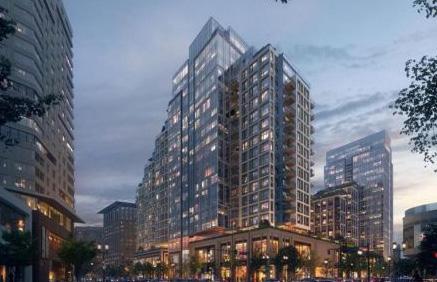
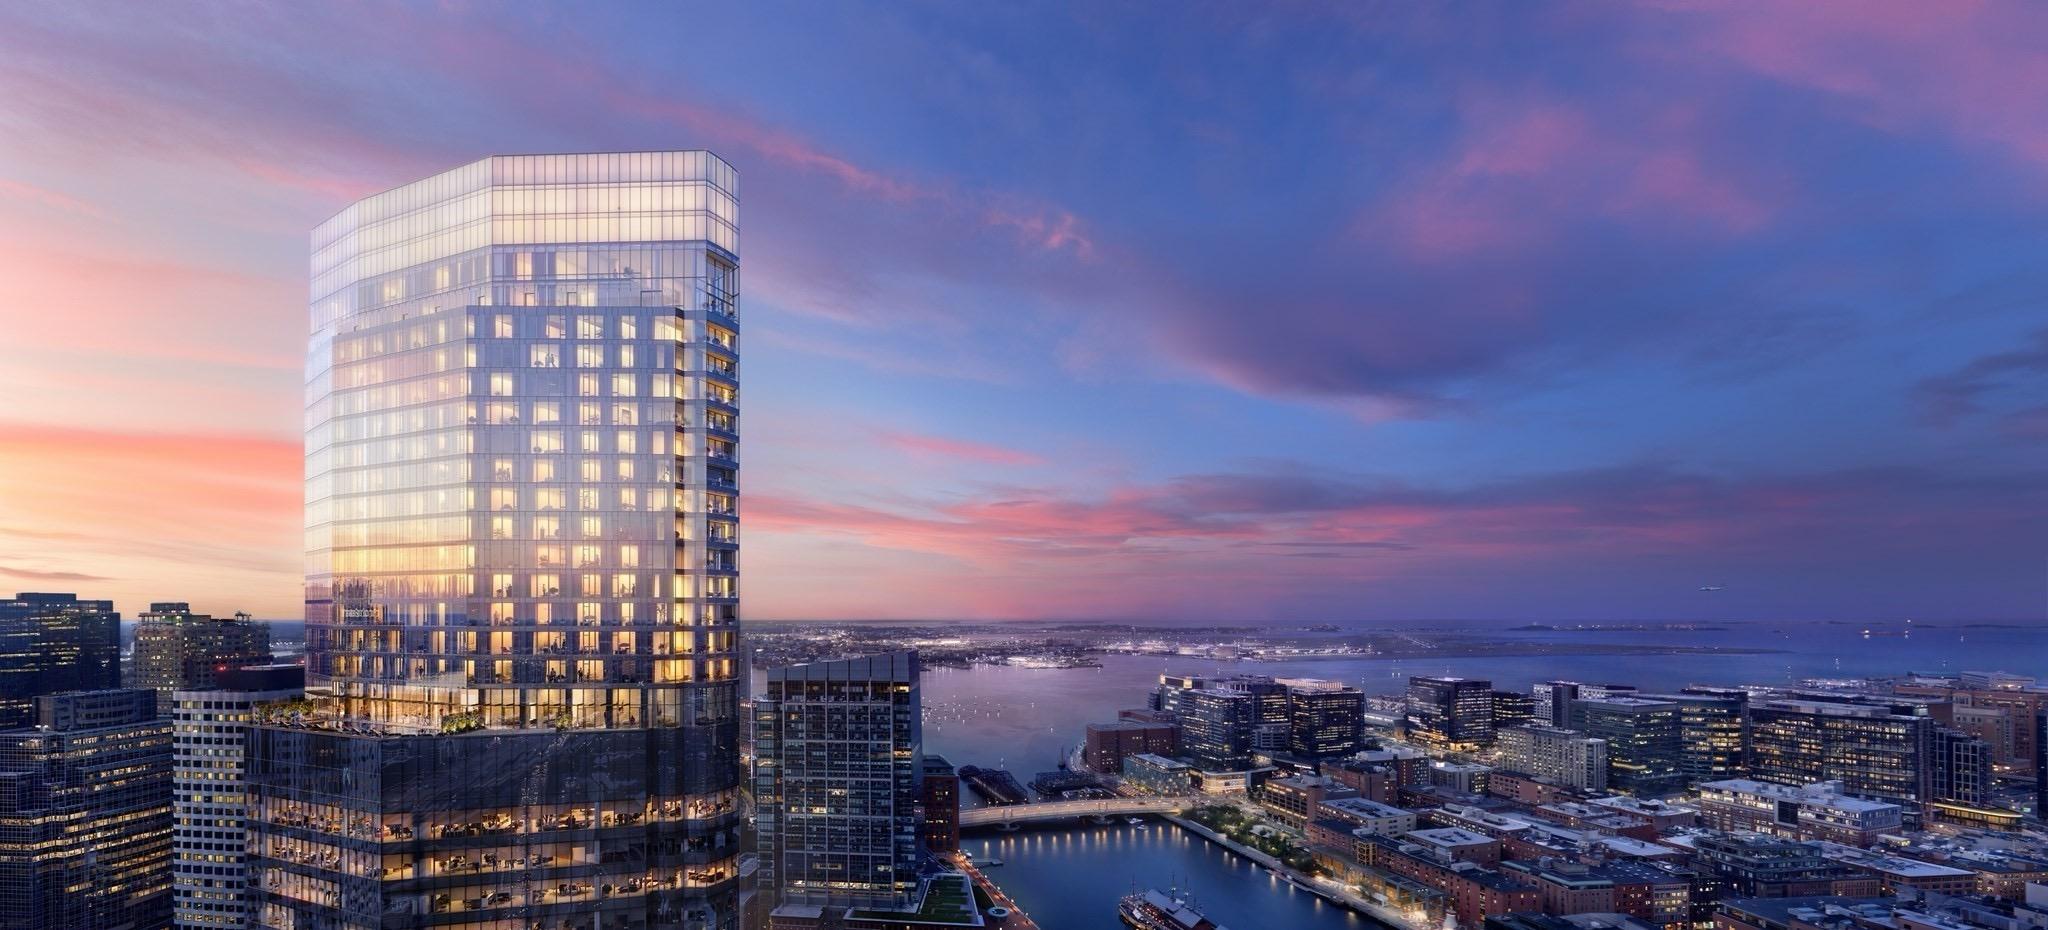
Looking ahead, our view is that Q1 was a turn, not a pause. Q2 has historically been Boston’s strongest quarter for sales velocity, and the conditions for re-engagement, including easing rates, returning sellers, and a Ritz-Carlton South Station Tower now actively closing, are in place. The variable to watch is not sentiment but absorption: how the market metabolizes shadow inventory as it transitions to MLS, and whether the $3M+ segment, the only price band that grew in Q1, sustains its momentum.
The full report quantifies the recalibration building by building, neighborhood by neighborhood, and price band by price band.
Q1 was the recalibration. The case this report makes is for what comes next.
Janice Dumont Founder & CEO, JD Advisors
Three Forces Shaped Q1 2026
The spine of this report, in one page.
Boston recorded 432 condominium sales in Q1 2026, down roughly 10% from Q1 2025 but 3% above Q1 2024. The year-over-year decline reads as softness in isolation. Read in cycle, it reads as a market finding its level after a brief, development-driven surge. Three forces shaped how Q1 played out, and they will determine how Q2 unfolds.
01
Geopolitics reset the release calendar.
The Iran conflict, beginning in February, introduced cost and capital uncertainty that developers absorbed by tightening release strategy rather than discounting price. Equity market softness at quarter end reinforced the caution.
WHAT TO WATCH
Whether developer release pacing loosens as Q2 absorption confirms or denies the recalibration thesis.
02
The Federal Reserve held.
After three rate cuts in the second half of 2025, Q1 2026 opened with the 30-year fixed near 6.1%, meaningful relief from the 7.3% peak of 2023, but not yet the catalyst the market is waiting for.
THE THRESHOLD
A sustained move below 6% is what re-engages buyers and sellers in scale.
03
Inventory bifurcated.
MLS supply rose modestly to 750 listings, but the visible market is only part of the story. Across Boston’s twelve most consequential new-construction buildings, 484 units sit in shadow inventory, with another roughly 122 units at One Harbor Shore queued for August delivery on top of that.
THE NUMBER
484 units of shadow inventory, supply that has not yet entered MLS.
Our view: Q1 was a turn, not a pause. The variable to watch is not sentiment but absorption. The case this report makes is for what comes next.
Q1 Sales Recap | Total Sales
▶ Q1 2025 marked the peak in sales (478), exceeding both Q1 2024 (419) and Q1 2026 (432), indicating a brief surge followed by a slight pullback.
▶ Q1 2026 sales were down 10% year-over-year, but remained 3% above Q1 2024, suggesting relatively stable underlying demand.
▶ The uptick in sales in Q1 2025 can be attributed in part to closings beginning at 1515 Commonwealth Ave, which accounted for 18 of the 478 sales.
▶ The Ritz-Carlton South Station Tower was the only new building to begin closings in Q1 2026, contributing 9 sales, indicating that no single development materially drove overall activity in 2026.
Historical Interest Rates
▶ Mortgage rates have continued to ease, falling to 6.1% in Q1 2026 from 6.8% in Q1 2025 and the 2023 peak of 7.3%.
▶ Stabilization in the 6–6.5% range is supporting a modest recovery in sales, compared to rate highs in late 2023 though borrowing costs remain a key constraint on buyer activity.
▶ Following the late-2025 rate cuts, early 2026 trends point to gradual improvement rather than a sharp rebound.
Interest Rate & Sales Comparison
# of Sales 30-Year Fixed 15-Year Fixed
▶ Quarterly sales continue to show a clear inverse relationship with mortgage rates, peaking during the low-rate environment of 2020–2021 and declining as rates rose above 6% in 2022–2023.
▶ Modest rate easing through 2024–2026 has supported partial recovery, though sales remain below prior peak levels, highlighting continued buyer sensitivity to borrowing costs.
Neighborhood Stats
Q1 2025 vs. Q1 2026
ALLSTON
BACK BAY
BEACON HILL
CHARLESTOWN
EAST BOSTON
FORT POINT
JAMAICA PLAIN
LEATHER DISTRICT
MIDTOWN
NORTH END
Neighborhood Stats
Q1 2025 vs. Q1 2026
SEAPORT DISTRICT
SOUTH BOSTON
SOUTH END
THEATRE DISTRICT
WATERFRONT
WEST END
Although included in the overall numbers throughout the Q1 2026 report, the following neighborhoods had zero data points in either Q1 2025 or Q1 2026 sales and are not included above: Bay Village, Financial District, South Station
▶ 7 of the 18 neighborhoods showed an increase in average price when comparing Q1 2025 and Q1 2026.
▶ The most notable price growth occurred in South End (+13%) and Midtown (+9%).
▶ The increase in the South End can be attributed primarily to a shift in sales composition toward higherpriced inventory, including a greater concentration of $1M–$3M+ closings, and a reduced share of sub-$800K transactions that were more prevalent in 2025.
▶ In Midtown, several significant Q1 2026 sales above $4M contributed to the increase, including two residences at Winthrop Center ($4.85M and $5M) and a penthouse at The Ritz-Carlton Residences ($8.1M).
▶ When looking at quarter over quarter comparisons, we also see the number of sales in Allston and Theatre District climbing in 2026, the latter largely driven by multiple closings at The Parker, which accounted for all five transactions in Q1 2026.
Top 12 Building Sales
New Construction Condo Buildings Actively Selling in 2026
“Buildings reflect new construction condominium homes with 50+ units who are actively selling in 2026. Data is based on cumulative sales. Sourcing from MLS and the Registry of Deeds. Totals may not reflect any combined units.
Top 12 Building Sales
New Construction Condo Buildings Actively Selling in 2026
THE ARCHER
Beacon Hill - 45 Temple Street
THE QUINN
1515 COMM AVE
TRIMOUNT PLACE
▶ The Ritz-Carlton South Station began closings in Q1 2026, ending the quarter with 9 closings and 12 UAG.
▶ Closings at remaining new construction buildings continue at a gradual pace, as many of these long-established developments are now in the later stages of their sales cycles, with only a limited number of remaining units transacting each quarter.
▶ Price ranges across these developments remain elevated overall, with average sales well over $1,000/PSF in the luxury-level new construction developments. In the ultra-luxury new construction developments, average sales exceeded $2,400/PSF.
The MLS Illusion
Public inventory tells only part of the story. The true market extends beyond what’s visible online.
New Construction Supply & Shadow Inventory
▶ At the end of Q4 2025, total tracked new construction inventory (shadow + active listings) in the Top 12 buildings stood at 581 units, declining to 546 units at the end of Q1 2026.
▶ This includes a decline in shadow inventory from 535 to 484 units, partially offset by an increase in active MLS listings from 46 to 62 units, as inventory transitioned between pipeline stages.
▶ The reduction in shadow inventory was influenced in part by the commencement of closings at the Ritz-Carlton South Station Tower, which represents approximately 27% of current availability.
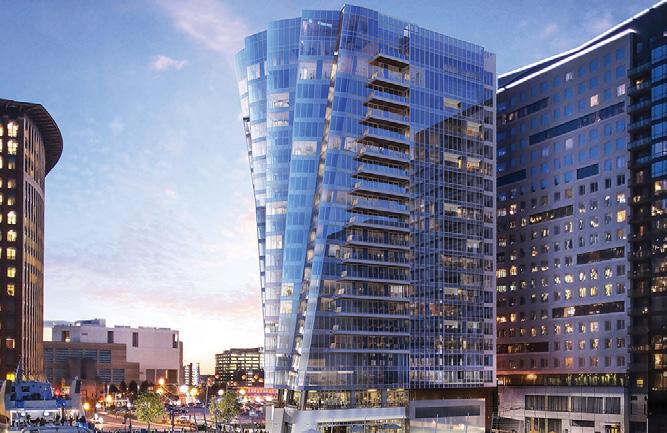
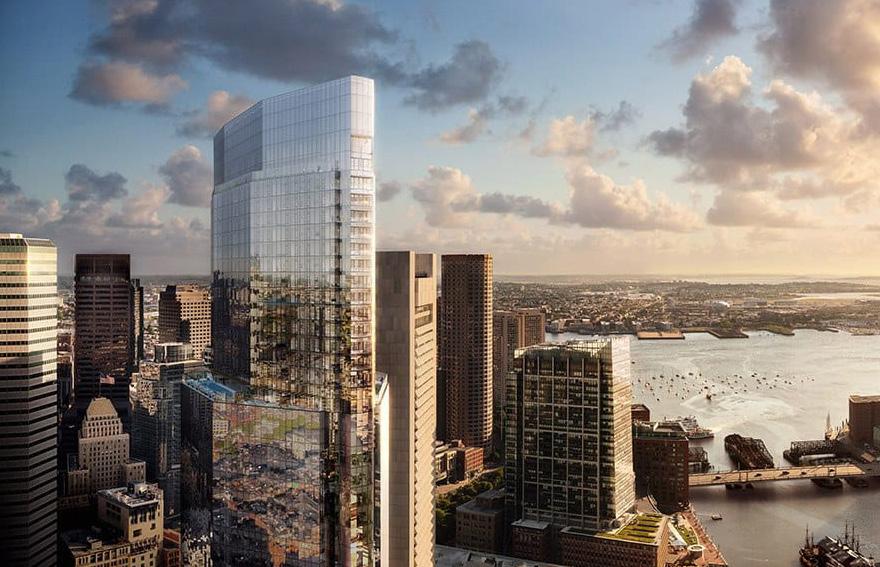
▶ Not included in this slide is the next meaningful addition to supply, One Harbor Shore in the Seaport, a 122-unit waterfront condominium development. Currently soft marketing, and in advanced construction, with an expected delivery in August 2026, it represents the next wave of shadow pipeline inventory upon completion.
AMENITIES
Wellness
Fitness center with dedicated treatment rooms and saunas.
Resident Lounge
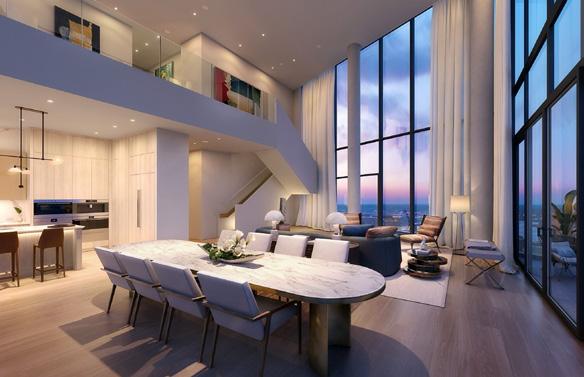
Double-height library lounge centered around a fireplace.
Outdoor Living
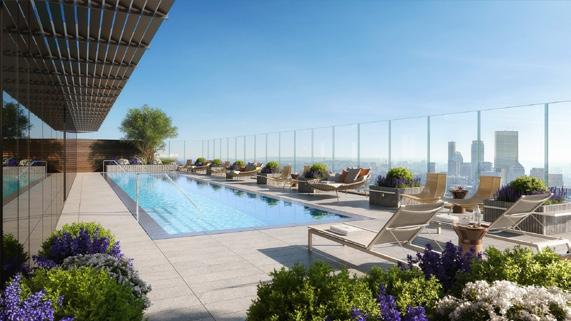
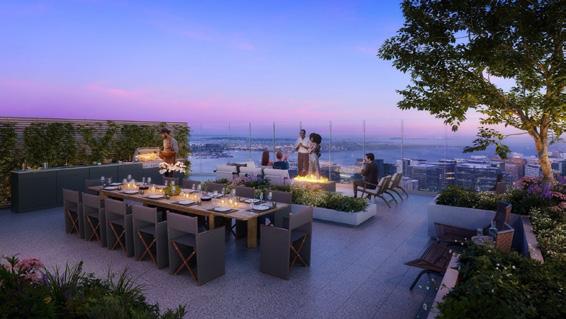
Two outdoor terraces and a 72-foot outdoor swimming pool.
Recreation
Game room featuring a sports simulator.
Sales By Unit Type
Total Sold & Average Sales Price
Bedrooms
▶ In Q1 2026, total sales velocity fell 10% from Q1 2025 to 432 units. The decline is seen across most unit types, led by studios, two- and four-bedroom homes.
▶ This decline is in part due to 1515 Commonwealth Avenue beginning closings in Q1 2025, which boosted transaction volume during that period and created a higher year-over-year comparison.
▶ Despite lower volume, pricing increased across all segments in Q1 2026: studios (+25%), one-bedrooms (+1%), twobedrooms (+10%), three-bedrooms (+8%), and four-bedrooms (+27%), indicating overall price growth even as sales slowed.
▶ Five-bedroom data was limited, with only two sales in Q1 2025 and no transactions in Q1 2026, making year-over-year comparisons inconclusive for this segment.
Early Signs of Adjustment
A modest increase in inventory coincided with a softening in pricing across the market.
Sales by Price Range
Q1 2025 vs. Q1 2026
▶ Between Q1 2025 and Q1 2026, total sales declined from 478 to 432 units.
▶ The largest drop occurred in the $2M–$2.99M range, while most other segments also experienced modest declines.
9M $2M-$2.9 9M
▶ The $3M+ segment was the only category to grow, increasing by 12 sales and highlighting continued strength at the high end despite broader market softening.
▶ The Ritz-Carlton South Station Tower accounted for four of the over $3M sales.
▶ Other notable Q1 2026 transactions included two sales above $14M at One Dalton, a $14.5M sale at 50 Liberty, and a Beacon Hill penthouse closing at $17M.
Million Dollar Market
▶ Homes under $1M remained the dominant segment, holding steady at 59% of total sales in both Q1 2025 and Q1 2026 despite a slight decline in volume.
▶ The $1M–$1.99M range was also stable at roughly 25% of sales.
▶ At the high end, results were more mixed: the $2M–$2.99M segment fell from 9% to approximately 6%, while the $3M+ segment rose from 8% to 11%, marking the only area of growth.
▶ Overall, the market remained balanced at the lower end, with shifting momentum in luxury sales and the Ritz Carlton South Station Tower starting to deliver in Q1 2026.
End of Quarter Inventory
By Price Range ($500K+)
▶ Not including shadow inventory, at the end of Q1 2026 in MLS, inventory rose to 750 listings from 719 in Q1 2025 (+4%).
▶ Median and average prices declined to $1.10M (-10%) and $2.02M (-6%), respectively.
▶ Gains were concentrated in the $1M–$1.49M range, while $2M+ inventory was generally flat to lower, with the exception of the $4M-$4.99M category.
▶ Overall, the market showed slightly higher supply and easing prices, creating modestly more favorable conditions for buyers.
Things We’re Watching In 2026
Boston Condo Market Outlook
The Boston condominium market showed early signs of stabilization in Q1 2026. Sales activity declined modestly compared to Q1 2025 but improved modestly relative to Q1 2024, suggesting a market recalibrating rather than contracting. As we enter Q2, historically the strongest quarter for sales velocity, six variables will shape the trajectory of 2026, and JDA’s view on each is below.
1. Market Resilience
Boston’s condo market continues to benefit from a strong local economy, anchored by world-class education, healthcare, and technology sectors, and a diverse, stable population base. Geopolitical tensions, particularly the ongoing Iran conflict, introduce uncertainty that has yet to be fully reflected in the market. Will the introduction of One Harbor Shore add a year’s supply to shadow inventory or reflect demand-driven product and market resilience?
JDA VIEW
One Harbor Shore is additive to the 484 units already in shadow inventory across the top twelve buildings, not a substitute for them. Its early absorption velocity, not its launch metrics, will tell us whether Boston’s luxury depth is structural demand or accumulated supply. We expect the answer by Q3.
2. Interest Rates
The interest rate environment improved meaningfully in late 2025 with three 25-basis-point cuts. Q1 2026 began with the 30-year fixed near 6.1%, down from approximately 6.8% the prior year. The Federal Reserve paused rate cuts in Q1, leaving the market searching for direction. A move below the 6% threshold would be a key catalyst. Will the anticipated transition in Federal Reserve leadership result in easing rates, or will inflation continue to dictate their trajectory?
JDA VIEW
Leadership will set tone, but inflation will set policy. We expect the 30-year fixed to test the 6% threshold by late Q2, and a sustained move below 6% is the catalyst that re-engages the under $3M buyer pool at scale.
3. Inventory Levels
Inventory remains constrained, though headline numbers do not fully capture available supply due to shadow inventory: units not yet listed on MLS. Current supply remains below six months, indicating a market still relatively tight by historical standards. Inventory increased approximately 4% quarter-over-quarter, signaling a gradual return of sellers. Will Q2’s historical increase translate to higher absorption or pricing adjustments as sellers compete for a limited buyer pool?
Things We’re Watching In 2026
JDA VIEW
Both, in different segments. We expect resale inventory under $1.5M to absorb at Q2’s historical pace as sellers price to clear, while $2M to $3M product continues to sit, widening the gap between trophy assets and everything else.
4. Buyer Engagement
Buyer activity softened in Q1 2026 with sales down approximately 10% year-over-year. Boston’s long-term appeal remains intact. For many buyers, decisions are driven less by short-term volatility and more by lifestyle considerations: proximity to work, quality of life, and long-term investment value. Will buyers in the under $3M market re-engage at an accelerated pace due to market fatigue, or continue to sit on the sidelines?
JDA VIEW
Fatigue is winning. Two consecutive quarters of stable demand under $1M and the return of the $1M to $1.99M segment to 25% share signal that the under $3M buyer is pricing in the rate environment rather than waiting it out. We expect Q2 volume in this band to outpace Q2 2025.
5. 2026 New Developments
One of the most closely watched deliveries is Ritz-Carlton South Station Tower, which began closing on units in March 2026. Its near-term performance will serve as an early indicator of buyer absorption at current price points. Another notable addition is One Harbor Shore, which will likely introduce a higher level of MLS transparency. Across the top twelve new-construction buildings, approximately 484 units sit in shadow inventory: meaningful supply not yet marketed on MLS.
JDA VIEW
The Ritz-Carlton South Station Tower’s first six months of closings will set the price-per-foot benchmark every other ultra-luxury development is measured against this cycle. One Harbor Shore, additive to the 484, is the first true test of how 122 units enter a market that has held its supply close. We expect MLS exposure to reveal what off-market pacing has obscured: pricing power at the high end is real, but narrower than the headline absorption stories suggest.
Things We’re Watching In 2026
6. Under Agreement Volume
At the end of Q1, approximately 374 properties were listed as under agreement across select Boston neighborhoods, largely in line with Q1 2024 levels. Many of these transactions, particularly in new construction, are expected to close in Q2 or later. Shadow transactions, deals completed off-market, remain an important but unquantified component of demand. Will sellers push transparency to increase exposure in Q2, and will Q2 reaffirm its position as the strongest quarter?
JDA
VIEW
Transparency follows confidence. Sellers who pushed product off-market in Q1 will return to MLS as Q2 velocity confirms the recalibration. We expect Q2 to reaffirm its position as Boston’s strongest quarter, with reported volume understating true activity by the same off-MLS margin we have tracked all cycle.
Final Thought
The Boston condo market in 2026 is positioned for cautious progress, shaped by interest rate policy, geopolitical conditions, and seller confidence. Momentum may ultimately hinge on a single psychological shift; the moment buyers collectively decide the time to act is now.
At JD Advisors, this kind of market intelligence directly informs how we advise our clients, position new developments, and deliver sales and marketing strategies that reflect actual conditions. It shapes everything from pricing, product mix, to the timing of a launch, on going strategy and the messaging that reaches buyers. Understanding the market deeply is not a differentiator for us - it is our guiding light.
Methodology & Sources
METHODOLOGY
This report combines publicly available data from the Massachusetts Multiple Listing Service (MLS PIN) and the Suffolk County Registry of Deeds. Shadow inventory figures are derived by cross-referencing total units in each new-construction building against recorded sales and active MLS listings to isolate supply not yet publicly listed. Historical mortgage rate data is sourced from Freddie Mac.
URBAN DATA NEIGHBORHOODS
This report’s Urban Data Neighborhoods include Allston, Back Bay, Bay Village, Beacon Hill, Brighton, Charlestown, Chinatown, East Boston, Financial District, Fort Point, Jamaica Plain, Leather District, Midtown, North End, Seaport District, South Boston, South End, South Station, The Fenway, Theatre District, Waterfront, and West End.
WORKS CITED
Massachusetts Multiple Listing Service Property Information Network (MLS PIN). Suffolk County Registry of Deeds. Freddie Mac Primary Mortgage Market Survey.
REPORTS PREPARED BY:
JANICE DUMONT
Founder & CEO
Six market cycles. Twenty-five years in luxury residential. Janice has held senior leadership roles guiding the successful sellouts of luxury residential developments for global and Boston owners and developers including Tishman Speyer, Howard Hughes Corporation, GGP, The Davis Companies, Tremont Realty Capital, Boston Property Ventures, Berkeley Investments, Intercontinental Real Estate, and Charter Realty & Development. She founded JDA to bring decades of cycle-tested experience into a single ecosystem.
508.277.7707 jdumont@jdadvisors.com
JENNIFER FRIZZELL
VP of Data Science & Strategy
Big Four pedigree. Real estate data science from the inside out. Jennifer launched her real estate career at Ernst & Young’s Real Estate Advisory practice, consulting on national and international engagements where rigor, data integrity, and institutional standards were the baseline. At JDA she leads the data science practice, integrating MLS and Registry of Deeds data into the quarterly market analysis that defines the firm’s research voice. Her work surfaces the supply, pricing, and absorption patterns that headline figures obscure.