
Boston’s condominium market rewards insight.
This report distills current transaction data, economic conditions, and emerging neighborhood trends into clear intelligence designed to support confident decisions in any market environment.
Boston’s condominium market rewards insight.
This report distills current transaction data, economic conditions, and emerging neighborhood trends into clear intelligence designed to support confident decisions in any market environment.

Dear Friends and Colleagues,
The Boston condominium market contracted modestly in 2025, with total closings declining 1.7% year over year and 8.1% in Q4 compared to Q4 2024. New building deliveries (Trimount Place and 1515 Commonwealth) added meaningful supply, helping to partially offset the broader slowdown in transaction volume.
Market conditions reflected a shift toward softer demand and increased supply. Year-end inventory rose 8.3% compared to 2024, driven primarily by a 21.4% increase in available units priced below $1 million. Concurrently, average sale prices declined 10.4%, while days on market increased 5.8%, signaling reduced pricing power and longer absorption timelines.
Developers operated within a volatile cost environment throughout 2025, as tariffs on construction materials were repeatedly adjusted. While development inquiries increased, uncertainty around input costs—combined with slower absorption—contributed to more cautious decision-making around new project launches and timing.
Macroeconomic conditions improved in the second half of the year. Equity markets delivered strong returns (S&P 500 +16.4%, Nasdaq +20.5%), and the Federal Reserve implemented three rate cuts totaling 75 basis points. These shifts improved financing conditions and supported buyer sentiment, particularly in interest rate–sensitive segments.
The sub-$1 million segment demonstrated the most notable supply expansion and remains the most responsive to changes in borrowing costs and affordability dynamics. This segment is expected to play a key role in early-cycle recovery.
Looking ahead, we expect a slower start to 2026, with elevated inventory levels and continued pricing adjustments in the near term. However, gradually improving economic conditions—including stabilizing interest rates and stronger capital markets—should support a more constructive market environment as the year progresses.
Navigating an ever-changing landscape together,
Janice Dumont
Founder and CEO of JD Advisors
2,551
Total Boston Condo Sales in 2025
Analyzed in This Report
▶ Condominium sales across Boston neighborhoods was fairly stable from 2024 to 2025 with a slight decline of 1.7%.
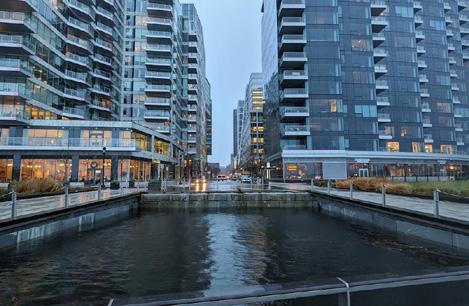
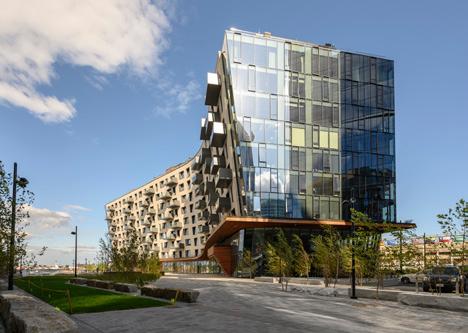
In 2025, 2 new buildings delivered (Trimount Place in South Boston & 1515 Comm Ave in Brighton).
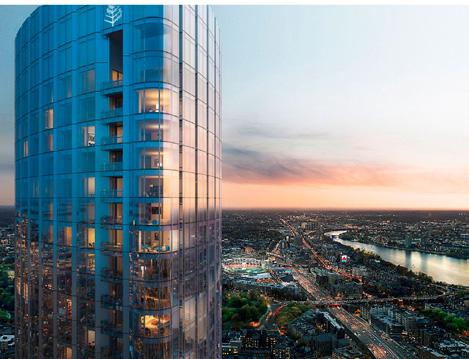
The Ritz Carlton South Station is targeting delivery in Q1 2026.
▶ Q1 2025 sales increased while Q2, Q3, & Q4 decreased when compared to 2024.
▶ This increase is largely attributed to the delivery of 1515 Comm Ave and Trimount Place.
▶ Q2 continues to be the strongest quarter for condominium sales, except for Q2 2020 due to the COVID pandemic.
▶ For a 30-year fixed, on average interest rates were down 0.4% at the end of 2025, compared to end of 2024.
▶ In 2025, the US Federal Reserve cut interest rates three times (September, October, December) for a total of 75 basis points.
▶ This chart highlights the inverse relationship between interest rates and home sales.
▶ When the Fed began cutting interest rates in September 2025, the following quarter showed clear improvement compared to 2024.
▶ The total number of mortgage applications that resulted in purchases in MA declined 21.8% from 2022 to 2023 but remained fairly stable between 2023 and 2024, aligning with interest rate trends. At the time of this report, 2025 data is not yet available.
13.2% Drop in Monthly Payments Since 2023 Peak From $10,912 to $9,473

Note: Interest rate estimate is based on buyer having good credit. Monthly payment does not include property taxes or HOA Fees. Rates provided by RATE as of 12/31 YOY.
▶ Monthly mortgage payments in 2025 declined 5.1% from 2024 and were down 13.2% from the 2023 peak, as interest rates eased from their highs. The improvement from 2023 levels reflects a meaningful shift in affordability for buyers. At the end of 2025, monthly mortgage payments and interest rates were almost back to 2022 levels.
▶ From 2024 to 2025, most neighborhoods remained stable but a few saw modest growth.
▶ Neighborhoods that showed a modest change in number of sales were not significant when comparing total sales across all subject neighborhoods.
▶ Days on Market remained relatively stable year over year, ranging approximately 1-3 months.
▶ Pricing fluctuated depending on neighborhood, with several luxury submarkets (Back Bay, Seaport, Waterfront, Midtown) with $/ PSF levels above $1,100+, while more value-driven neighborhoods remained in the $650–$900 range.
South Boston Led the Market
South Boston is the single most active condo market citywide a story of sustained demand in a high-supply corridor.
▶ Total number of sales remained stable year over year, with only 2 neighborhoods (Brighton and South Boston) with new inventory delivering.
▶ Midtown (19%, +17 sales) and Fenway (17%, +11 sales) recorded strong year-overyear sales increases.In Midtown, increased activity was primarily driven by higher resale volume at Millenium Tower, which recorded 17 sales in 2025 compared to 8 in 2024. In Fenway, The Pierce saw 11 sales in 2025, up from 6 the prior year.
▶ East Boston (-13%, -34 sales) and West End (-26%, -10 sales) saw notable declines.In East Boston, 2024 totals were bolstered by the initial closings at Mira, which delivered that year and accounted for 34 sales.
▶ Also notable, Winthrop Center had 42 sales in 2024 and 33 sales in 2025.
▶ Seaport District ($2.64M), Midtown ($2.43M), and Back Bay ($2.25M) continued to command the
▶ Most transactions stemmed from resales and remaining/shadow inventory from prior developments, rather than new construction.
Boston’s Luxury Core Holds
The Seaport District, Midtown, and Back Bay remain Boston’s highestpriced neighborhoods in 2025. This premier triad consistently anchors the upper tier, reflecting sustained demand for ultra-luxury living.
▶ Despite a slower pace than prior years, sales volume in these neighborhoods signaled sustained demand in Boston’s premier luxury submarkets.
$1,798/SF
Markets
Seaport advanced modestly, while Midtown and Back Bay remained flat. Prime locations continue to command a premium, although buyers remain more price conscious than in prior cycles.
▶ Overall, Buyers continue to pay a premium for prime locations and well-positioned product, while still more price sensitive than in prior years.
Days on market held steady at roughly two months, with no neighborhood exceeding 100 days,
▶ Average days on market remained unchanged year over year, with approximately 2 months on market.
▶ A few neighborhoods showed slightly higher DOM: Midtown (87), Seaport District (97), Leather District (85), Waterfront (77), and West End (77). ▶ Neighborhoods with the lower days on market in 2025 include Fort
New Construction Condominium Buildings Actively Selling in 2025
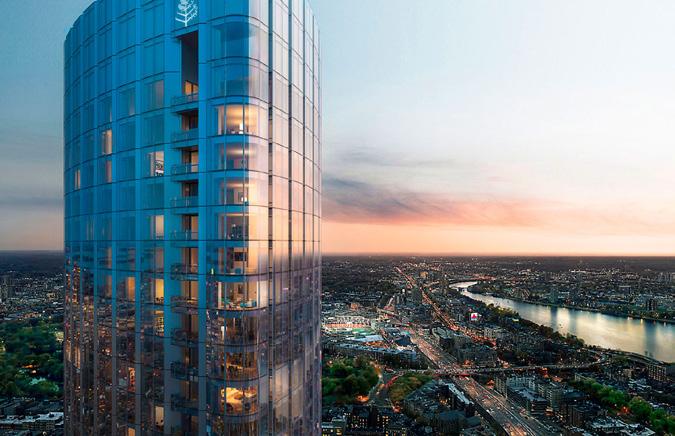
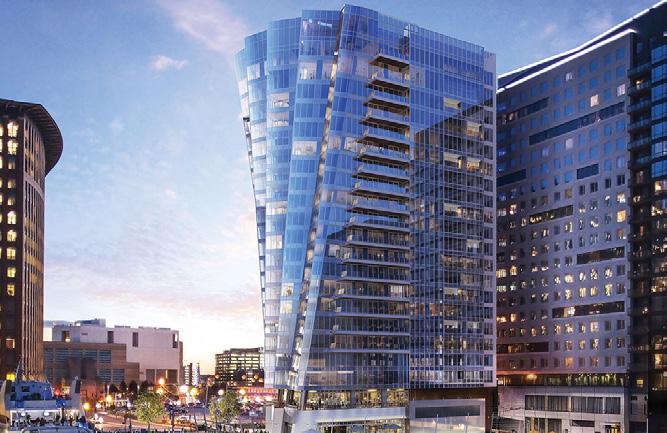
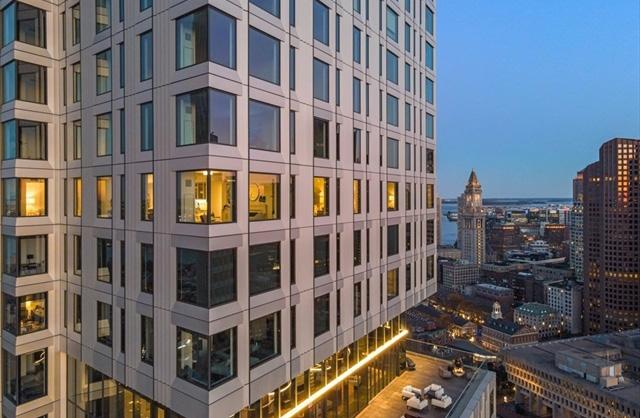
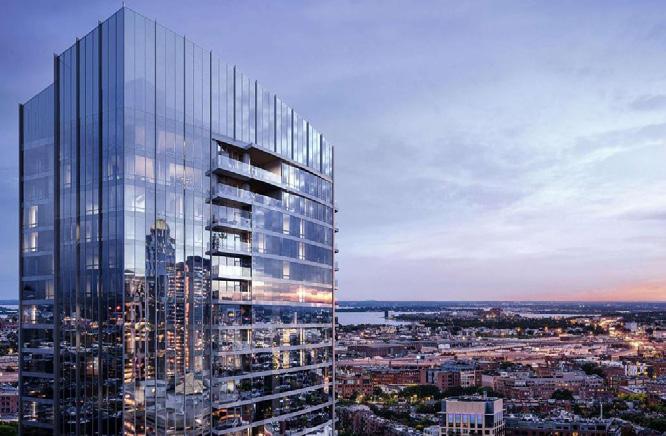
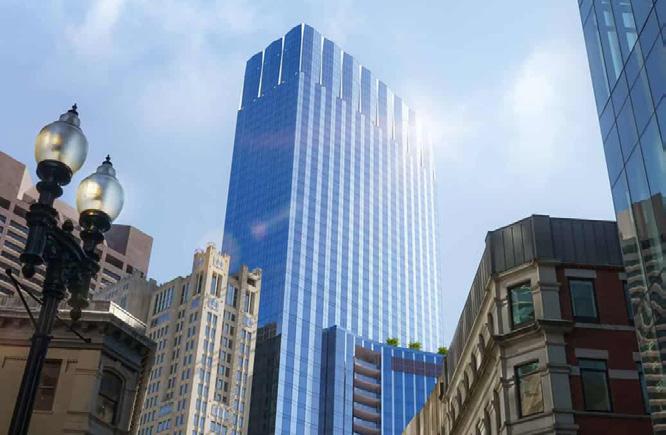
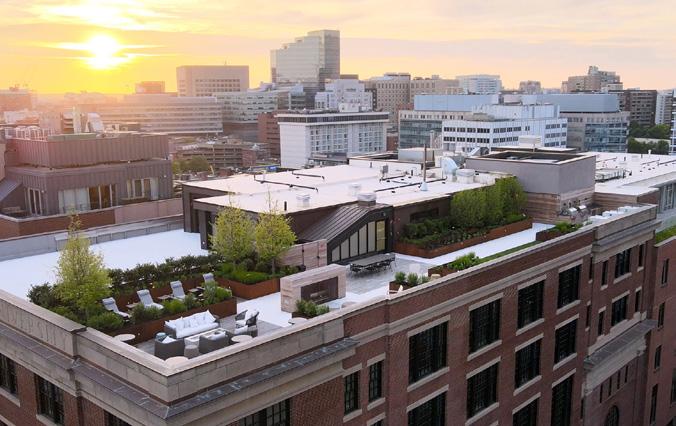
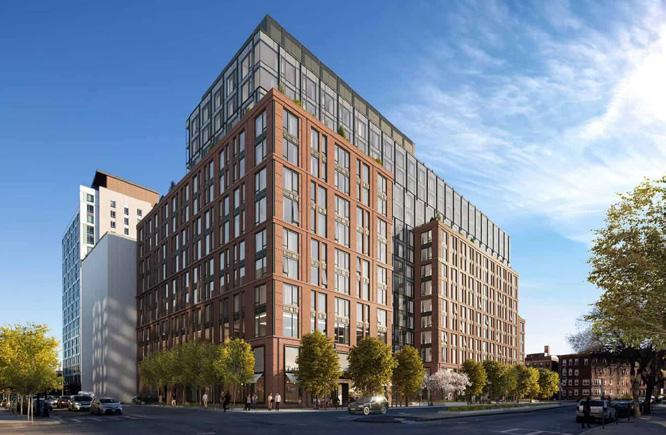
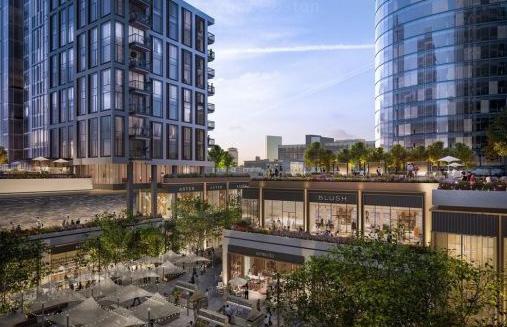
Data is cumulative sales. Building’s reflect new construction condominium homes with 50+ units that were actively selling in 2025. Data is based on sourcing from MLS and the Registry of Deeds. Totals may not reflect any
New Construction Condominium Buildings Actively Selling in 2025
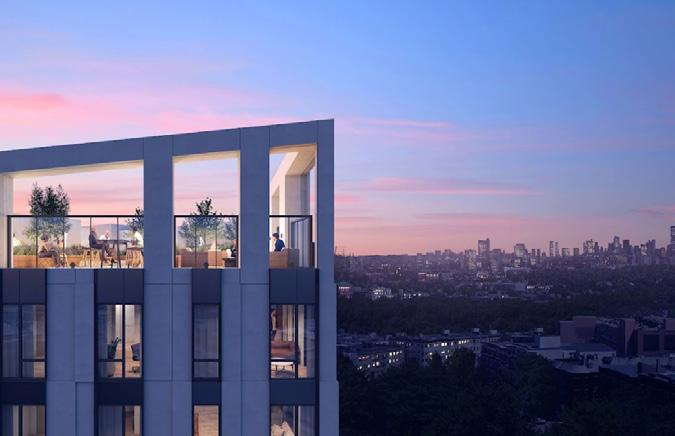
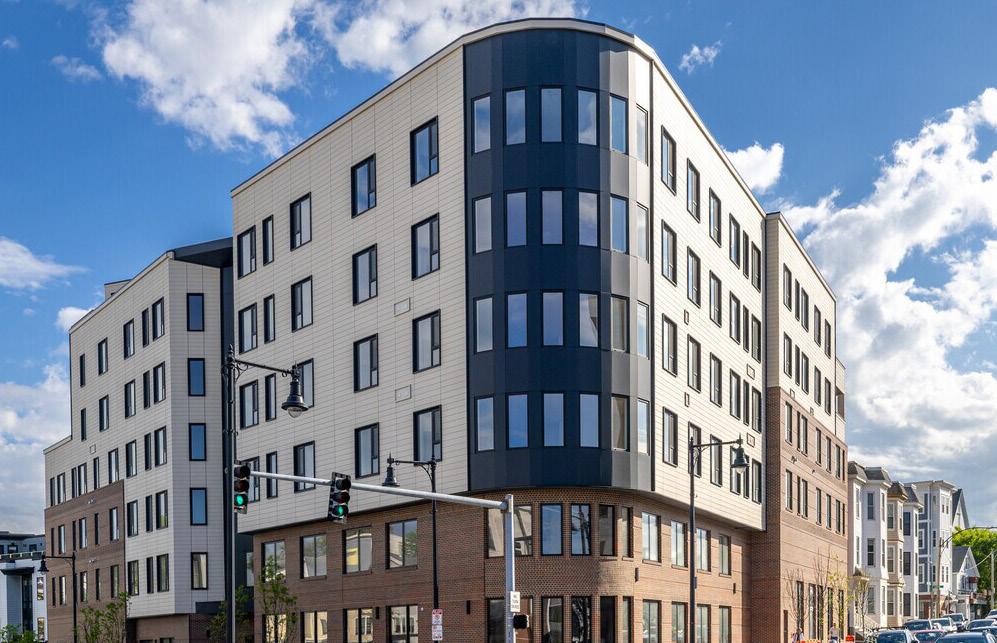
1515 COMM AVE Brighton / 1515 Commonwealth Ave
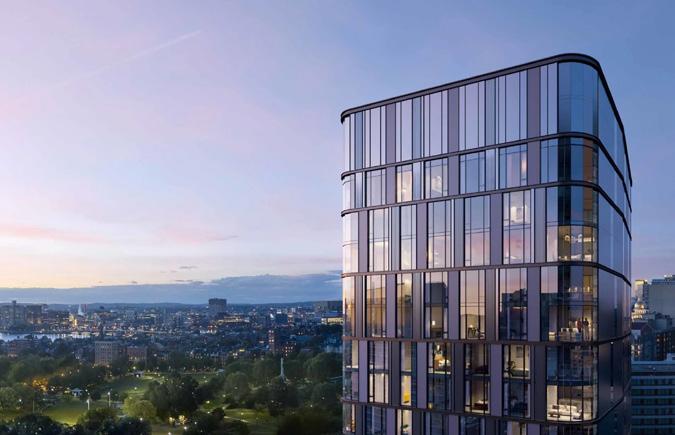
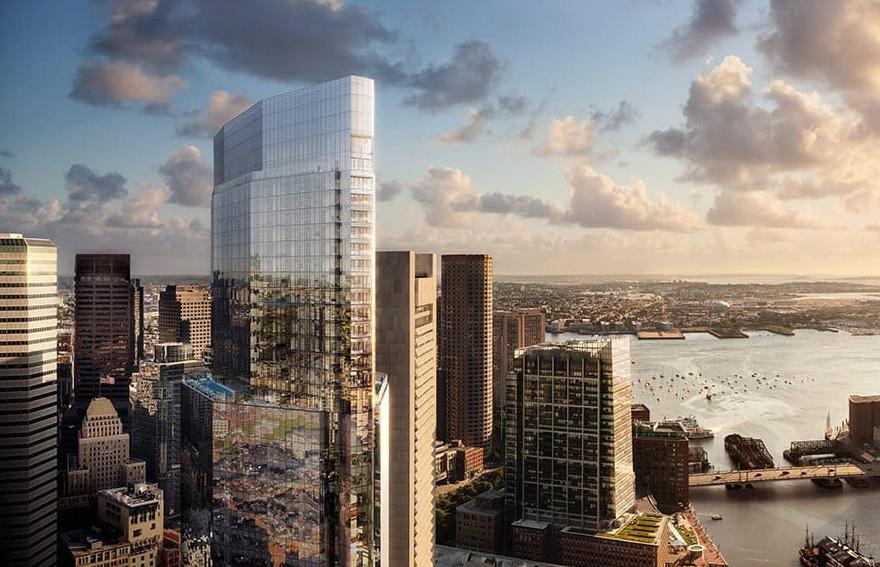
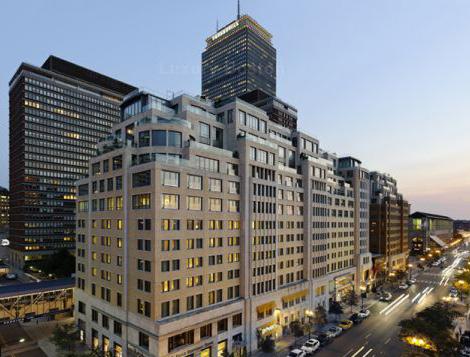
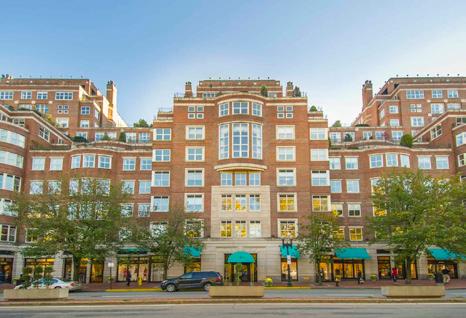
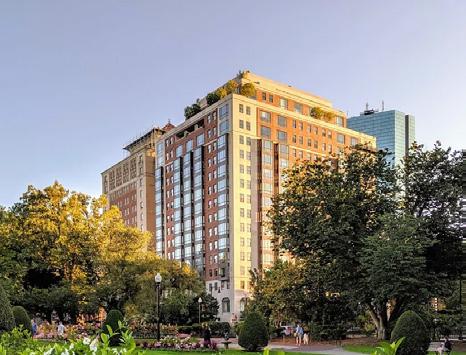
▶ Many of Boston’s largest luxury condo developments are approaching sellout, with 154 total market-rate closings across the analyzed buildings in 2025.
▶ Trimount Place and 1515 Comm Ave began closings in 2025, contributing to overall transaction volume.
▶ The buidings with the highest number of closings were 1515 Comm Ave (40), Winthrop Center (33), and Trimount Place (17).
* No closings have yet occurred at The Ritz-Carlton South Station, however, 15 homes show under agreement in MLS and does not include pending reservations.
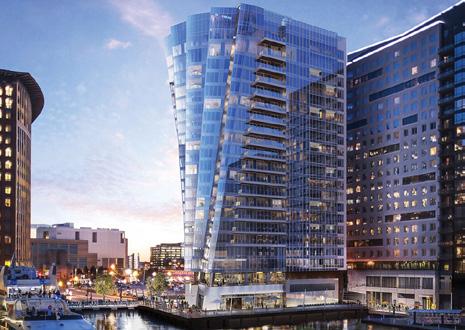
Visible inventory is artificially low. A hidden pipeline of 535 shadow units means the market is nearing saturation, threatening current pricing power.
The Shadow Inventory Story Will Unfold in 2026
Equilibrium in the market is considered 6-months supply and as of the end of 2025, present inventory is at 46-months supply in the top 12 new buildings.
Extensive shadow inventory signals greater supply than demand. To accelerate absorption in 2026, projects must leverage strategic positioning with dynamic pricing models adapting and adjusting to market conditions.
▶ Total new construction supply across all buildings is 581 units, including 535 units in shadow inventory and 46 currently active on MLS, representing roughly 3.8 years of inventory based on the 2025 absorption pace of 154 sales.
▶ Newly delivered buildings like 1515 Commonwealth Ave and Trimount Place are contributing to current availability, alongside larger remaining inventory at properties such as Winthrop Center and Ritz-Carlton South Station Tower.
▶ The next wave of supply ahead includes Ritz-Carlton South Station Tower (148 units in shadow) and is expected to begin closings in Q1 2026, with additional inventory also anticipated from One Harbor Shore in the Seaport (122 total units), for a total of 270 units.

▶ Studios saw average price declines in 2025, likely related to less new luxury supply, while 2-beds also fell 8%, and 1-beds remained relatively steady near 2023 levels.
5-beds homes averaged $1.7M in 2025, down significantly from 2024, with results heavily influenced by the small number of sales and variations in neighborhood, square footage, and building type.
$/SF Gap

$0-$499,000
$500,000-$999,999
$1M-$1.99M
$2M-$2.99M
$3M-$3.99M
$4M-$4.99M
$5M-$9.99M
▶ At the end of 2025, Boston’s condominium inventory increased by 8.3% and average days on market rose from 120 to 127 days.
▶ The median price declined to $1,049,990 and the average price to $2,105,224, with increased activity in the $500K–$999K range. Higher-end properties above $2M generally experienced longer selling timelines, with the exception of the $3M–$3.99M segment, which saw improved days on market.
“ Success is not a random act. It arises out of a predictable and powerful set of circumstances and opportunities.”
- MALCOLM GLADWELL
As 2026 begins, Boston’s luxury condo market will demand preparation, pricing discipline, and precise execution.
Expect a soft start to the year. With approximately 535 shadow units at the end of 2025, MLS inventory up 8.3%, and pricing down 10.4%, buyers will hold meaningful leverage through Q1 and likely into Q2. This environment reflects a market recalibration—not a correction—as Boston’s core fundamentals remain firmly intact.
The Federal Reserve’s cumulative 75 basis points of rate cuts (three 25 basis points reductions) have reduced monthly payments by approximately 13.2% from the 2023 peak, helping to unlock rate-sensitive demand. However, near-term uncertainty remains elevated. As of this publication, the potential economic impact of the 2026 Iran conflict is unclear, particularly as it relates to buyer confidence and broader market stability. Key variables to monitor include:
• Interest Rates: The Fed held rates in January and March—will this pause continue into Q2?
• Inflation: Continuing to be stable around 2.4% early 2026, will inflation remain contained through the first half of 2026?
• Equity Markets: Following strong 2025 performance (S&P +16.4%, Nasdaq +20.5%), will the geopolitical environment influence continued growth and high-end buyer sentiment?
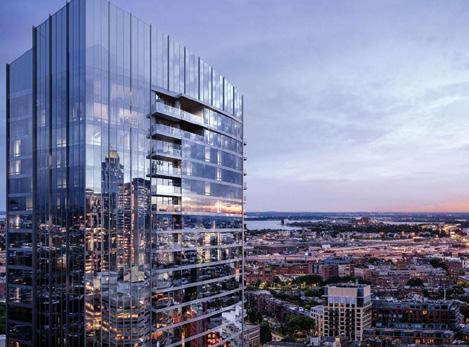
Shadow inventory remains the defining factor in Boston’s luxury segment. Several major developments have delivered or are delivering in early 2026, including Winthrop Center (166 shadow inventory units), The Ritz-Carlton South Station Tower (148 shadow inventory units), and The Parker (64 shadow inventory units), with additional luxury supply emerging from new projects such as One Harbor Shore.
In this environment, static pricing strategies are no longer effective. Developers and sellers must adopt dynamic pricing models that respond in real time to absorption trends and competitive supply.
Understanding the true scale of inventory is critical. While reported days on market have increased modestly (+8.3%), these figures do not fully capture the shadow supply. When factoring in this off-market inventory, months of supply expand dramatically—potentially exceeding 46 months compared to roughly 5 months reflected in MLS data alone. This disconnect underscores the need for a more comprehensive view of market conditions and the subsequent impact on absorption.
2026 will reward disciplined strategy and flawless execution. The market is in the midst of a reset—participants who adapt quickly to evolving supply dynamics and buyer expectations will be best positioned to lead the next cycle, while those who do not risk falling behind.
This report’s Urban Data Neighborhoods include: Allston, Back Bay, Bay Village, Beacon Hill, Brighton, Charlestown, Chinatown, East Boston, Financial District, Fort Point, Jamaica Plain, Leather District, Midtown, North End, Seaport District, South Boston, South End, South Station, The Fenway, Theatre District, Waterfront, and West End.
This report includes publicly available data from MLS and The Registry of Deeds. Historical Mortgage Rate data includes publicly available information from Freddie Mac and FFIEC.
JANICE
Founder & CEO 508.277.7707 jdumont@jdadvisors.com

JENNIFER
781.608.5887 jfrizzell@jdadvisors.com