3 minute read
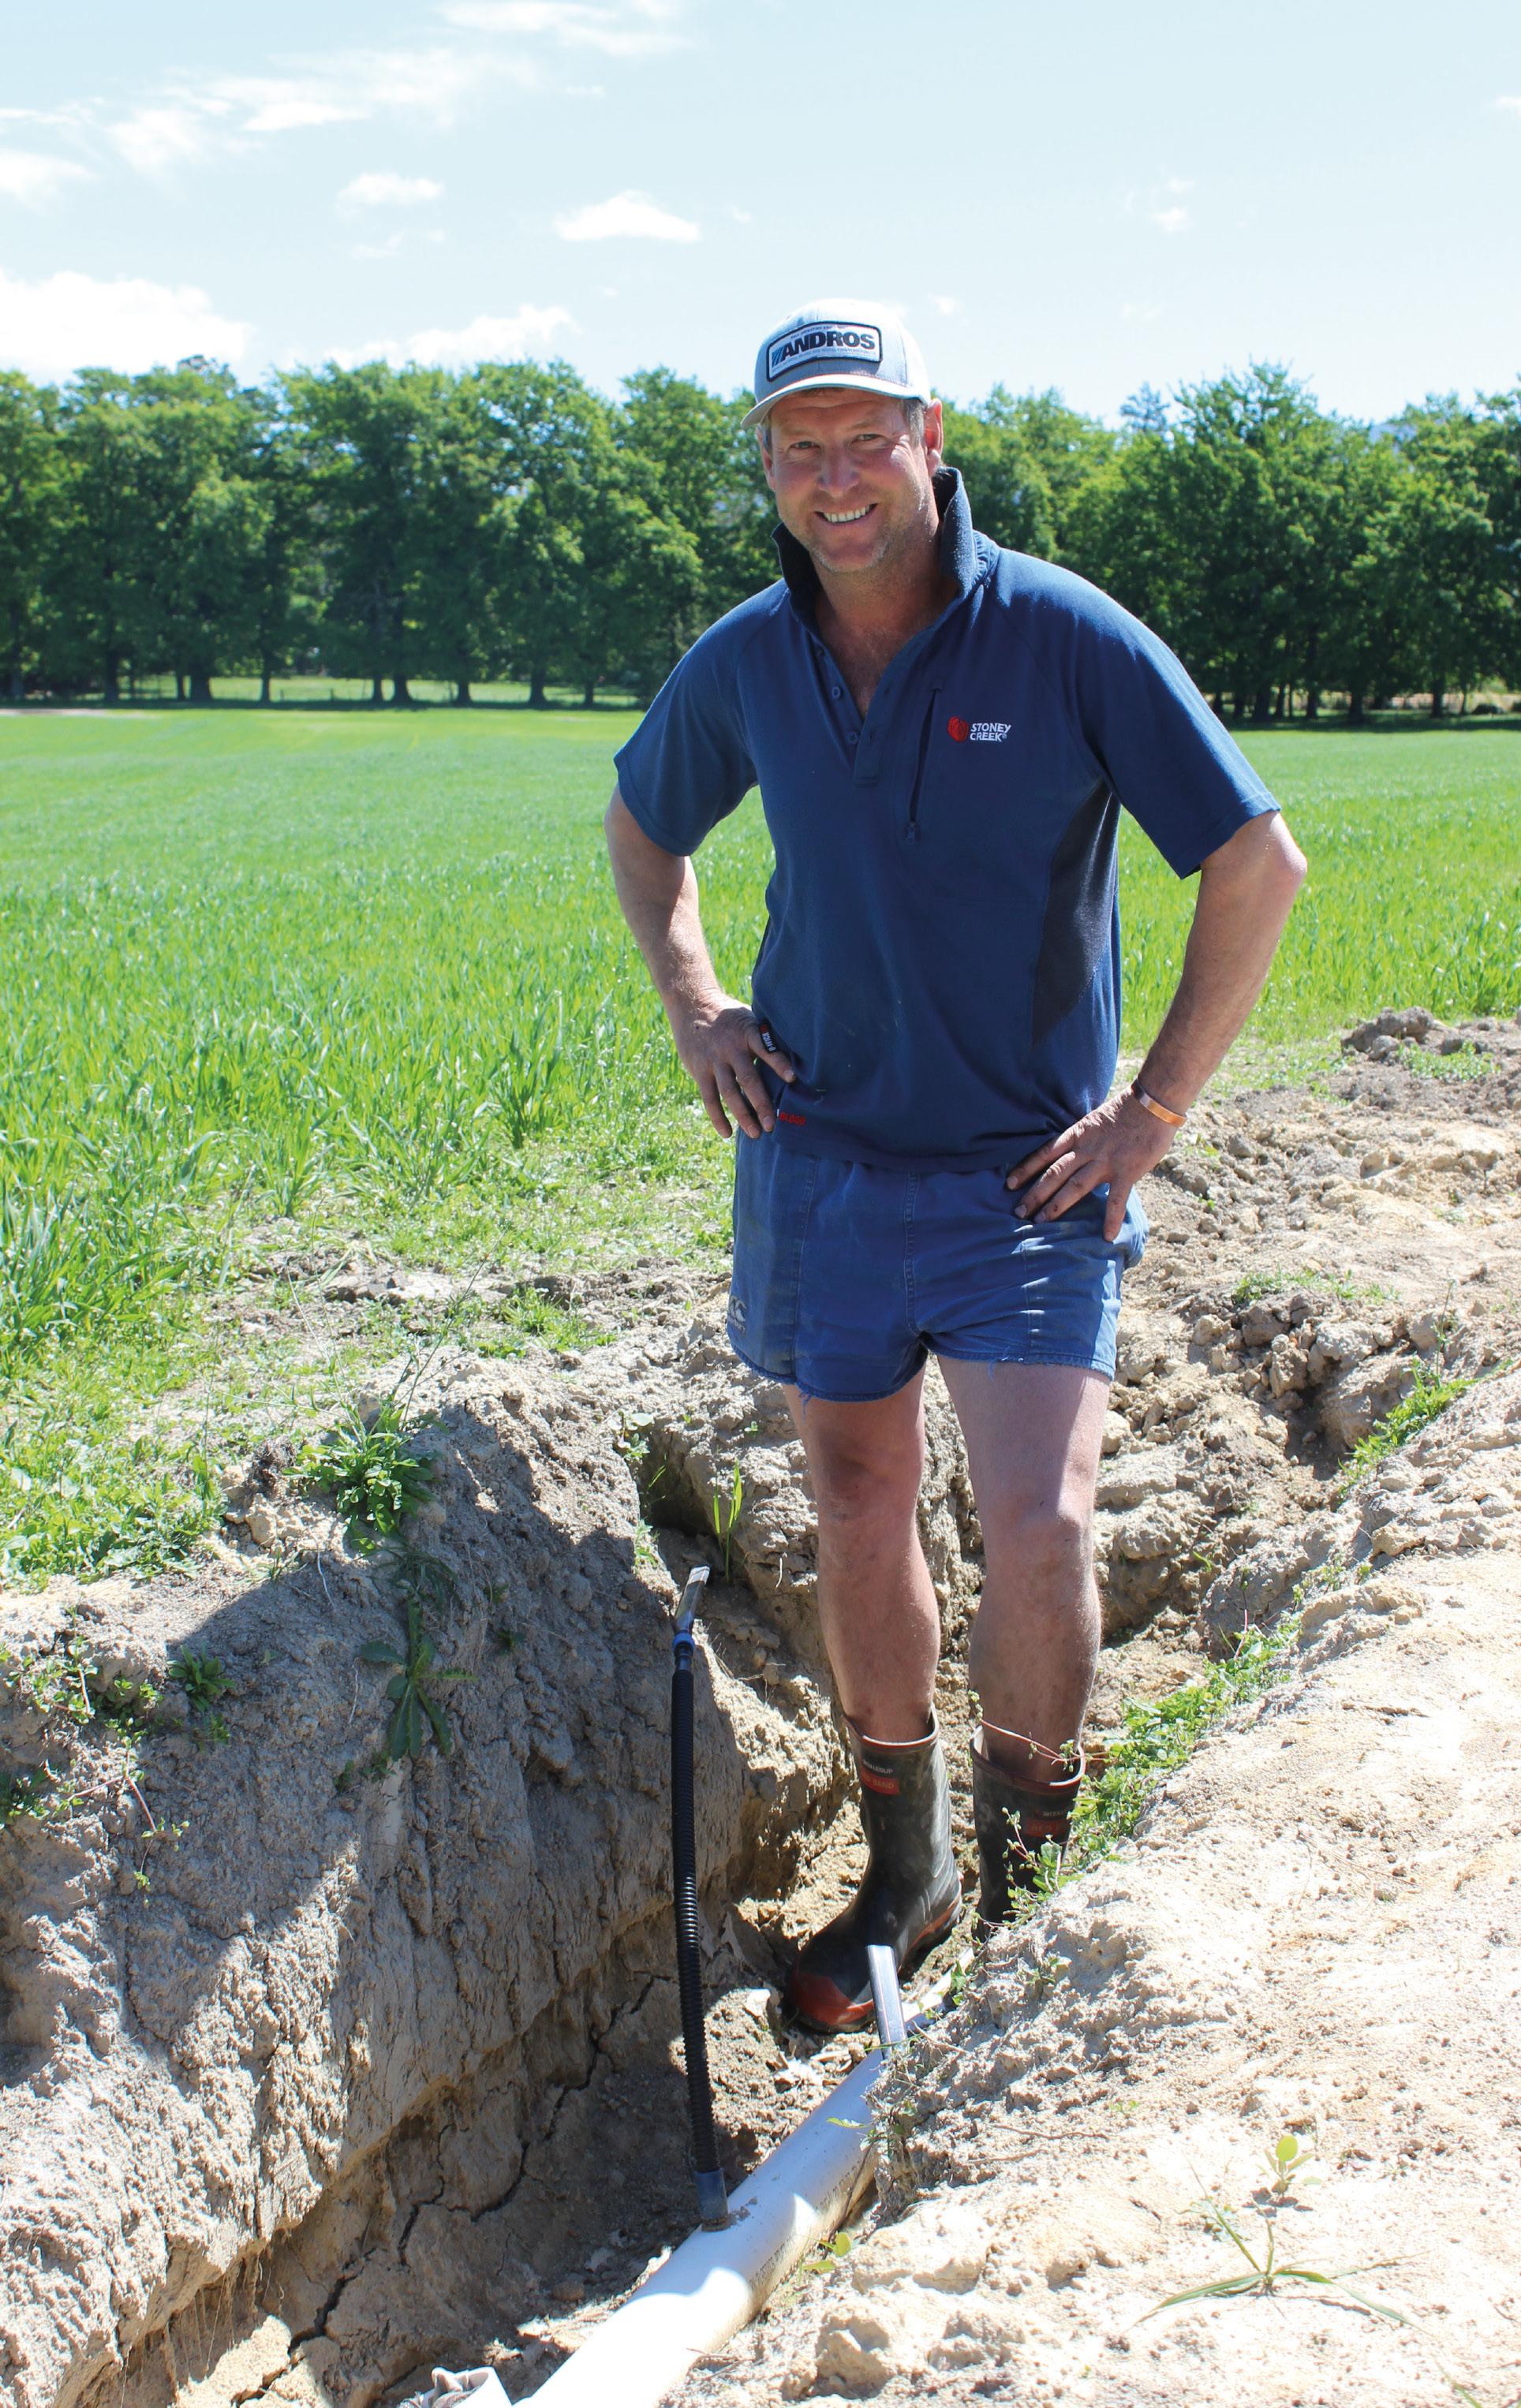
Irrigation in Pictures


A closer look at irrigation and decision making
Advertisement
Pamela Booth is an Associate Economist with Manaaki Whenua – Landcare Research based in Wellington. She is interested in freshwater use and farmer decision making and has expertise in survey design and analysis.
The Survey of Rural Decision Makers (SRDM) has been conducted every second year since 2013. It samples from farmers, growers, and foresters nationwide.
The questionnaire is developed in partnership with government ministries, industry groups, regional councils, and other stakeholders. In each wave of the survey, the questionnaire is revised to reflect contemporary issues in the primary sector. Questions related to water irrigation were added in 2017. Approximately 4,500 responses were received in 2017 and nearly 3,800 responses in 2019, split evenly between commercial production and lifestyle farmers across all 16 regions of New Zealand.
WATER IRRIGATION ACROSS THE COUNTRY
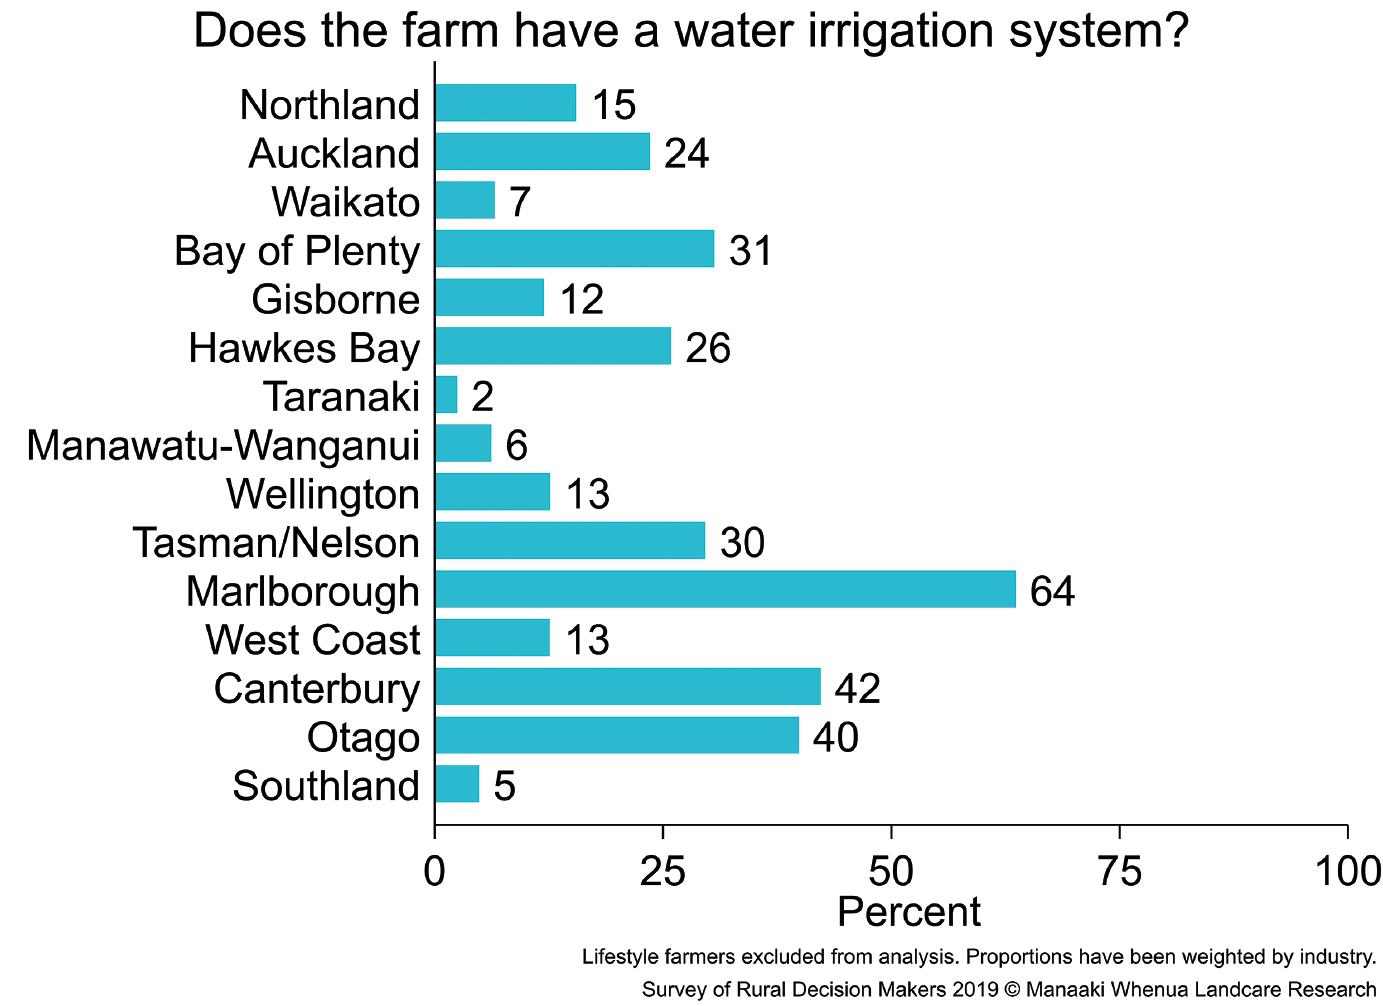
Among commercial respondents, 19 percent had water irrigation. However, the proportion of respondents with irrigation varies by sector and region. Unsurprisingly, irrigation is common in horticulture, viticulture, and arable farming: 90 percent of wine grape growers and 85 percent of vegetable and flower growers have irrigation (Fig. 1). Irrigation is also common in regions with large horticulture, viticulture, and arable farming, e.g. 64 percent of respondents in Marlborough irrigate. Interestingly, irrigation is relatively uncommon across the North Island (Fig. 3).
Travelling and manual moving irrigation, such as K-Line or rotorainers, are the most common systems, but 19 percent of respondents have drip irrigation, seven percent have surface systems (e.g. contour) and two percent have subsurface irrigation (Fig. 2). Respondents also use several methods to determine when and how much to irrigate including 40 percent who irrigate when the plants look like they need water, 31 percent who use soil moisture sensors, and two percent who use weather forecasts.
Those in horticulture, viticulture and arable farming predominately use ground water for irrigation while those in livestock predominately use surface water. Approximately 85 percent of respondents in Auckland and Hawke’s Bay primarily used ground water while 80–85 percent of respondents in Gisborne, Taranaki, and Otago primarily rely on surface water for their irrigation systems. Twenty-five percent of respondents who irrigate also rely on water from their on-farm and/or on-scheme storage.
TRADE-OFFS AND LONG-TERM DECISIONS
The 2019 SRDM included questions about changes in priorities for onfarm decision making. 60 percent of respondents reported that improving water quality was at least a moderate priority in the last five years. That proportion increases to 67 percent of respondents who expect to make improving water quality at least a moderate priority in the next five years. While 58 percent of respondents report a moderate or major focus on using water more efficiently in the last five years, 65 percent expect to put a moderate or major focus on using water more efficiently in the next five years. This increase could be attributed to challenges such as drought. For example, approximately 70 percent of respondents are concerned about the frequency and/or intensity of drought increasing by 2050.
Investing in irrigation is not usually considered a quick decision because of complex trade-offs and uncertainty around return-oninvestment. The 2017 SRDM compared benefits of irrigation actually realised with expectations of potential benefits of irrigation (Fig. 4). Among respondents who irrigate, 88 percent said installing irrigation improved their farm performance. At least five percent of respondents also said the best decision they made on-farm within the last few years was to increase water storage, improve drainage and/or invest in
Figure 1. (Source: Manaaki Whenua Landcare Research)

Figure 2. (Source: Manaaki Whenua Landcare Research)