Human Factors in Simulation and Training
Application and Practice
Second Edition
Edited by
Dennis
Vincenzi,
Mustapha Mouloua, P. A. Hancock, James A. Pharmer, and James C. Ferraro
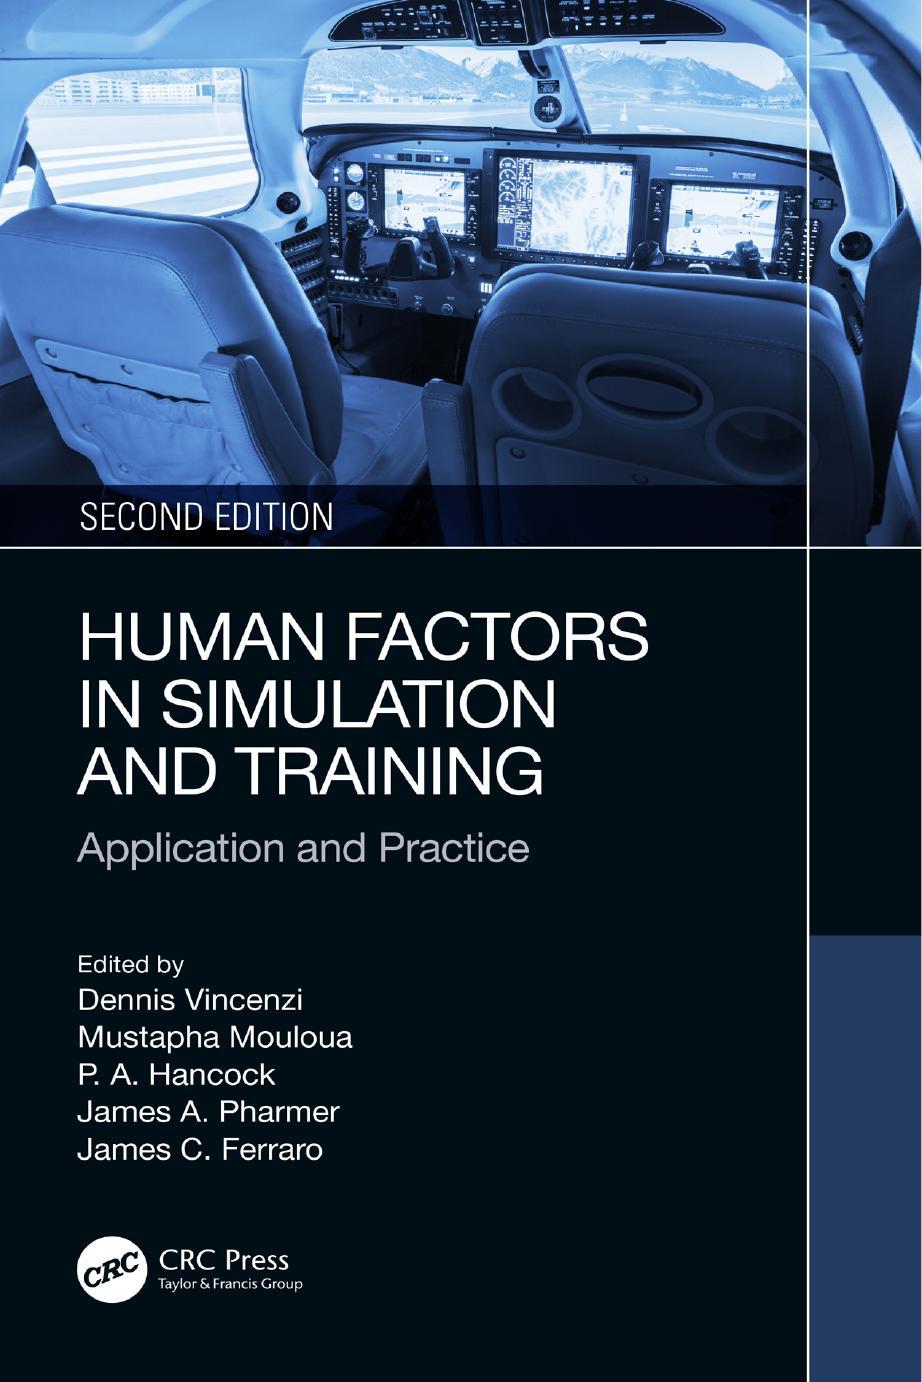
Front cover image: Nadezda Murmakova/Shutterstock
Second edition published 2024 by CRC Press
2385 NW Executive Center Drive, Suite 320 Boca Raton, FL 33431
and by CRC Press
4 Park Square, Milton Park, Abingdon, Oxon, OX14 4RN
CRC Press is an imprint of Taylor & Francis Group, LLC
© 2024 selection and editorial matter, Dennis Vincenzi, Mustapha Mouloua, Peter A. Hancock, James A. Pharmer, and James C. Ferraro; individual chapters, the contributors
First edition published by CRC Press 2019
Reasonable efforts have been made to publish reliable data and information, but the author and publisher cannot assume responsibility for the validity of all materials or the consequences of their use. The authors and publishers have attempted to trace the copyright holders of all material reproduced in this publication and apologize to copyright holders if permission to publish in this form has not been obtained. If any copyright material has not been acknowledged please write and let us know so we may rectify in any future reprint.
Except as permitted under U.S. Copyright Law, no part of this book may be reprinted, reproduced, transmitted, or utilized in any form by any electronic, mechanical, or other means, now known or hereafter invented, including photocopying, microfilming, and recording, or in any information storage or retrieval system, without written permission from the publishers.
For permission to photocopy or use material electronically from this work, access www.copyright.com or contact the Copyright Clearance Center, Inc. (CCC), 222 Rosewood Drive, Danvers, MA 01923, 978-750-8400. For works that are not available on CCC please contact mpkbookspermissions@tandf.co.uk
Trademark notice: Product or corporate names may be trademarks or registered trademarks and are used only for identification and explanation without intent to infringe.
ISBN: 978-1-032-51249-5 (hbk)
ISBN: 978-1-032-51250-1 (pbk)
ISBN: 978-1-003-40135-3 (ebk)
DOI: 10.1201/9781003401353
Typeset in Times by Deanta Global Publishing Services, Chennai, India
.......................................................................................................................
...........................................................................................................
Chapter 1 Controls and Displays for Aviation Research Simulation: A Historical Review 1
Gloria L. Calhoun and Kristen K. Liggett
Chapter 2 Augmented Reality as a Means of Job Task Training in Aviation ..... 65
Dan Macchiarella, Jiahao Yu, Dahai Liu, and Dennis A. Vincenzi
Chapter 3 Civil Aviation: Flight Simulators and Training.................................. 87
Ronald J. Lofaro and Kevin M. Smith
Chapter 4 Integrating Effective Training and Research Objectives: Lessons from the Black Skies Series of Exercises ........................... 129
Christopher Best, Gregory Funke, Winston Bennett, Michael Tolston, Simon Hosking, and Robert Bolia
Chapter 5 Extended Reality in Training Environments: A Human Factors Trend Analysis.................................................................................. 151
Salim A. Mouloua, Gerald Matthews, John French, and Mustapha Mouloua
Chapter 6 Mitigation of Motion Sickness Symptoms by Adaptive Perceptual Learning: Implications for Space and Cyber Environments ................................................................................... 179
Mustapha Mouloua, John French, Janan A. Smither, and Robert S. Kennedy
Chapter 7 Decision-Making under Crisis Conditions: A Training and Simulation Perspective 209
Jiahao Yu, Tiffany Nickens, Dahai Liu, and Dennis A. Vincenzi
Chapter
Sarah A. Powers and Mark W. Scerbo
Chapter 9 Best Practices in Surgical Simulation ..............................................
Dominique Doster, Christopher Thomas, and Dimitrios Stefanidis
Chapter 10 Healthcare Simulation Methods: A Multifaceted Approach
Amy L. Hanson and Aaron W. Calhoun
Chapter 11 Design and Development of Algorithms for Gesture-Based Control of Semi-Autonomous Vehicles ............................................
Brian Sanders, Yuzhong Shen, and Dennis Vincenzi
Chapter 12 The Influence of New Realities: How Virtual, Augmented, and Mixed Reality Advance Training Methods in Aviation ...................
Graham King, Kendall Carmody, and John Deaton
Chapter 13 Training, Stress, Time Pressure, and Surprise: An Accident Case Study 331
Julianne M. Fox and Mustapha Mouloua
Preface
As we look toward the future, we find that it is neither totally random nor is it totally predictable. This is a truth that persists despite the years that have passed since the publication of the previous edition of this book. We maintain that, if the future were completely predictable, there would be no point looking forward because we would already know what was to come. If it were completely random, we would not bother because we could not know anything systematic about forthcoming events. That life lies between these two polar extremes gives us both the motivation to try to understand the future and the belief that we can do so, at least to a useful degree. Indeed, the triumphs of science encourage us to believe that we are making “progress” in so far as our predictions of the future. At least in relation to many physical processes, these are growing more accurate as the years progress. And, of course, the more we can know about the future, the more we can generate rational courses of action based upon this understanding. This respective confluence of ideas encourages us to develop theories, models, methodologies, and other such instruments to continue to improve our predictive capabilities.
However, although certain forms of prediction work well for some of the simpler physical processes, there are many forms of complex interaction in which our predictive capacities are at present rudimentary at best. Unfortunately, many of these complex processes—global warming, for example—may prove so dangerous to our species that we cannot afford to assert predictions that are radically incorrect. Flawed prediction here can spell our end. As a consequence, we are in ever greater need of technologies that allow us to generate and refine predictions as well as exploring alternative potentialities found to be countertheses and antitheses to these various propositions. One such technology is simulation.
As a tool, simulation is an aid to the imagination. It allows us to create, populate, and activate possible futures and explore the ramifications of these developed scenarios. However, in common with all tools, it performs its task only to the degree that it is open to facile interaction with the user. One can imagine that on many occasions, a poor simulation with its impoverished or wildly inaccurate outcomes might be of even more harm than good. Thus, as with all tools and technologies, we certainly need the application of the branch of science that turns user–machine antagonism into user–machine synergy. That branch of science is human factors. Hence, the focus of this present work is on human factors issues as they pertain to simulation in support of training and predicting humans to do certain tasks. In general, these issues revolve around two central themes, represented uniquely across two books.
The theme of this book is pragmatic and utilitarian in nature because it reflexively asks how simulation itself can help address human factors issues. These include training, design, evaluation, testing, certification, and visualization. In this way, human factors seek to both refine and improve the technology of simulation and then, in turn, benefit from those very improvements. The chapters presented in the following text reflect these general concerns, as well as other emerging and critical
issues. The chapters in this book pertaining to application and practice will expand on concepts of interest to the simulation and training communities regarding simulator usage, particularly with respect to the validity and functionality of simulators as training devices. These chapters provide context to the theory surrounding the use of simulation for the purposes of training or evaluating performance. Topics include controls in aviation research, simulation in surgery, and guidance for applications supporting semi-autonomous vehicle operation. Enveloping both theory and application, this book series will address in detail numerous issues and concepts pertaining to human factors in simulation, gathering this important information into two comprehensive volumes.
Dennis A. Vincenzi
Mustapha Mouloua
P. A. Hancock
James A. Pharmer
James C. Ferraro
Editors
Dennis A. Vincenzi earned his doctoral degree in 1998 from the University of Central Florida in Human Factors and Applied Experimental Psychology and has over 25 years of experience as a Human Factors researcher. He has been employed by Embry-Riddle Aeronautical University from 1999 to 2004, where he held the position of Assistant Professor in the Department of Human Factors and Systems in Daytona Beach. In 2004, Dr. Vincenzi left Embry-Riddle to work for the United States Navy as a Senior Human Factors Engineer at the Naval Air Warfare Center Training Systems Division (NAWCTSD) in Orlando, FL. His duties included performing Human Factors research involving simulation and training system development for a variety of Navy sea and air platforms, including the F/A 18 Hornet and Super Hornet, F-35 JSF, Los Angeles, Ohio, and Virginia class submarines, and Littoral Combat Ship (LCS). He was also heavily involved in research involving pilot selection, human performance, and ground control station design for a number of Navy, Marine Corps, and Special Operations Command Unmanned Aerial Systems (UAS). Since returning to Embry-Riddle Aeronautical University in 2012, Dr. Vincenzi has been involved in research related to UAS and regulatory requirements within the NAS and has been heavily involved in the development of an experimental gesturebased interface used for investigating user preference, usability, and functionality issues related to interface design in virtual environments. Dr. Vincenzi is currently the Program Chair for the Master of Science in Human Factors program at EmbryRiddle Aeronautical University.
Mustapha Mouloua is Professor of Psychology and Director of the Transportation Research Group at the University of Central Florida (UCF), Orlando, FL. He earned his Ph.D. (1992) and M.A. (1986) degrees in Applied/Experimental Psychology from the Catholic University of America, Washington, DC. Before joining the faculty at UCF in 1994, he was Postdoctoral Fellow at the Cognitive Sciences Laboratory of the Catholic University of America from 1992 to1994, where he studied and researched several aspects of human–automation interaction topics sponsored by NASA, and the Office of Naval Research (ONR). He has over over 30 years of experience in the teaching and research related to complex human–machine systems. His research interests include vigilance and sustained attention, cognitive aging, human performance assessment, human–automation interaction, pilot–alerting systems interaction, automation and workload in aviation systems, simulation, and training in transportation systems. Dr. Mouloua made over 300 conference presentations with his undergraduate and graduate students, as well as his professional colleagues. He also has about 200 research publications and scientific reports published in journals and proceedings, such as Experimental Aging Research, Human Factors, Ergonomics, Perception and Psychophysics, Journal of Experimental Psychology: Human Perception and Performance, International Journal of Aviation Psychology, Journal of Cognitive Engineering and Decision Making, Proceedings of the Human
Factors and Ergonomics Society, Applied Ergonomics, Transportation Research Part F: Traffic Psychology and Behaviour, Ergonomics in Design, Transportation Research Record, and International Journal of Occupational Safety and Ergonomics. Together with his colleagues Raja Parasuraman and Robert Molloy, he was the winner of the Jerome Hirsch Ely Award of the Human Factors and Ergonomics Society in 1997. He was previously Director of the Applied/Experimental and Human Factors Psychology doctoral program (2008–2017). At UCF, Dr. Mouloua earned eight prestigious Teaching and Research Awards and was inducted into the UCF College of Sciences Millionaire Club for procuring over $1 million in research funds. He was awarded a UCF “Twenty Years’ Service” award in 2014, was awarded the UCF International Golden Key and Honorary member status in 2011, and his research was selected to be among the top 30 best published research articles in the last 50 years by the Human Factors and Ergonomics Society in 2008.
P. A. Hancock, D.Sc., Ph.D., is Provost Distinguished Research Professor in the Department of Psychology and the Institute for Simulation and Training, as well as at the Department of Civil and Environmental Engineering and the Department of Industrial Engineering and Management Systems at the University of Central Florida (UCF). At UCF in 2009, he was created the 16th ever University Pegasus Professor (the Institution’s highest honor) and in 2012 was named 6th ever University Trustee Chair. He directs the MIT 2 Research Laboratories. He is the author of over 1,100 refereed scientific articles, chapters, and reports as well as writing and editing more than 25 books. He has been continuously funded by extramural sources for every one of the forty years of his professional career. This includes support from NASA, NSF, NIH, NIA, FAA, FHWA, NRC, NHTSA, DARPA, NIMH, and all of the branches of the US Armed Forces. He has presented or been an author on over 1,200 scientific presentations. In association with his colleagues Raja Parasuraman and Anthony Masalonis, he was the winner of the Jerome Hirsch Ely Award of the Human Factors and Ergonomics Society for 2001, the same year in which he was elected a Fellow of the International Ergonomics Association. In 2006, he won the Norbert Wiener Award of the Systems, Man and Cybernetics Society of the Institute of Electrical and Electronics Engineers (IEEE), being the highest award that Society gives for scientific attainment. He is a Fellow and past President of the Human Factors and Ergonomics Society and a Fellow and twice past President of the Society of Engineering Psychologists as well as being a former Chair of the Board of the Society for Human Performance in Extreme Environments. Most recently he has been elected a Fellow of the Royal Aeronautical Society (RAeS) and in 2016 was named the 30th Honorary Member of the Institute of Industrial and Systems Engineers (IISE). He currently serves as a member of the United States Air Force, Scientific Advisory Board (SAB), and has also served on the US Army Science Board (ASB). He is also a Fellow of AAAS and IEEE.
James Pharmer is the Chief Scientist for the Research, Development, Test, and Evaluation (RDT&E) Department and the Head of the Experimental and Applied Human Performance Research and Development (R&D) Division at the Naval Air
Warfare Center Training Systems Division (NAWCTSD) in Orlando, Florida.. He is a Naval Air Warfare Center Aviation Division (NAWCAD) Fellow and has over 20 years of experience in training and human performance R&D for advanced military systems across a variety of warfare domains. His work includes conducting R&D and direct participation on systems acquisition teams to support human systems integration (HSI) implementation for Navy ships, aircraft, and systems. He chairs multiple working groups to develop HSI policy, processes, and education. He holds a doctoral degree in Applied Experimental Human Factors Psychology from the University of Central Florida and a master’s degree in Engineering Psychology from the Florida Institute of Technology.
James C. Ferraro is a human factors research scientist specializing in simulation and game-based assessment of human performance in complex systems. He earned his Ph.D. in Human Factors and Cognitive Psychology from the University of Central Florida (UCF) in 2022 and his M.A. in Applied Experimental and Human Factors Psychology from UCF in 2019. Dr. Ferraro has led and contributed to a number of research efforts in support of government-sponsored (NAVAIR, USAF) projects to improve training and selection of personnel in various occupations. Areas include air traffic control, tactical urban warfare, explosive ordnance disposal, special forces rotary wing operations, and unmanned aircraft operations. His research on topics such as pilot/operator attentional strategies, trust in automated systems, and predictors of individual performance has been presented at local, regional, and international conferences (Human Factors and Ergonomics Society Annual Meeting, International Symposium on Aviation Psychology, Conference on Applied Human Factors and Ergonomics) and published in multiple academic journals (Ergonomics, Applied Ergonomics). He is the technical editor of the two-volume book set Human Performance in Automated and Autonomous Systems (2019) and the co-author of published book chapters pertaining to human monitoring of automated systems and the role of trust in unmanned vehicle operations. Dr. Ferraro is currently a Senior Research Scientist with Adaptive Immersion Technologies, based in Tampa, FL.

Contributors
Winston Bennett
Air Force Research Laboratory, Warfighter Interactions and Readiness Division
Wright-Patterson Air Force Base, OH
Christopher Best
Human and Decision Sciences Division, Defence Science and Technology Group Melbourne, Australia
Robert Bolia
Air and Space Division, Defence Science and Technology Group Melbourne, Australia
Aaron W. Calhoun
University of Louisville School of Medicine Louisville, KY
Gloria L. Calhoun
Air Force Research Laboratory (retired)
Wright-Patterson Air Force Base, OH
Kendall Carmody
Florida Institute of Technology Melbourne, FL States
John Deaton
Florida Institute of Technology Melbourne, FL
Dominique Doster
Indiana University School of Medicine Indianapolis, IN
Julianne M. Fox
Decision Speed, Inc. Larkspur, CA
John French
Embry-Riddle Aeronautical University
Daytona Beach, FL
Gregory Funke
Air Force Research Laboratory
Wright-Patterson Air Force Base, OH
Amy L. Hanson
University of Louisville School of Medicine Louisville, KY
Simon Hosking
Human and Decision Sciences Division, Defence Science and Technology Group
Melbourne, Australia
Robert S. Kennedy*
Graham King
Florida Institute of Technology Melbourne, FL
Kristen K. Liggett
Air Force Research Laboratory (retired)
Wright-Patterson Air Force Base, OH
Dahai Liu
Embry-Riddle Aeronautical University
Daytona Beach, FL
Ronald J. Lofaro*
Federal Aviation Administration (retired)
Nickolas D. Macchiarella
Embry-Riddle Aeronautical University
Daytona Beach, FL
Gerald Matthews
George Mason University Fairfax, VA
Mustapha Mouloua
University of Central Florida Orlando, FL
Salim A. Mouloua
George Mason University Fairfax, VA
Tiffany Nickens
National Aeronautics and Space Administration (NASA) Washington DC
Sarah A. Powers
Old Dominion University Norfolk, VA
Brian Sanders
Embry-Riddle Aeronautical University Daytona Beach, FL
Mark W. Scerbo
Old Dominion University Norfolk, VA
Yuzhong Shen
Old Dominion University Norfolk, VA
Kevin M. Smith
United States Navy (retired) Mesquite, NV
Janan A. Smither
University of Central Florida Orlando, FL
Dimitrios Stefanidis
Indiana University School of Medicine Indianapolis, IN
Christopher Thomas Indiana University School of Medicine Indianapolis, IN
Michael Tolston
Air Force Research Laboratory Wright-Patterson Air Force Base, OH
Dennis A. Vincenzi
Embry-Riddle Aeronautical University Daytona Beach, FL
Jiahao Yu
Embry-Riddle Aeronautical University Daytona Beach, FL
* The editors would like to pay their respects to Dr Robert S. Kennedy and Dr Ronald J. Lofaro, who sadly passed away prior to publication of this book project. We are very grateful for their contributions and dedication to the field of human factors in simulation and training.
1 Controls and Displays for Aviation Research Simulation
DISCLAIMER
The views expressed are those of the authors and do not reflect the official guidance or position of the United States Government, the Department of Defense, or of the United States Air Force.
Statement from DoD: The appearance of external hyperlinks does not constitute endorsement by the United States Department of Defense (DoD) of the linked websites, or the information, products, or services contained therein. The DoD does not exercise any editorial, security, or other control over the information you may find at these locations.
INTRODUCTION
This chapter will trace how controls and displays used in research simulators changed from 1970 through the present to effectively evaluate new crew station technologies for Air Force combat aircraft systems. The early 1970s marked the dawn of the electro-optical (E-O) era in aviation simulators. Actually, there were investigations utilizing E-O instruments as early as the 1930s. For example, in 1937, a cathode ray tube (CRT) based E-O display called the Sperry Flightray was evaluated on a United Airlines’ Flight Research Boeing ( Bassett & Lyman, 1940). Over the next several decades, E-O displays were slowly integrated into predominately electromechanical (E-M) designs, such that pilots (private, commercial and military) were flying cockpits that incorporated a mix of E-M and E-O instruments. Thus, the time boundaries between the E-M and E-O approaches are very vague, even though the design boundaries are clear ( Nicklas, 1958). By the early 1970s, although the majority of operational aircraft contained cockpits based on E-M instruments, cockpit designers were seriously considering the design of cockpits based primarily on E-O displays. Their research during this time frame had a definite influence on aircraft. For instance, the US Navy’s F-18 aircraft introduced in 1983 made extensive use of multifunction CRT displays.
As part of this chapter, several research simulators will be described to illustrate the evolution of control and display technology; also, some lessons learned from the experiments carried out in these simulators will be cited. Unless otherwise stated, all of these simulators were (or are currently) at Wright-Patterson Air Force Base, Ohio.
Finally, the chapter will present changes that are anticipated in control and display technology for future simulations.
FIXED-BASED SIMULATORS
Integrated InformatIon PresentatIon and Control system study (IIPaCss) sImulator, BoeIng, seattle, Wa
At the start of the 1970s, the state-of-the-art in cockpit instrumentation was exemplified by the F-4 Phantom. The Phantom’s two crew stations were composed of all E-M instruments, with the exception of a few single-function CRTs. However, advances in avionics were enabling the inclusion of an increasing number of computer-based functions within aircraft. If all of these additional computer-based functions had to be accessed through single-function E-M instruments, there would not be enough room in the crew station to accommodate all of required controls and displays. Moreover, it was likely that locations outside of the pilot’s primary reach and vision envelope would have to be used. Thus, a new approach to the design of fighter crew stations was clearly needed. One means of preventing the pilot from becoming overloaded was to restrict the information by “time sharing” controls and displays so that only the information, relevant to the pilot’s current task, was available. This restriction led to a change in design requirements. “The requirement exists to develop an integrated control and display system that will present only essential information in a format that can be translated easily by its user into direct control inputs” (Zipoy et al., 1970, p. 1). The answer was to substitute multifunction E-O displays for single-function E-M instruments. However, the question was, “How well can the operators use these new types of displays and their associated controls?”
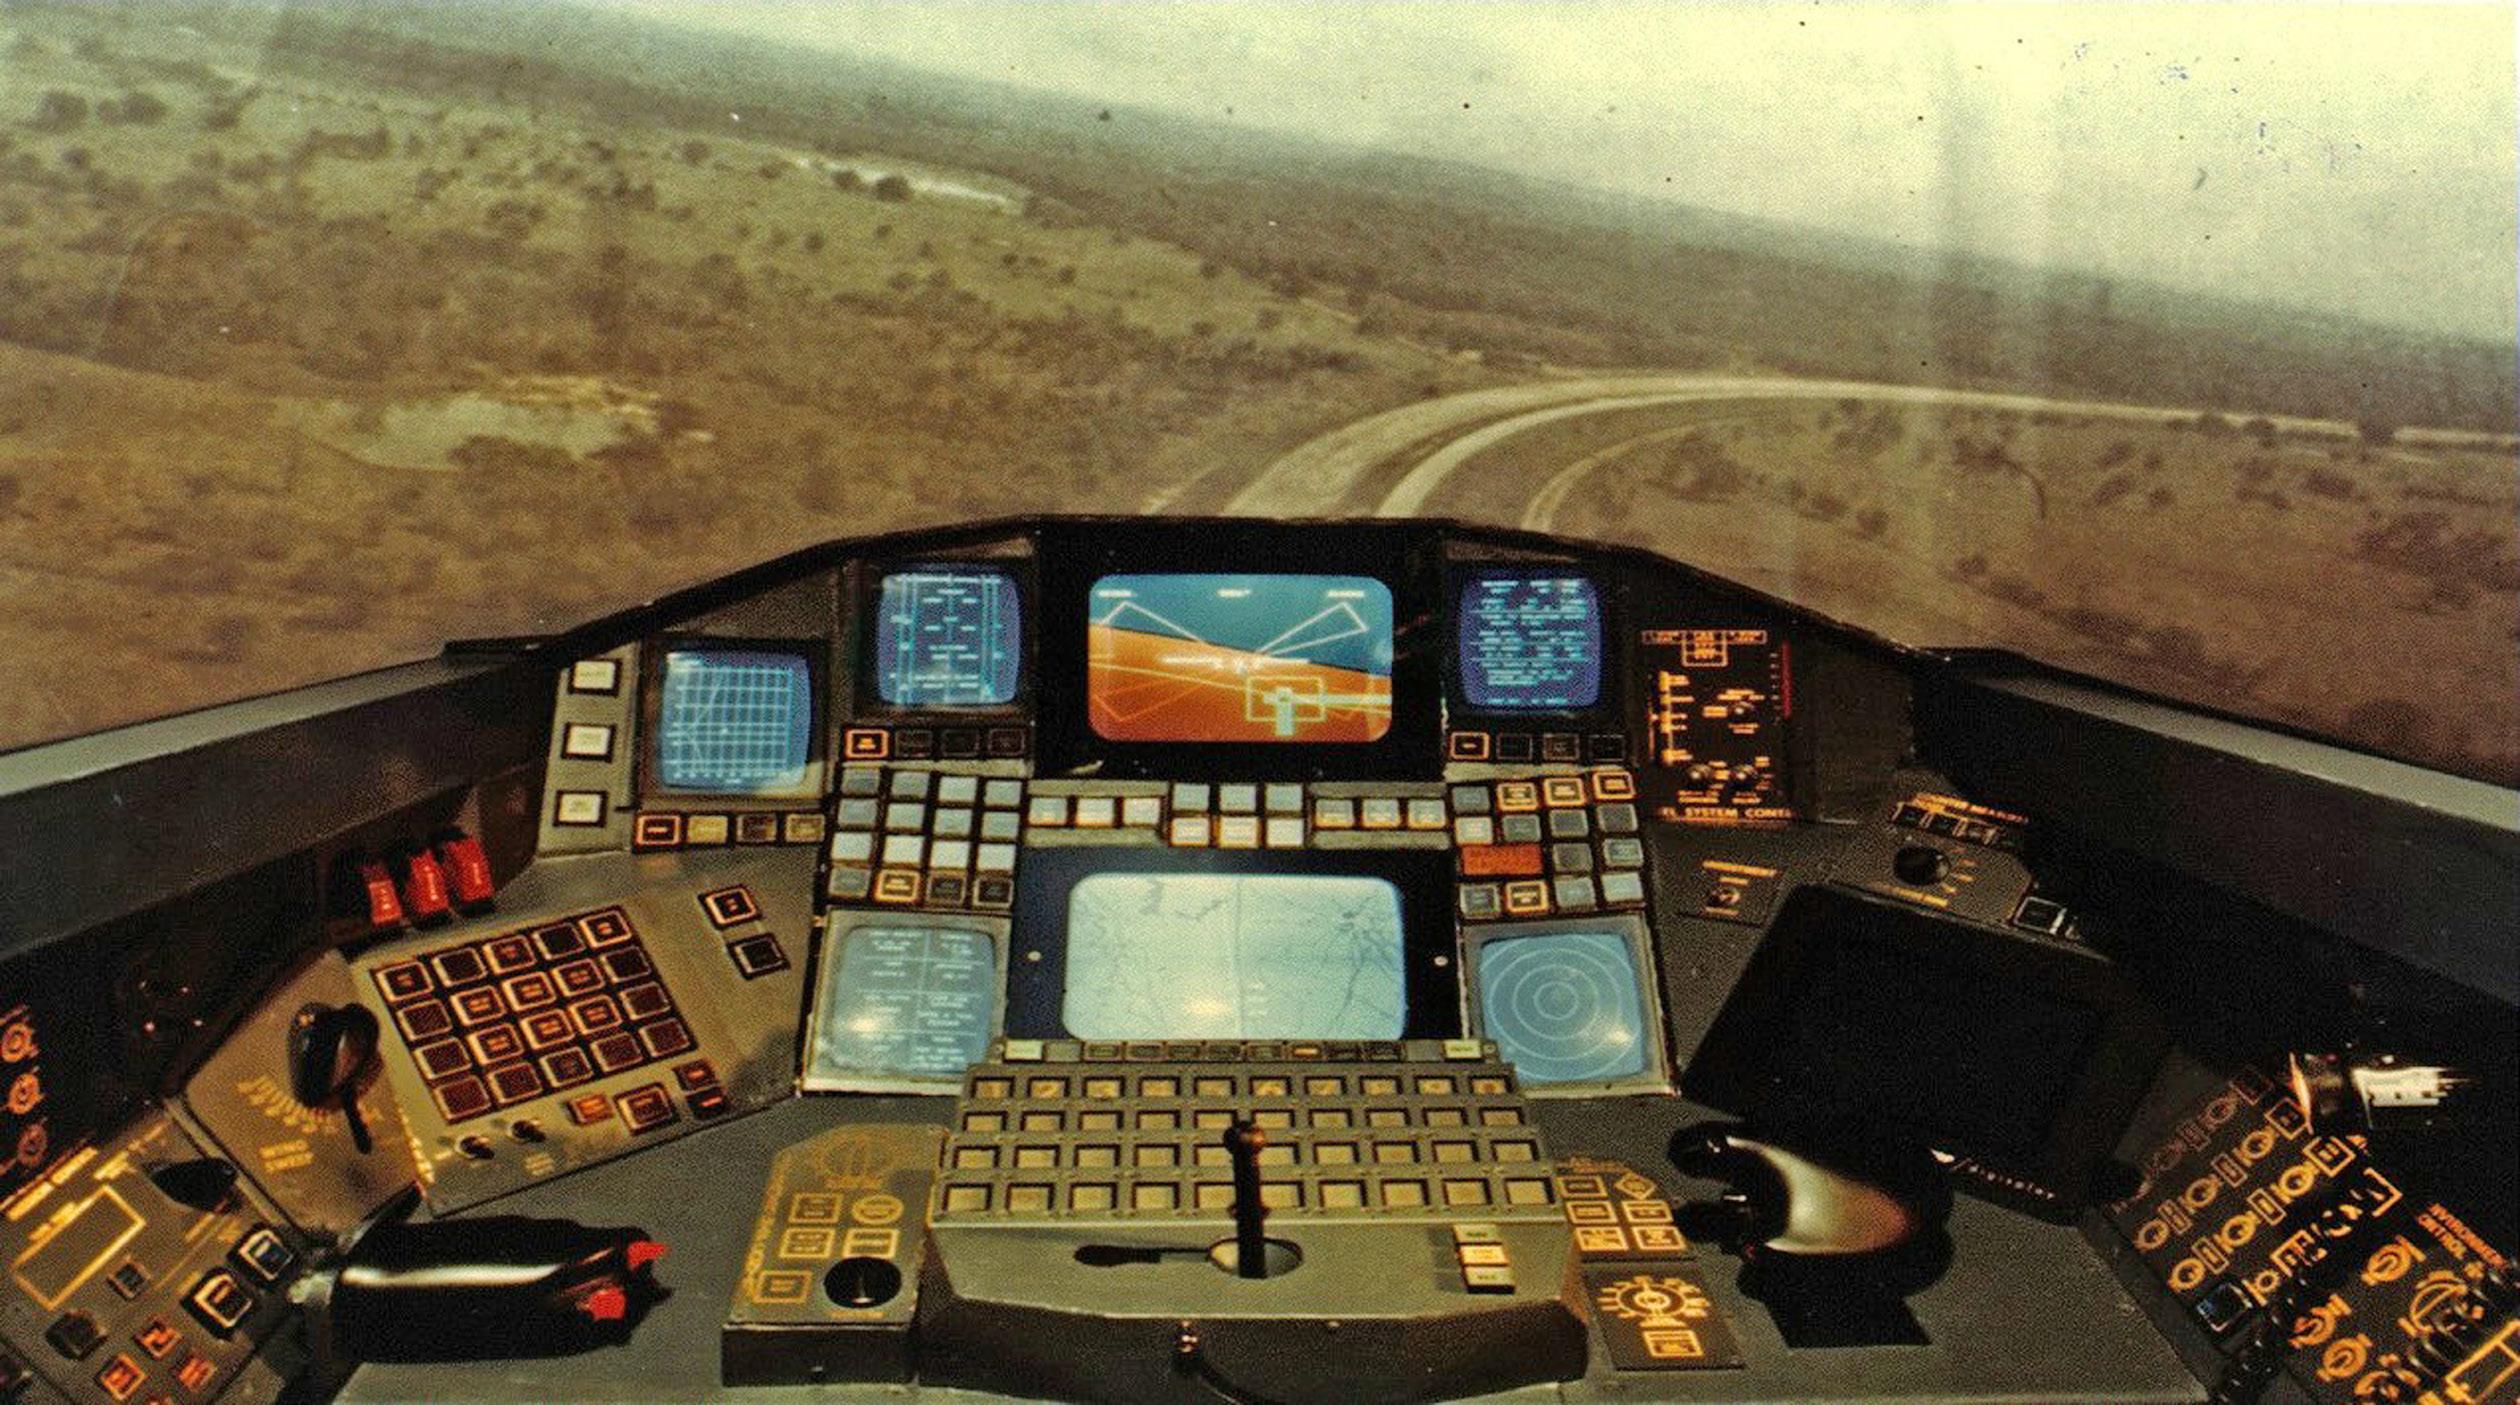
Research in the IIPACSS simulator ( Figure 1.1) arose from a need to verify that the new approach (utilizing E-O displays that combined many of the functions of separate E-M instruments) would not degrade operator performance.
FIGURE 1.1 Integrated Information Presentation and Control System Study (IIPACSS) simulator, circa 1970. (Boeing photo produced under US Air Force Contract # F33615-73-C-1201.)
Display Technology
This simulator contained one color and six monochrome CRTs that were multifunctional in the sense that numerous menus and pictorial formats could be presented on the same device at different phases of the mission. Although an out-thewindow scene was available during experiments, it was not the computer projection that we know today. It was a film taken from a camera in an aircraft that flew a particular route. The film was run backward to give the illusion that the aircraft was indeed flying the route that was preprogrammed. However, about three years later, a terrain board coupled with a camera that flew over the board provided the out-thewindow scene for the pilot.
Control Technology
Besides the required throttle and flight controls, the simulator contained a great number of switches. If you examine Figure 1.1 carefully, you will see that there are 141 push-button switches in this simulator. In the early 1970s, multifunction switch technology was not yet available.
Representative Research
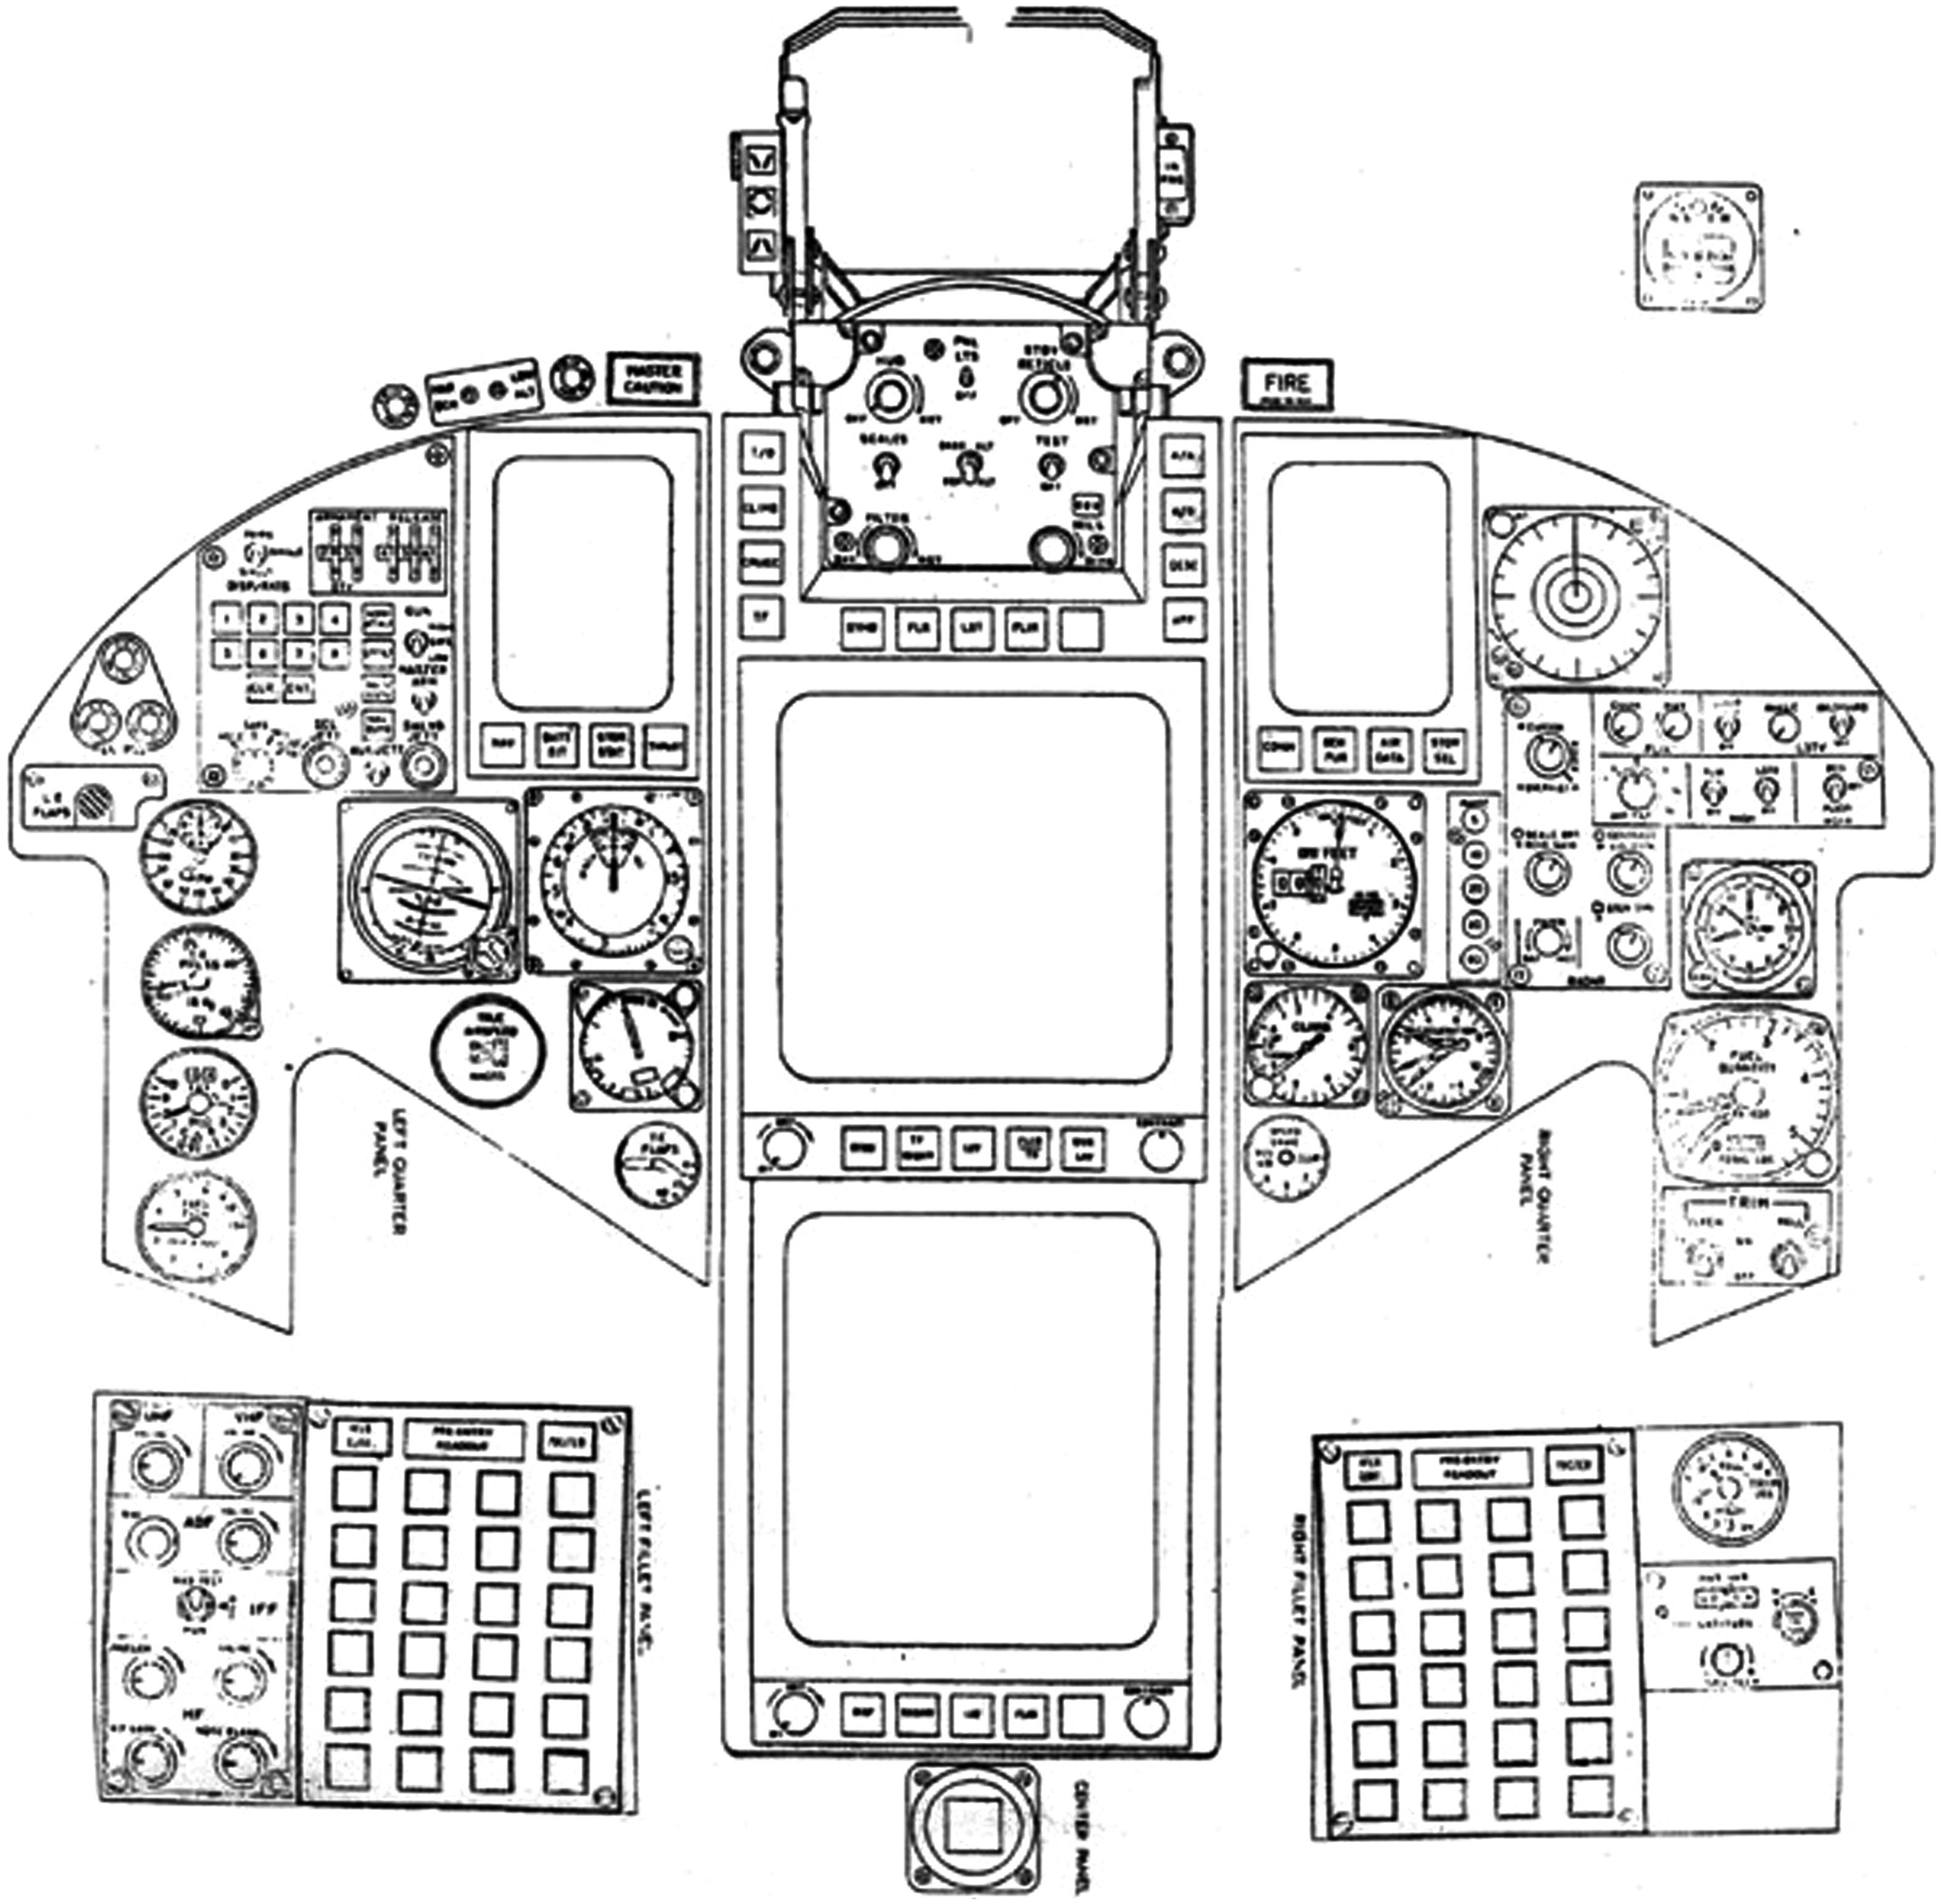
Introduction: Based on an initial evaluation of the cockpit seen in Figure 1.1, it was clear that work was needed on the design of multifunction keyboards, as well as other aspects of the cockpit, such as intuitive display formats. This study ( Willich & Edwards, 1975) addressed these issues. This study also incorporated the functions of the A-7D operational crew station because it had the more sophisticated avionics systems at that time. After a detailed functional analysis was performed on the A-7D, whose crew station contained primarily E-M instruments, those functions were then assigned to various multifunction displays and multifunction keyboards. The cockpit in Figure 1.1 was modified to incorporate the functions of the A-7D as well as lessons learned from the initial pilot evaluations conducted with this older, unmodified simulator. An outline of the front instrument panel of the modified cockpit appears in Figure 1.2.
The objective of this experiment was to evaluate a head-up display (HUD) format, different display formats for the horizontal situation display, and a newly designed multifunction keyboard. In this section, we will discuss only the results of the multifunction keyboard evaluation. (For other aspects of the study, see Willich and Edwards, 1975.) The detailed objectives relative to the keyboard were to “evaluate the utility of the multifunction keyboard in terms of matrix size, number of integrated functions, logic indenture levels, and operational suitability in accomplishing the mini mission scenarios” ( Willich & Edwards, 1975, p. 67). A mini mission is a flight phase, for example, air-to-ground. To understand the detailed objectives, some explanation of how the multifunction keyboard was constructed is required.
Multifunction Keyboard: At the time of this study, bezel-mounted switches with legends that appeared on the display surface (most Automatic Teller Machine [ATM] designs), had not yet been envisioned. However, the mechanism used by ATMs to obtain a cash advance in that one proceeds through multiple levels of menu logic,
FIGURE 1.2 Modified Integrated Information Presentation and Control System Study (IIPACSS) simulator. (Boeing photo produced under US Air Force Contract # F33615-73-C-1201.)
was employed in the following manner. To organize the over 100 switches in Figure 1.1, switches were created that had a limited number of legends – 12 legends per button in this case. A 4 × 6 matrix of these switches was created, thereby allowing a total of 288 switch legends. Two identical matrix-style keyboards were placed to the left and to the right of the horizontal situation display (bottom-large CRT) to allow operation by either hand ( Figure 1.2). The keyboard worked in the following manner: As power was applied to the multifunction keyboard, the button legends on the top row showed the names of the major systems onboard the aircraft, such as communication, navigation, sensors, etc. When one of the top row buttons was pushed, for example the communication (COMM) button, the various types of radios (ultrahigh frequency [UHF], very high frequency [VHF], identify friend or foe [IFF], etc.) would then appear as legends on the keyboard, and the previous legends would disappear. The pilot would then be at the second logic level. If the pilot then pushed the UHF button, the sub-functions of the UHF would be shown (third logic level), and, as before, the previous legends would disappear. Successive changes of legends on the buttons allowed the pilot to proceed through various keyboard logic levels.
However, the status of the radios (e.g., the current tuned frequency of the radio) did not appear on the keyboard; the radio status was shown on the small CRTs located at the top portion of the instrument panel.
Test Procedures: All eight pilot participants were experienced in fighter or attack aircraft. Each flew three mini missions: air-to-air, air-to-ground, and instrument landing. During these mini missions, the pilots used the multifunction keyboard in normal and degraded modes (e.g., a CRT failure) to perform tasks involving the communications, navigation, sensors, and aircraft subsystem functions.
Results: An examination of the three mini-missions found that there was no significant difference between normal and degraded mode performance in the air-toair and air-to-ground mini-missions. In the landing mini mission, it took significantly longer to enter a radio channel change in the degraded mode.
The pilots also filled out a questionnaire to obtain opinions on the utility of the multifunction keyboard and associated multifunction displays. Pilots felt the multifunction keyboard was very easy to operate, failures were easy to correct, and it was equally suitable for day and night use. However, they were evenly split as to the efficiency of the keyboard. Those who liked the keyboard were especially fond of the compact nature (combining several functions into a fewer number of switches). However, those pilots who did not like the keyboard felt they could access singlefunction switches more quickly than going through the four levels of menu logic required with the multifunction keyboard to access some functions.
Conclusions: There were two basic conclusions from the research performed in this experiment: (1) the functions of a state-of-the-art aircraft (at the time) could be successfully incorporated into a multifunction crew station and (2) the multifunction keyboard, coupled with its corresponding CRT status displays, was a viable means of performing tasks needed to accomplish the functions. However, the optimization of the relationships between the keyboard and the corresponding CRT status displays had not yet been achieved. The pilots manipulated the switch legends on the keyboard matrix (see Figure 1.2), but the changed functions appeared on the CRTs located at the top portion of the instrument panel. As the CRTs were a considerable distance from the multifunction keyboard, increased scanning time to verify the correct task had been performed was required.
Impact
This simulation was conducted as part of the US Air Force’s Digital Avionics Information System Program. The US Navy had a similar program called the Advanced Integrated Display System Program. The research conducted by these two programs served as the basis for the E-O crew stations we see today in modern aircraft.
dIgItal synthesIs (dIgIsyn) sImulator
Display Technology
This simulator contained a HUD (but no external visual scene) and from four to six multifunction head-down CRTs, depending on the evaluation. The two CRTs in the center front panel (vertical situation display and horizontal situation display) were
color, as well as the left upper CRT in some studies. The other head-down CRTs were monochrome. For some experiments, a cluster of E-M engine instruments on the upper right front panel was employed.
Besides these few E-M displays, the majority of displays were E-O, which offered a great deal of flexibility in crew station design. First, a particular format could be presented on any of the CRTs, and one evaluation focused on this advantage. Pilot performance was examined with eight arrangements of display formats depicting vertical situation, horizontal situation, and status information. The results failed to show a performance decrement across arrangements, demonstrating that this is a viable option, should one of the E-O displays fail during flight (Calhoun et al., 1980).
With the flexibility afforded by computer-driven displays, the available graphics capability could also be exploited, rather than just transferring dedicated E-M display formats onto E-O surfaces. Moreover, the formats could be designed to integrate information from several dedicated E-M displays onto a single E-O display. However, to ensure that the resultant format provided information in a manner that the pilot could quickly assimilate and respond to, extensive research was required to determine which type of format and level of abstraction (e.g., alphanumeric, graphic, schematic, or pictorial) was best for the pilot’s specific task. Research was also required to examine whether color should be employed in computer-generated imagery, beyond the conventional sky and ground coding of the attitude director indicator (ADI) sphere and colors (green/amber/red) used in the aircraft advisory system. For several years, DIGISYN supported such display format evaluations. The section “Representative Research” provides a summary of a few studies examining the use of color coding.
Control Technology
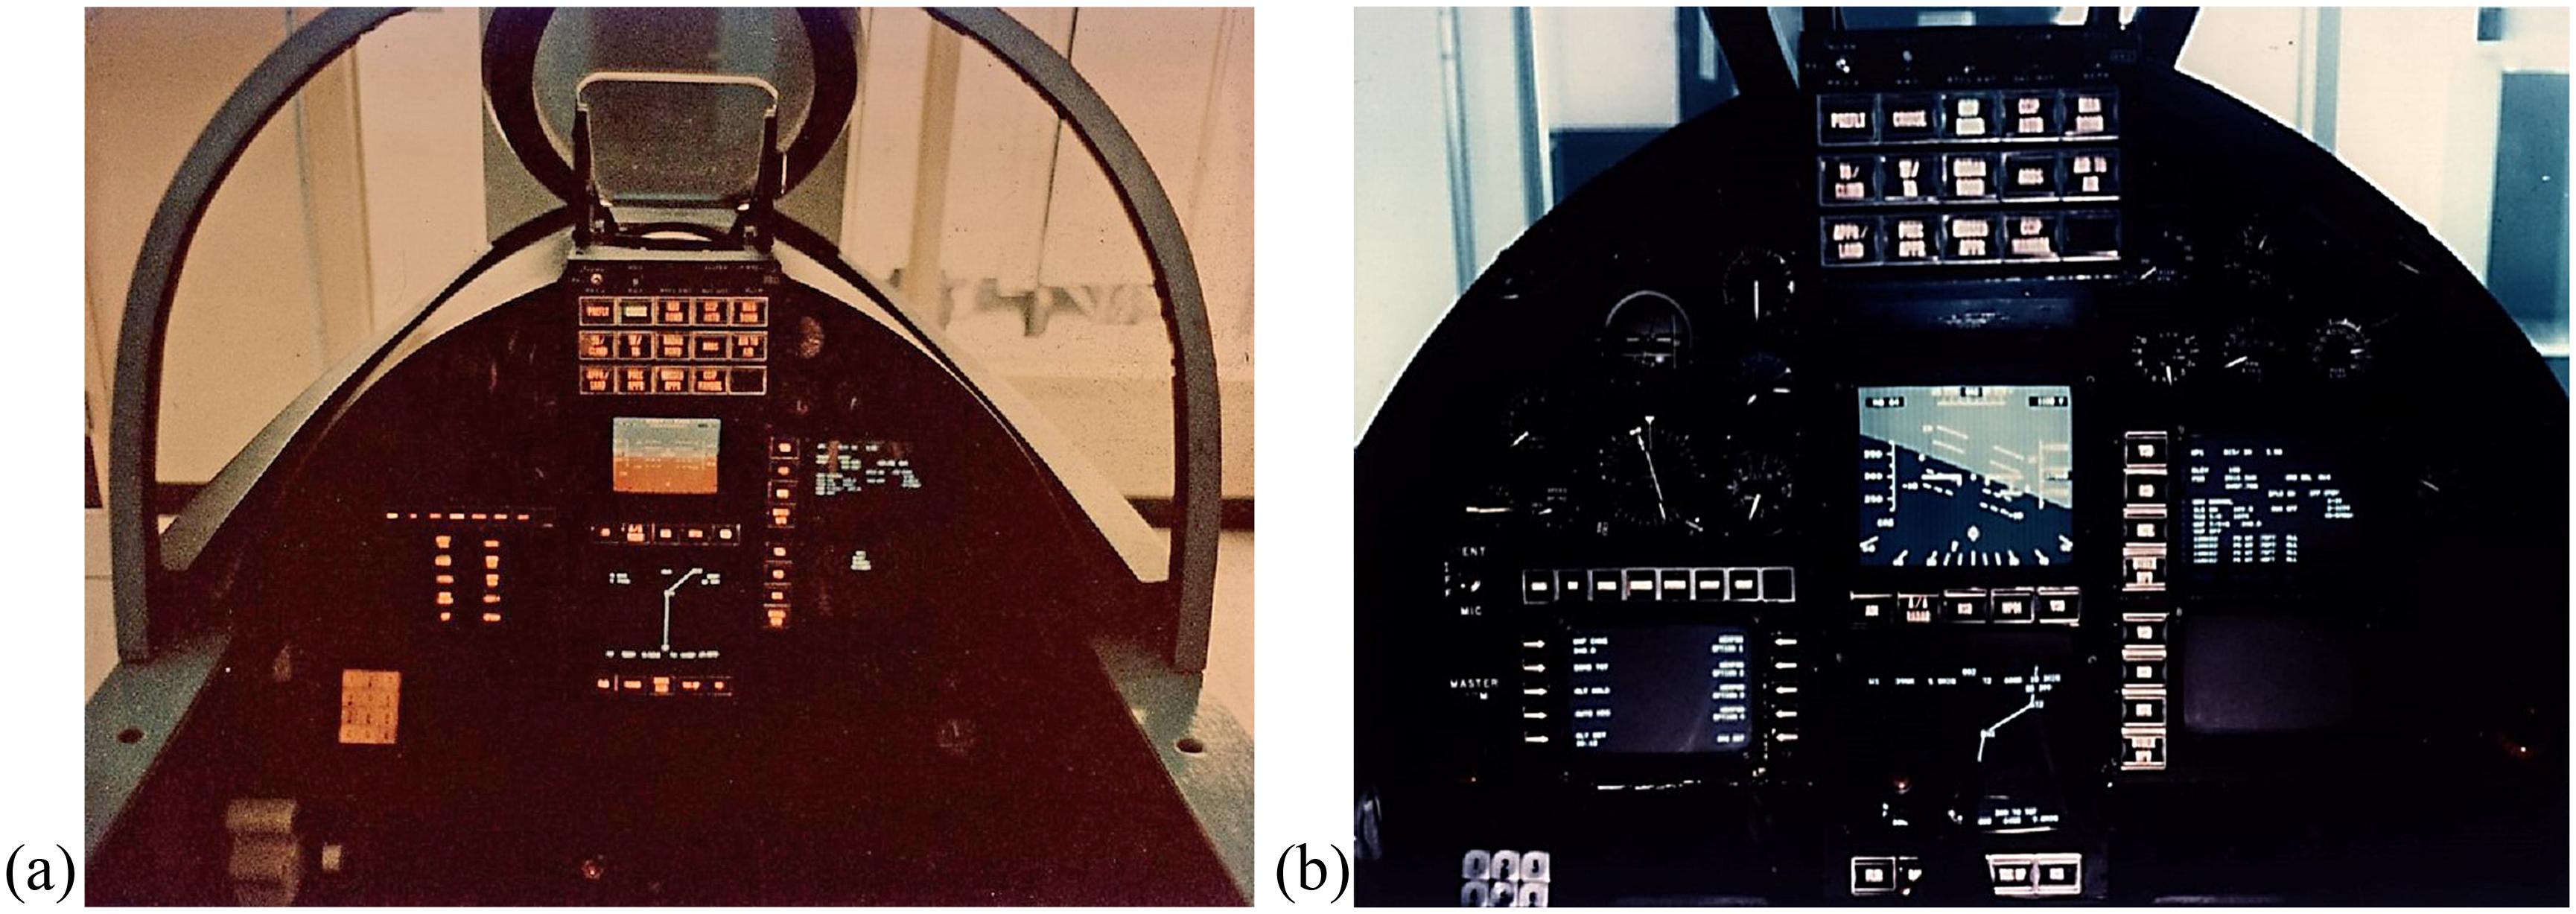
Besides a joystick and throttle for flight control, the simulator utilized a combination of single-function controls (e.g., a telephone-style keyboard, forward of throttle on left console) as well as the multifunction control (lower-left front panel). Each switch of a multifunction control addressed logic that both determined the function of the switches and initiated the execution of those functions when the switches were selected. Obviously, if the function of a switch changed, it was important that its current function be displayed. To reflect what operation they controlled, multifunction switch legends changed, using one of two technologies available at that time: projection switches ( Figure 1.3a) and CRT-based bezel-mounted switches ( Figure 1.3b).
Projection switches contained a filmstrip with a series of light bulbs behind the strip. Based on the legend desired, the computer sent a signal to the appropriate light bulb, thereby lighting up the correct legend. A limitation of this technology was that only ten legends would fit on the filmstrip that was below the switch surface. Further, if a different legend was desired other than the current ten, a new filmstrip had to be created.
In CRT-based multifunction controls, the switches are adjacent to the bezel of a CRT. Thus, the switches could have as many legends as the CRT could generate and changing a legend only involved a software modification. However, this technology
FIGURE 1.3 (a) Digital synthesis (DIGISYN) simulator with projection switches, circa 1976. (US Air Force photo.) (b) Digital synthesis (DIGISYN) simulator with CRT-based bezel-mounted switches, circa 1976. (U.S. Air Force photo.)
also had limitations. Because of the switch depth, switches could not be mounted on the bezel itself, but rather had to be mounted outboard. The distance between the switch and its corresponding legend could result in parallax problems at certain viewing angles or seat adjustments, making the association of a switch to a displayed legend ambiguous and not immediately apparent.
Several investigations examining how best to implement a multifunction control were conducted with this simulator. More specifically, this research:
• Compared projection switch-type multifunction control to CRT bezelmounted switches, and evaluated their location in the cockpit ( Reising, 1977);
• Compared two logic design implementations, that is, branching logic for each individual aircraft system versus tailored logic that presents options that are most likely needed options for the current flight phase ( Herron, 1978); and
• Generated design criteria for multifunction controls (e.g., how to label switches, implement switching logic, maximize the accessibility of frequently used functions, optimize switch and function assignment, and minimize hand motion; Calhoun, 1978; Calhoun & Herron, 1982).
Representative Research
Introduction: Prior to the availability of the DIGISYN simulator, the majority of research examining the utility of color coding used participants who devoted their full attention to the color display and performed single relatively simple tasks (Christ, 1976). This research also showed that the impact of color coding is highly situation specific and depends on a number of diverse factors such as operator task, display medium, and display environment (Krebs et al., 1978). DIGISYN, with color E-O displays, was an ideal platform to examine the utility of color coding on formats that were used in a somewhat peripheral manner as the highly loaded pilot also performed multiple complex tasks.
Test Procedures: Similar procedures were used in three separate experiments to examine the utility of color coding. At least 16 A-7D pilots participated in each experiment. After training, pilots flew one or more flights with each of the conditions being examined in the respective experiment. The mission tasking was designed to represent the workload present in operational flights. Pilots were required to maintain flight parameters (using the HUD as the primary flight display) as well as complete communications, navigation, and weapons tasks using a multifunction control and keypad. Also, pilots had to respond to information retrieval questions that required them to utilize the display format under evaluation. With the number of ongoing and intermittent tasks, pilots only had time to quickly glance at the format under evaluation to retrieve requested information. Performance on all tasks was recorded. Subjective comments were also obtained with questionnaires.
Color Formats: Three different display formats were evaluated in separate experiments examining the utility of color coding: threat format (Kopala, 1979), engine format (Calhoun & Herron, 1981), and weapons format (Aretz & Calhoun, 1982).
Threat Format: This format appeared on the color CRT directly below the HUD. Besides navigation information, symbology was presented to denote locations of aircraft (symbol “.”), surface-to-air missiles (“S”) and anti-aircraft artillery (“A”). Each symbol was augmented with a state designator, one of three shapes to denote friendly, unknown, or hostile. These states were color coded in one condition: green, yellow, and red respectively. The two coding conditions (shape-coded symbology versus shape- and color-coded symbology) were tested under three different symbol density levels: 10, 20, and 30 symbols.
Engine Format: On the upper-left CRT, each of eight engine parameters was represented by a box that contained the current parameter value. Vertical rectangular bars extended from the top or bottom of the boxes, as the corresponding parameter deviated from the normal operating range midpoint. All parameters were normalized to the same range for easier interpretation. Normal, cautionary, and emergency states were indicated by shade and flash codes on the monochrome format (unfilled bar/ white bar/flashing white bar) and by color codes on the color format (green/yellow/ red). Performance on retrieval of engine information was recorded for the two CRT engine formats (monochrome and color), as well as a cluster of conventional E-M instruments (fuel flow, turbine outlet temperature, RPM, oil pressure, oil quantity, and three hydraulic pressure indicators) on the right front instrument panel. These E-M instruments operated as in conventional cockpits, with colored tape to denote operating ranges. For all three-format conditions, the simulation included implementation of the master caution indicator and corresponding messages on failed parameters.
Weapons Format: In three of four experimental conditions evaluated, the upperleft CRT presented information pertaining to all the weapons onboard the aircraft, as well as information pertaining to the weapon option selected. The format consisted of a white planform against a darker background. Shapes on the planform presented the weapons onboard, and a different shape was used for each type of weapons, one shape for each of six different types. The station from which the selected weapons would be delivered was indicated by the location of the symbols on the planform.
Line/flash (monochrome) or shade (color) coding were used to code the status of each selected weapon. This included weapons selection status, master arm switch activation, drop mode, interval, weapon fuzing, release status, and presence of a hung bomb. Besides the monochrome-coded and the color-coded pictorial formats, an alphanumeric format was also evaluated that presented information on the CRT used in the multifunction control. In a fourth condition, both the alphanumeric and color pictorial formats were presented.
Results: In the experiment that utilized a threat format, the results showed a 40% increase in time to identify friendly, unknown, and hostile symbols when monochrome shape coding was used, compared to redundant color-coding. The effectiveness of redundant color coding became more pronounced as the symbol density of the threat format increased. Performance with the monochrome-coded pictorial weapons format was also found to be significantly worse than the color pictorial format. Moreover, the monochrome format was also worse than the alphanumeric format and the combined alphanumeric and color pictorial format. The subjective data showed pilot preference for the combined format. One pilot commented that the pictorial format helped one acquire situation awareness with a quick glance, with the alphanumeric information as a backup if there was any confusion. Different results were obtained with the engine format. There were no significant performance differences between the monochrome and color CRT formats. With regard to having the engine information integrated onto a single format versus the conventional array of E-M instruments, both CRT formats were superior as measured by pilots’ speed and accuracy in identifying failed engine parameters.
Conclusions: The results from these experiments concur with the literature review provided by Reising and Calhoun (1982). Color coding resulted in performance improvements when the format was unformatted, highly dense, involved a search for relevant information, and had a logical relationship between color and the tasks. Both the threat and weapons formats can be viewed as dense and unformatted (e.g., 30 threat symbols at some levels and weapons information changed depending on weapon option). Both formats also involved an active search for information, either to find a particular threat or determine a parameter of a weapon store. The color coding also had a relationship to the task (e.g., red for hostile threat and hung bomb). The engine format, in contrast, was a simple display with the information clearly shown in histograms. The location of a specific parameter was constant: the corresponding box at the center of the display. Additionally, the master caution alerting system served as an additional cue of abnormal states. Thus, monochrome codes were sufficient for the E-O format presenting engine information; color coding did not show a payoff.
Impact
The DIGISYN can be viewed as one of the earliest test-beds primarily based on multifunction technology; the cockpit featured multifunction control and the majority of displays were E-O. Thus, this simulator was ideal for research focused on exploiting the advantages of computer-based controls and displays. As a result of the numerous experiments that were conducted over many years, the utility of multifunction
controls and integrated formats on multifunction displays was demonstrated. Many design guidelines were identified in the process as well. Without question, the research conducted with the DIGISYN was a strong contributor to the glass-cockpit crew station designs operational today.
mICroProCessor aPPlICatIons for graPhICs and InteraCtIve CommunICatIon (magIC) sImulator
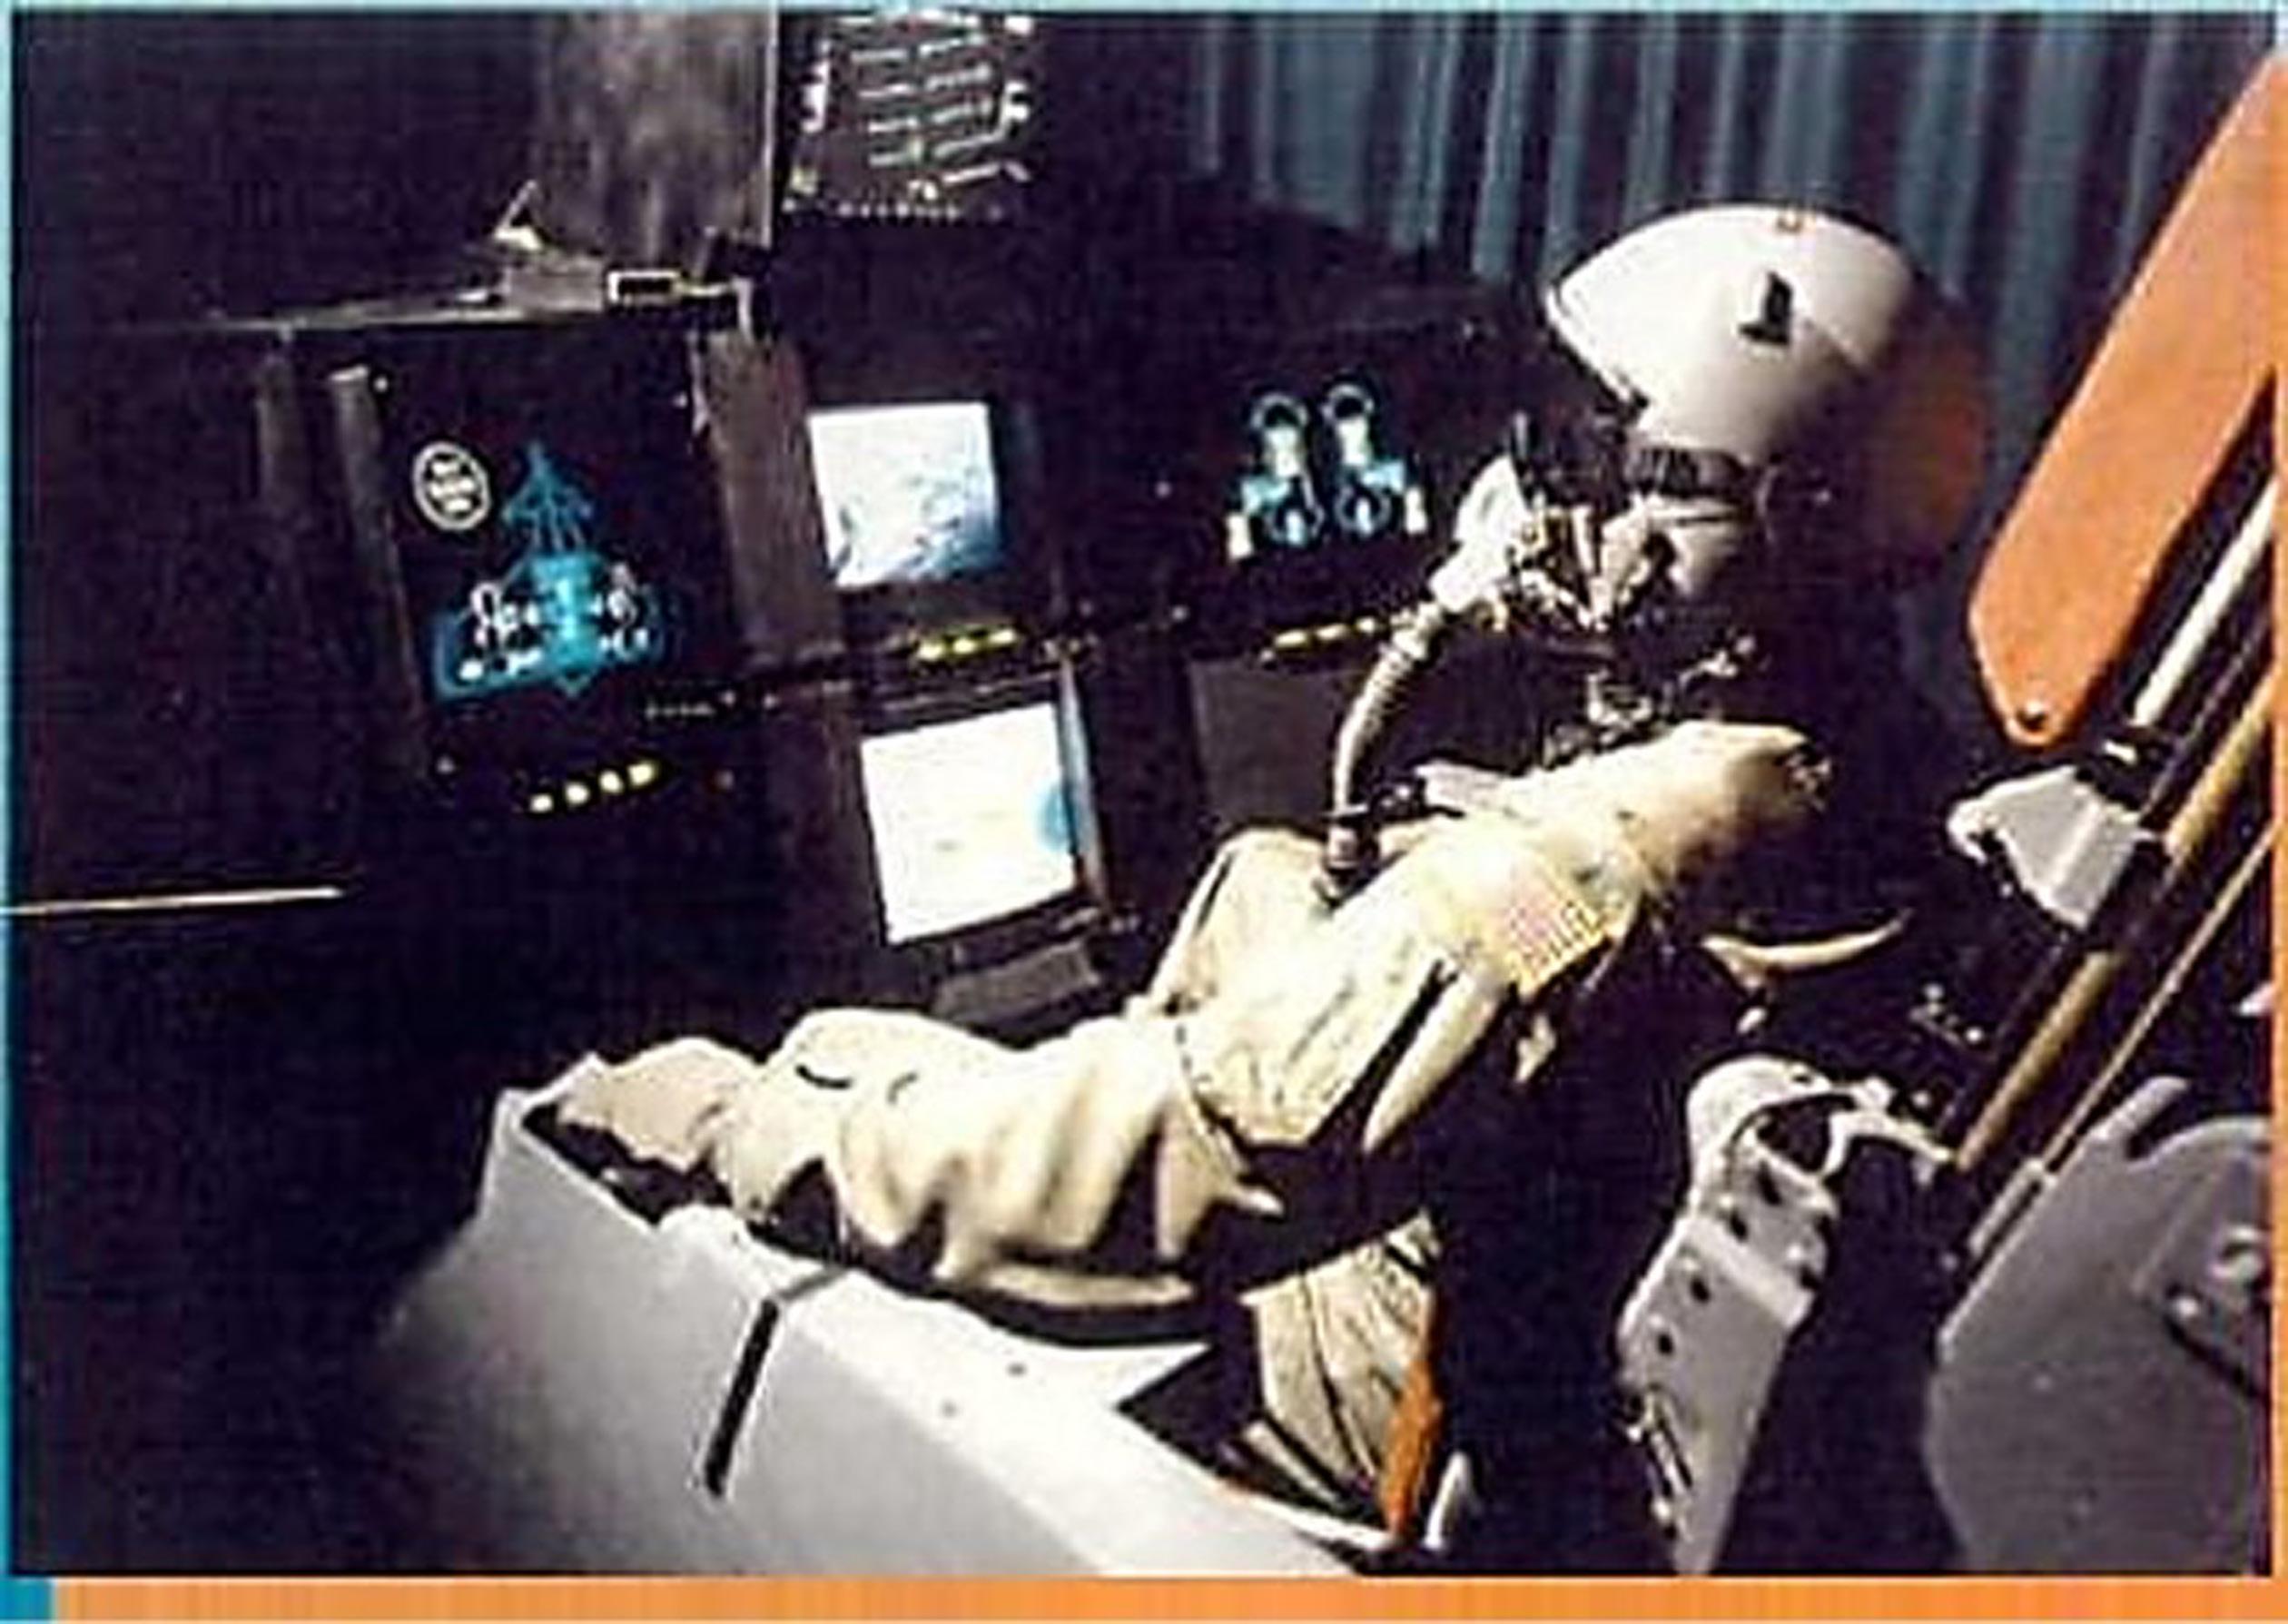
The MAGIC simulator was employed to conduct part-task pilot-in-the-loop research studies investigating pilot–vehicle interfaces for cockpit applications ( Figure 1.4). The simulator was a single-seat fighter shell. Six computers were used to support the simulation: three personal computers (PCs) and three graphics workstations. The fact that MAGIC relied on PCs for its operation demonstrates the low-cost aspect of this type of simulator. The cockpit was outfitted with various off-the-shelf products over the years for the purpose of comparing different controls and displays. Studies included the use of various HUD symbology sets to recover from unusual attitudes ( Reising et al., 1988), and pathway-in-the-sky HUD symbology for complex, curved approaches and landings (Reising et al., 1995). Additional studies (see the section “Representative Research”) compared the use of three-dimensional (3-D) joysticks, touch screens, and speech recognition to designate targets.
Display Technology
MAGIC contained five color CRTs that provided dynamic graphics capability. Typical displays for the head-down CRTs were system status formats, computerized checklists, radar sensor displays, and digital images from laser disks. There was no
FIGURE 1.4 Microprocessor Applications for Graphics and Interactive Communication (MAGIC) simulator, circa 1985. (US Air Force photo.)
out-the-window visual scene, so subjects used the topmost monitor to view HUD symbology. The center CRT, typically containing a moving map display, could be exchanged with a 3-D display that pilots could use to view images with liquid crystal display (LCD) shutter glasses.
Control Technology
An F-16 side-mounted limited-displacement control stick was used to fly the F-16 aeromodel for the flight tasks. The stick also contained a weapon’s release button, a trigger, and a pitch-trim switch. An A-7 aircraft throttle was also employed and included speed brakes and communications switches.
The cockpit also contained three banks of four programmable display push buttons each. These were pixel-addressable light-emitting diode displays capable of displaying alphanumeric or pictorial information. There was also a bank of four multicolor switches below the topmost monitor. Three of the CRTs housed touch screen overlays that were used as control interfaces to change the graphics on the screen. MAGIC also contained various speech recognition systems, again used as a control interface to change displays for the pilot. Other control devices included a magnetic tracker and an ultrasonic tracker attached to the pilot’s glove to manipulate cursor control in 3-D space.
Voice Systems: Over the years, MAGIC hosted different speech recognition systems, each with its own strengths and weaknesses. It was this observation of several systems that led to a unique study geared at increasing the recognition accuracy of state-of-the-art speech system of that time ( Barry et al., 1992). The idea was to combine the strengths of each of three individual systems (two working in isolated mode and one in connected-speech mode) to increase recognition accuracy in the following manner. When a person spoke a word, all three systems reported a best-guess word, a second-choice word, and a distance score for each of the two words reported. A “majority rules” algorithm was implemented that determined the word recognized as a best guess by the majority of the three systems. If there was no majority, the second-choice words were added to the set of words, and a majority was looked for again. Finally, if there was still no majority, the response with the lowest distance score was reported. Using this algorithm, word recognition accuracy increased from 92.99% (the average of the three systems’ individual accuracies) to 99.43% (the accuracy using the “majority rules” algorithm).
Representative Research
Introduction: One series of experiments conducted in MAGIC evaluated methods for designating targets residing in a stereoscopic 3-D volume. This research was published in several articles ( Barthelemy et al., 1991; Liggett et al., 1993; Reising et al., 1992; and Solz et al., 1994). Three different cursor-control devices were used to designate targets. These included a three-axis joystick, an ultrasonic tracking device, and a voice control system. The ultrasonic tracking device was attached to a glove, and participants moved the cursor using this device by pointing to the target
of interest. Because this type of task requires both gross and precise positioning, two aiding techniques were implemented. One was simple in that a color change of the target was instituted when the cursor penetrated the target area, informing the participants that the cursor was indeed in the same physical space as the target. The other aiding algorithm, referred to as enhanced aiding, used a mathematical algorithm to compute the distance from the cursor to the target closest to it as it traversed the 3-D space. Once this distance was computed, the closest target was highlighted, thus eliminating the need for precise positioning (Osga, 1991). The algorithm continuously computed the distance between the cursor and all targets in the depth volume. The 3-D volume within which targets and the cursor interacted extended from 7 in. in front of the physical display surface to 15 in. behind the physical display surface. Participant performance differences based on two target densities were also investigated.
Results: Results showed that the hand tracker provided the best performance with respect to total target designation time. Both target designation time and accuracy were improved with the enhanced aiding approach. A speed–accuracy trade-off was observed when the density variable was analyzed; the low-density condition provided faster total target designation times, but the high-density condition had fewer errors.
Impact
This cockpit simulation provided a consistent, uniform experimental environment for conducting a number of part-task evaluations. Consistency is especially important in stereographic evaluations as the distance between a participant’s eyes and the display affects image disparity and, therefore, perceived stereographic effect. Also, the versatility of the cockpit supported the easy integration of the various control devices.
The evaluations supported by this simulation also enabled the investigation of alternatives to traditional control and display devices for cockpit tasks that were becoming more challenging as information being presented on the traditional twodimensional (2-D) displays increased. As such, pilots’ visual processing capabilities were being overloaded, and 3-D displays offered a potential solution to this problem. However, introducing this type of display also introduces control challenges. This simulator facilitated the evaluation of numerous control techniques that may compensate for new control issues associated with the incorporation of 3-D displays in future cockpits.
PanoramIC CoCkPIt Control and dIsPlay system (PCCads) sImulator
During the second half of the 1980s, the continued maturation of larger flat-panel displays (e.g., LCDs) started researchers thinking about the design of a cockpit in that the whole front panel would be a single display. As with any new technology many questions arose, such as: “What is it the best way to optimize the design of the crew station when operators can place display formats wherever they wish?” In addition, new display formats could extend across either the entire or a part of the display
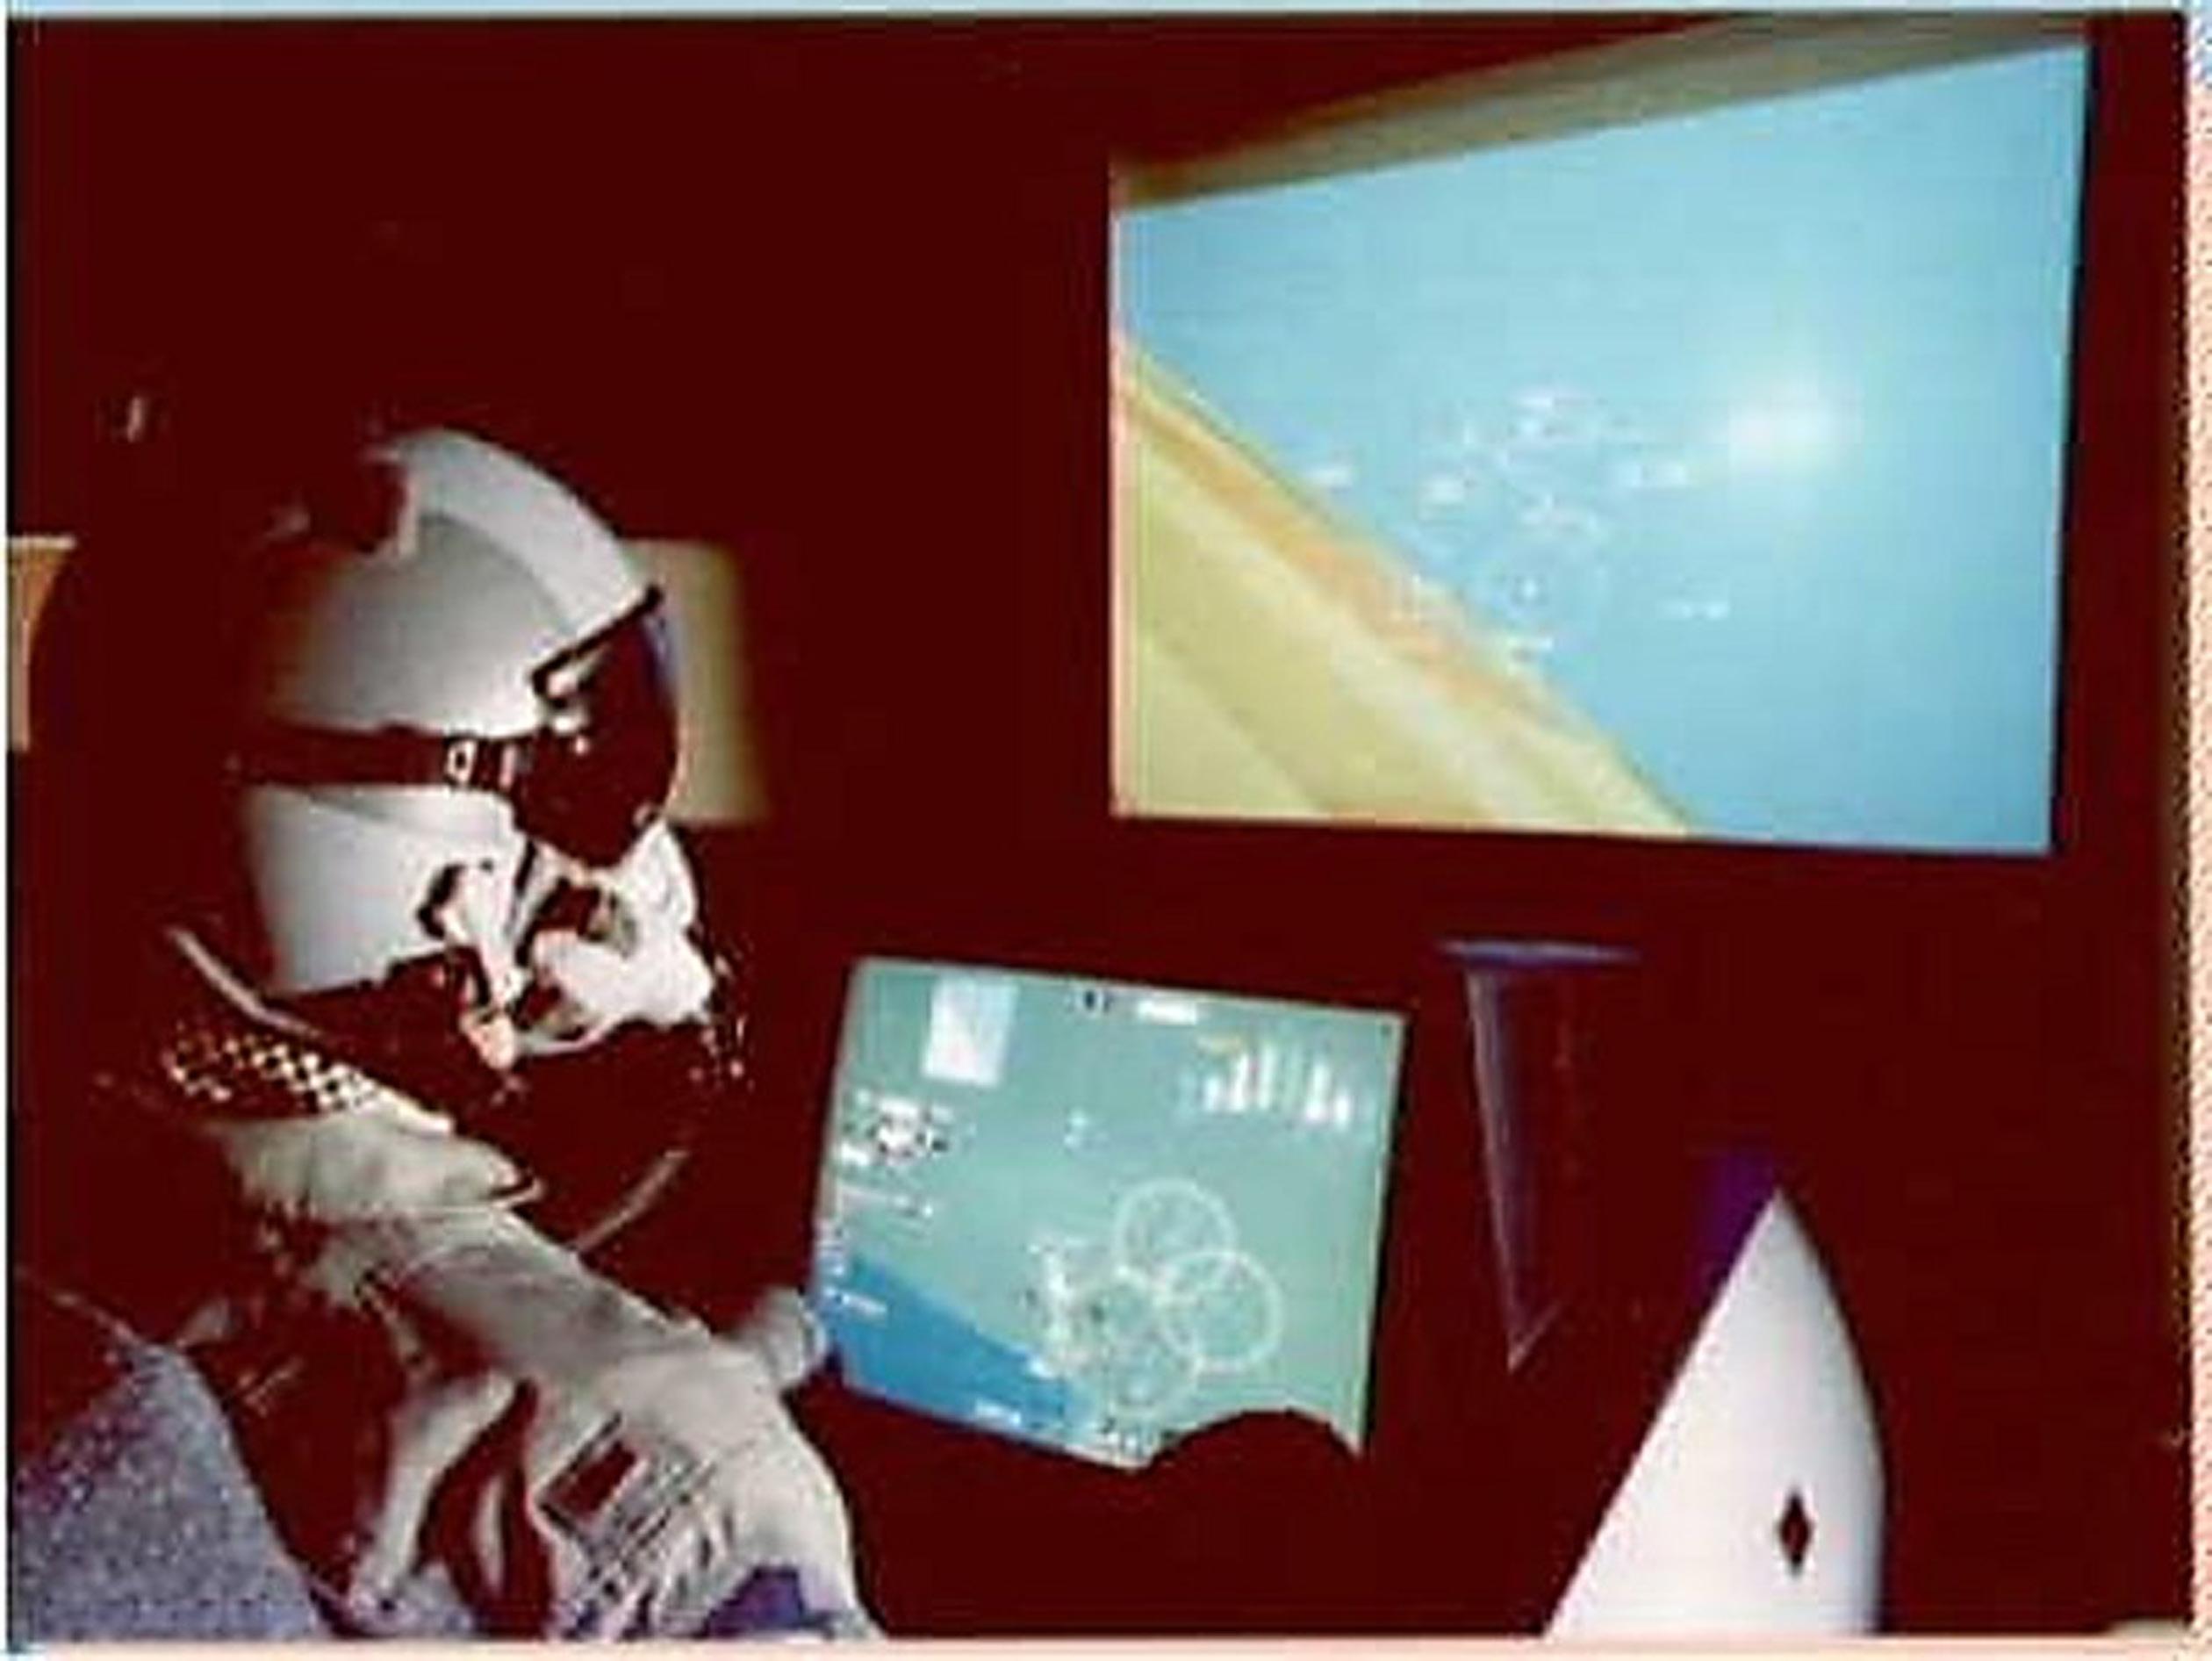
such as a half, a third, etc. Also, improvements in helmet-mounted displays (HMDs) warranted investigation of how they would interact with the new displays available with the single instrument panel. The PCCADS research simulator was developed to evaluate the potential improvements in mission effectiveness by providing a large color display area and the effectiveness of including an HMD and a helmet-mounted sight (HMS) in the cockpit ( Figure 1.5).
Display Technology
The HMD provided airspeed, altitude, attitude, heading, and weapon status cues. It also portrayed a line of sight (LOS) for radar, and one for a weapon seeker. This was accomplished with the use of a magnetic head-tracker. The tracker-head position data and status information were used to point the simulated radar antenna or the simulated weapon seeker.
The head-down portion of the simulator was unique in that it was one large display (18 × 24 in.) containing an integrated picture of mission-essential information. This also allowed for the rapid reconfiguration of numerous head-down configurations. For example, via software, the head-down display could be configured to look like an F-15E or an F-16 cockpit instrument panel.
PCCADS employed a projection system to show a realistic out-the-window scene (37 degrees horizontal by 27 degrees vertical field-of-view [FOV]), driven by a stateof-the-art graphics generator.
Control Technology
The simulator employed a touch-sensitive overlay in order to manipulate switches displayed, as well as present formats showing aircraft attitude and flight status in
FIGURE 1.5 Panoramic Cockpit Control and Display System (PCCADS) simulator, circa 1988. (US Air Force photo.)
various locations on the head-down display. Speech recognition and control were other options for interaction. An F-15E stick and throttle, along with their additional switches and buttons, provided “HOTAS” functionality, that is, function selection while keeping the pilots’ “hands on throttle and stick.”
Representative Research
Introduction: The research discussed in this section dealt with one of the basic aspects of flying – maintaining flight safety when there is no dedicated head-down primary attitude indicator (AI). At the time this research was conducted, there was a definite desire to provide the pilot with as much mission-related information as possible. There was a second idea that the HUD could be used as the primary flight reference display and be substituted for a head-down primary AI. However, there was a concern that loss of attitude awareness (a potential flight safety problem) could result.
The Evolution of the Background Attitude Indicator: With limited panel space, one design solution was to decrease the size of the ADI and move it out of the primary viewing area, with pilots employing the HUD as the primary flight display. Researchers at Lockheed, Ft. Worth (Spengler, 1988) designed an alternate approach. They created a background attitude indicator (BAI) format designed with the goal of replacing the conventional dedicated head-down ADI while maintaining flight safety. The BAI uses a ¾ in. electronic border around the outer edge of a headdown display format. The evolution of this concept is illustrated in Figure 1.6 and its implementation is shown in Figure 1.7.
FIGURE 1.6 Evolution from attitude director indicator (ADI) to background attitude indicator (BAI).