
International Research Journal of Engineering and Technology (IRJET) e-ISSN: 2395-0056
Volume: 13 Issue: 02 | Feb 2026 www.irjet.net p-ISSN: 2395-0072
International Research Journal of Engineering and Technology (IRJET) e-ISSN: 2395-0056
Volume: 13 Issue: 02 | Feb 2026 www.irjet.net p-ISSN: 2395-0072
SURESH B1 , GURU VISHANTH K 2, BASKAR H3 , CENIC ALPHINE N4 & ROSHAN
1PG Assistant In Chemistry, Dept. of Chemistry, The Vikasa School, Millerpuram ( Affiliated to CISCE – TN044), Thoothukudi – 628 008, Tamilnadu, India
2,3,4,5 XI Diamond Student’s [2025 – 2026], The Vikasa School, Millerpuram ( Affiliated to CISCE – TN044), Thoothukudi – 628 008, Tamilnadu, India ***
Abstract - Slow evaporation was used to generate the Thiourea strontium nitrate single crystals from saturated solution. Pure thiourea strontium nitrate single crystals' structure and crystallinity were verified by powder XRD, and FTIR spectroscopy revealed the frequency assignments of the several internal vibrational modes for the functional groups. UV-Vis spectroscopy was used for optical and transparency investigations. The material's value for optoelectronic applications is attested by its reduced cutoff wavelength of 241.67 nm and its high transmittance throughout the visible spectrum. Dielectric, and research was done to analyze its electrical characteristics. The reduced dielectric loss values imply that there are fewer flaws in the produced crystals.
Key Words: NLO semi organic crystals, PXRD, FTIR, UVVIS Studies, Electrical Studies.
Thedevelopingfieldofphotonicsheavilyrelieson nonlinear optics. The use of photons for information and imageprocessingisknownasphotonics. [1]Applicationsfor nonlinear optical processes can be found in essential operationslikeopticalswitchingandfrequencyconversion. Compared to inorganic crystals, organic crystals can have verylargenonlinearsusceptibilities;nonetheless,theyhave poorprocessibilityandalowdamagethreshold.Conversely, sincetheylackbroadelectrondelocalization,pureinorganic NLO materials frequently have relatively minor optical nonlinearities despite having outstanding mechanical and thermalproperties.Duetoimpuritiesandflawsbroughton by the incredibly non-equilibrium development circumstances, inorganic crystals produced from high temperaturemeltsmaygenerallyhavelowerlaserdamage thresholds and greater optical homogeneities across the bulk. A semi-organic crystal is one that combines the advantageousmechanicalandthermalcharacteristicsofan inorganic counter ion with the generally high optical nonlinearityofacompletelyorganicion. [2,3,4]
Comparedtoorganicandinorganicmaterials,semiorganic materials have a significant nonlinearity, a strong resistance to laser-induced damage, a low angular sensitivity, and good mechanical hardness. Growing new semi-organic nonlinear optical materials has therefore
receivedalotofattentionduetoitspotentialusesinsecond harmonic production,optical informationstoragedevices, andtelecommunications.Thethioureamolecule'senormous dipole moment and capacity to build a vast network of hydrogen bonds make it an intriguing inorganic matrix modification.[5]
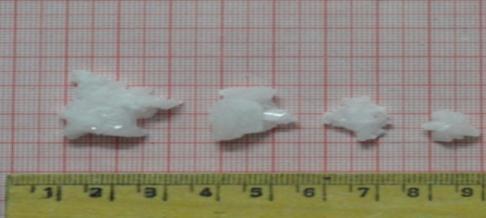
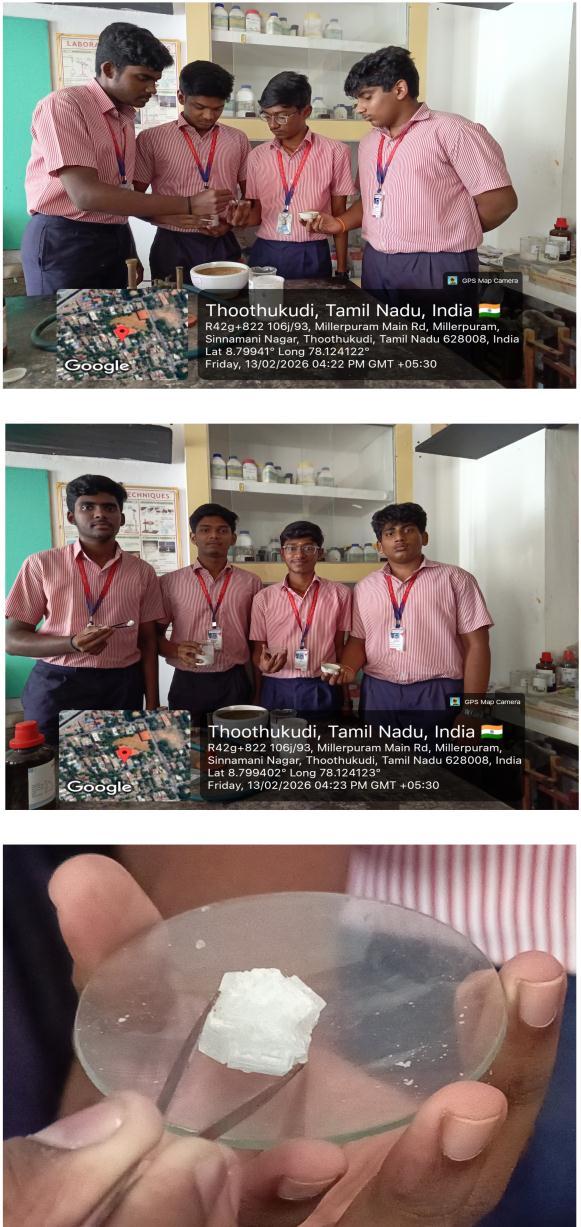
Slowevaporationwasusedtogeneratethethiourea strontium nitrate single crystals from saturated solution. 18.75 grams of thiourea were finely powdered and combinedwith100millilitersofdistilledwaterinabeaker tocreatethesaturatedsolution[6,7] Thepollutedandscraped material of Strontium nitrate was added to this in little amounts until it was fully dissolved. Photographs of pure TUSNsinglecrystals areshowninFig.-1.
Using a magnetic stirrer, the solution was thoroughlymixedtoincreaseitssolubility,andtheoperation was repeated until the last bit of the material had been dissolved.Filterpaperwasthenusedtofilterthemixture. Polythene paper was used to cover the beaker's top and createafewtinyholes.Thisbeakerwasnotdisturbedand was maintained at room temperature. Ten to fifteen days wereneededtogathertheindividualcrystals.
Powder X-ray diffraction experiments were performedonpurethioureacrystals.UsinganXRD-ULTIMA 111 diffractometer, the generated crystals' X-ray powder diffractionpatternwasacquired,andthediffractionpeaks
International Research Journal of Engineering and Technology (IRJET) e-ISSN: 2395-0056
Volume: 13 Issue: 02 | Feb 2026 www.irjet.net p-ISSN: 2395-0072
areindexed.AFT-IRPerkinElmerRX-1spectrophotometer isusedtoperformFT-IRstudiesontheproducedcrystals, identifyingfunctionalgroupsusingthepelletapproachover a 400–4000 cm-1 KBr range. The spectra showed the suggested assignments of the several internal vibrational modes.
AUV-PerkinElmerLampda35spectrophotometer has been used to evaluate optical transmission and absorption spectral analysis over a wavelength range of 200–1200 nm. Light in the visible portion of the electromagneticspectrumhasauniformlyhightransmission rate (99%), which may be advantageous for device applications. A Dielectric-LCRZ meter TH2816A with a standardtwoterminalsampleholderwasusedtotest the dielectric of a polished part of the samples with known dimensions.
3. RESULTS AND DISCUSSION
3.1 XRD ANALYSIS:
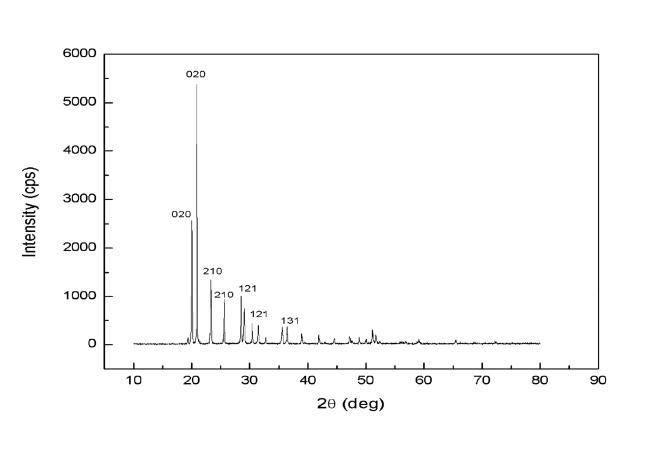
Powder X-ray diffraction experiments were performedon pureTUSNsinglecrystal.TheXRD-ULTIMA 111diffractometerwasusedtogetthegeneratedcrystals'Xraypowderdiffractionpattern.Byusingthereflectionmode forscanning,thescanningratewaskeptconstantovera2θ range of 10° to 80°. This investigation verified the crystallinityofpureTUSNsinglecrystal,andthediffraction peaks are indexed. Figure 2 displays these, and Table 1 displaystheintensityalongwiththeaccompanyingdvalues. Thedistinct,sharppeaksintheXRDpatternsindicatethat thecrystalsofpurethioureaaresingle-phaseandhavegood crystallinecharacteristics.[8]
Table -1: XRDdataforTUSNCrystal
3.2 FT – IR ANALYSIS:
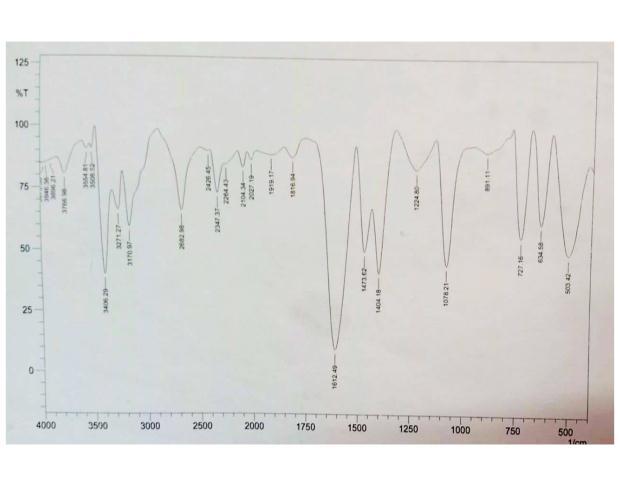
AFT-IRPerkinElmerRX-1spectrophotometerwas used to perform FT-IR analyses on the produced crystals utilizingthepelletmethodthroughouta400–4000cm-1KBr range. The FTIR spectra of pure TUSN single crystal are displayed in Fig. 3. The spectra showed the suggested assignmentsoftheseveralinternalvibrationalmodes.[9]The infrared spectra of the crystals have been used to explain TUSNsinglecrystal,whichmaybeabletocreatecoordinate bonds through both nitrogen and sulfur. The asymmetric stretchingmodesofNH2 areresponsiblefortheabsorption bandatfrequency3406and3271cm-1 Table2illustratethe vibrationalmodesobservedintheTUSNsinglecrystal.
International Research Journal of Engineering and Technology (IRJET) e-ISSN: 2395-0056
Volume: 13 Issue: 02 | Feb 2026 www.irjet.net p-ISSN: 2395-0072
Table -2: VibrationmodesobservedintheThiourea crystals
PureTUSN Wavenumber (cm-1)
BandAssignments
3406.29 NH2 asymmetric stretching
3271.27 NH2 asymmetric stretching
3170.97 NH2 symmetric stretching
1612.49 NH2 bending
1473.62 C-Nasymmetric stretching
1404.18 C=Sasymmetric stretching
1078.21 C-Nsymmetric stretching
727.16 C=Ssymmetric stretching
634.58 N-C-Sasymmetric bending
503.42 N-C-Nasymmetric bending
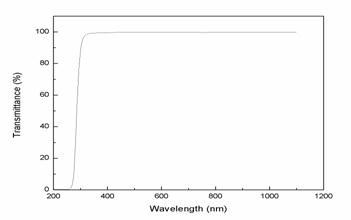
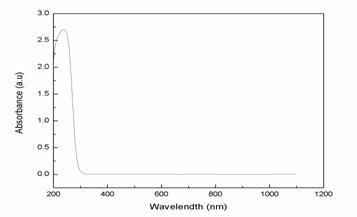
AUV-PerkinElmerLampda35spectrophotometer hasbeenusedtomeasuretheUV-Visspectralanalysisovera wavelength range of 200–1200 nm. Since the molecule's absorptionofUVandvisiblelightpromoteselectronsinthe σ and π orbitals from the ground state to a higher energy state,theopticaltransmissionspectrumtypicallyprovides usefulinformationaboutthemolecule'sstructure.Sincethe formed crystal can only be employed in the extremely transparentregion,thetransmissionspectrumissignificant from the device's point of view. Figure 4 displayed the optical transmission spectrum that was recorded. In this case,thecrystalexhibitsgoodtransmittancethroughoutthe visible spectrum. Together with the aforementioned, the lower cutoff wavelength of 241.67 nm confirms the material's suitability for optoelectronic applications. The wavelength range in which the absorption spectrum was obtained was 200–1200 nm. Figure 5 displays the TUSN singlecrystalUV-visibleabsorbancespectrum.Accordingto theabsorptionspectrum,thereisasignificantabsorptionin the190–300nmrangeintheTUSNsinglecrystal.[10,11,12]
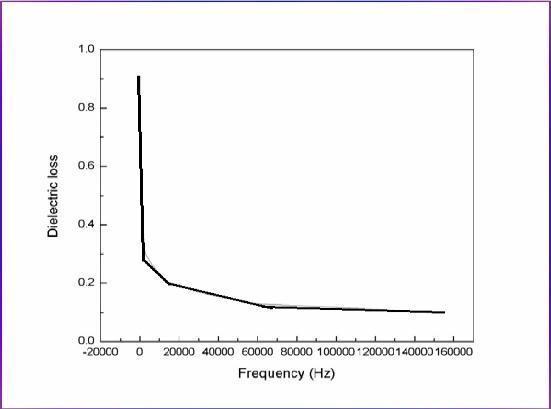
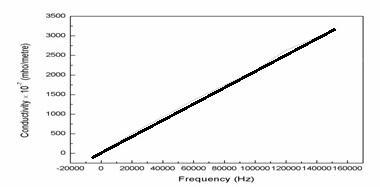
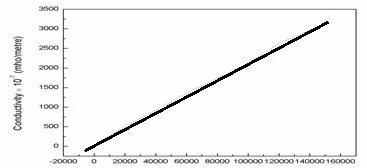
A Dielectric-LCRZ meter TH2816A with a standard two terminalsampleholderwasusedtotestthedielectricofa polished part of the samples with known dimensions. By creating a parallel plate capacitor, the pure TUSN single crystalwaspositionedinbetweenthetwocopperelectrodes. Thefrequencywasthenchangedfrom50Hzto200KHzin ordertodeterminethecapacitanceonthesample.Figure6. demonstrates how the dielectric constant of pure TUSN single crystal changes with frequency. In this case, it was discoveredthatthedielectricconstantofpureTUSNsingle crystal first had high values at low frequencies and then decreasedasthefrequencyincreased.Thereduceddielectric lossvaluesimplythattherearefewerflawsintheproduced crystals.Dielectriclossanddielectricconstantfluctuationas a function offrequencyare nearlyidentical in nature. The resistivity of pure TUSN single crystal as a function of frequencyisdisplayedinFig.8.Atlowfrequency,thistoo hashighvalues.
International Research Journal of Engineering and Technology (IRJET) e-ISSN: 2395-0056
Volume: 13 Issue: 02 | Feb 2026 www.irjet.net p-ISSN: 2395-0072
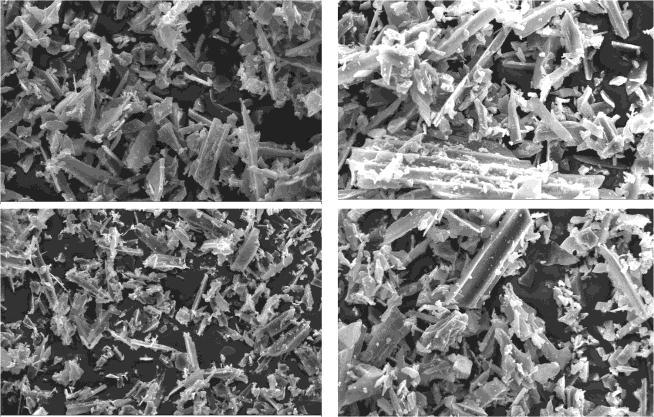
The JEOL JSM 5610 LV Scanning Electron Microscope,whichhasamaximummagnificationof2,00,000 timeswitharesolutionof5nmandanaccelerationvoltage of0.3,wasusedtoinvestigatethesurfacemorphology.The chemical microanalysis method known as EDS is used in conjunction with SEM. The quantity and energy of X-ray picturesthatwerereleasedweremeasuredusingtheEDSXray detector. The surface natureand suitability for device productionaredescribedin[SEMstudyJEOLJSM5610v], whichisalsousedtocheckfordefects.Ithasbeenfoundthat differentcontaminantshavevaryingdegreesofefficiencyin altering the surface morphology. Scanning electron micrographs of TUSN single crystal are seen in Figure 10. The micrograph illustrates the doped specimen's surface characteristics. It exhibits a nice, uniform surface that resemblesadiamondandishexagonalinshape,withafew bubblespacesthatmaybecausedbysolventevaporatingoff thecrystalsurface. [13]
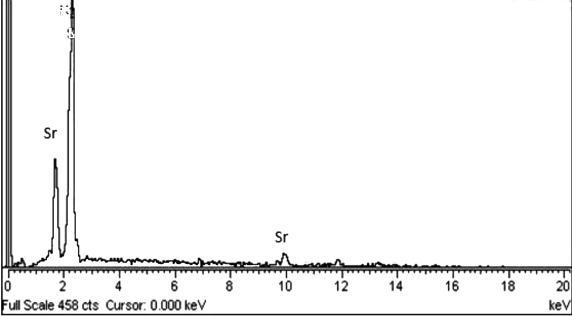
EDS figure 11 provides strong confirmation of strontium doping,whichresultsinitsincorporationintothecrystalline matrix. The graph clearly shows the increased strontium concentrationintheTUSNcrystallinematrix.Additionally,Sr accommodating capacity on the crystal's surface is uniform.[14,15]
International Research Journal of Engineering and Technology (IRJET) e-ISSN: 2395-0056
Volume: 13 Issue: 02 | Feb 2026 www.irjet.net p-ISSN: 2395-0072
SlowevaporationwasusedtogenerateTUSNsingle crystal of very high purity from saturated solution. The existence of functional groups was verified by the FTIR spectra, and vibration modes were identified. The TUSN single crystal exhibits good transparency throughout the visiblespectrumandsubstantialabsorptioninthe190–300 nmrange,accordingtotheUVtransmissionandabsorption spectrum.Thematerial'sformationandcrystalline nature were verified by XRD analysis. A low dielectric loss was foundwhenthefluctuationsindielectricconstant,dielectric loss,conductivity,andresistivitywereexaminedatvarious frequencies.Thecrystal'ssurfacemorphologywasexamined using SEM, which revealed a hexagonal and diamond-like appearancewithsomebubblevoidsthatmayhaveresulted fromsolventevaporatingoffthecrystalsurface.
EDSalsoconfirmedthepresenceofstrontiuminthe doped specimen and a slight variation in the doped specimen's intensity when compared to the pure TU specimenbecauseofthedopingeffect.TheFT-IRspectrum shows more vibration peaks when strontium is heavily dopedonthiourea.[16]
The authors can acknowledge The Management, The Principal,Vice–Principal[Academics&Non–Academics, Supervisory Heads, Eminent Teachers, Chemistry Lab & TechnicalAssistantsandStudentsofXIDiamondTheVikasa School, Millerpuram ( Affiliated to CISCE – TN044), Thoothukudi–628008,Tamilnadu,India
[1] P N Prasad and D JWilliams, Introduction to Nonlinear Optical Effects in Molecules and Polymers, John-Wiley andSonsInc,NewYork, (1991)
[2] DLedoux, ALepers, JPerigaud,JBadan, and JZyss, OptCommun, 80,149 (1990)
International Research Journal of Engineering and Technology (IRJET) e-ISSN: 2395-0056
Volume: 13 Issue: 02 | Feb 2026 www.irjet.net p-ISSN: 2395-0072
[3] S.X.Dou,D.Josse,andJ.Zyss,J.Opt.Soc.Am.B, 10,1708 (1993).
[4] GKnopfle,R Schlesser,R Ducret,andGunter,Nonlinear Opt, 9,143(1995)
[5] CSerbutoviez, CBosshard, G Knopfle, PWyss, PPretre, PGunter, KSchenk, ESolari, andGChapuis, Chem Mater, 7,1198(1995).
[6] N.R.Dhumane,S.S.Hussainietal.,Appl. Phy.A:Mat.Sci. andProc, 95,3(2009).
[7] GMadhurambal, M.Mariappan, IndJPure and Appl Phy., 48,.264(2010).
[8] CKrishnan, PSelvarajan, ,J Expt Sci, 1,3(2010)
[9] TThaila,SKumara Raman,Archives Appl Sci Res,3,1 (2011)
[10] J.ThomasJosephPrakash,M.Lawrence,Inter.J.Comp. Appli., 8,3(2010).
[11] KNagarajan, SKumaraRaman,RSundaram,Cry Res Tech., 44,4(2009).
[12] ZKotler,R Hierle,DJosse,J.Zyss,andRMasse,J Opt. Soc Am B, 9,534(1992)
[13] SVelsko, “Laser Program Annual Report”, Lawrence Livermore National Laboratory, Livermore, CA,(1990)
[14] N.B.Singh, T.Henningsen, R.H. Hopkins, R.D. Mazelsky, E.P.Hamacher, F. Supertzi, D.E.Hopkins, O. Zelmon, PSingh,J Cryst.Growth, 128, 976(1993)
[15] RMohan Kumar, DRajan Babu, D Jayaraman, RJayavel, andKKitamura,J Cryst Growth, 275,e1935 (2005)
[16] JBadan, R Hierle, A Perigand, J Zyss, In and DJ Williams,(Ed.).“NonlinearOpticalPropertiesofOrganic Molecules and Polymeric Materials” , 233 D.5, American Chemical Society, Washington,DC,(1993).