
Urbanization: Smart Urban Transit System using Artificial Intelligence

Department,
Urban areas are home to more than half of the world's population, and around 2.5 billion people are projected to be added in the next 3 decades. The way we construct new cities is at the core of our existence, from climate crises to economic vibrancy, to our well being and sense of community. Bringing "smartness" to the town and the township has been the vision of various research and policies addressing issues with the existing system and providing a vantage to sustainable development for a healthier, happier, and happening tomorrow. We explore these studies and use publicly available data to build an intelligent pipeline of amalgamated algorithms to produce a blueprint for smart city development.
Key Words: City, Urban, Urbanization, Planning, People, Population, Pollution, Transportation, Artificial Intelligence.
1. INTRODUCTION
Smart cities emphasize the capacity to build a secure, happier,andmoresustainableenvironmentthatiscentred around people's well being through improving accessibility, transit, healthcare, waste and inconvenience reduction, and social and economic quality. It is based on thenotionthatcitizensmakeupthecityandnottheother way round. Smart Cities utilize techniques that have workedinotherlocationstomeetgenuinelocalneeds.To support smart city growth, cities must build quadruple helix collaborative ecosystems capable of merging open innovation, bottom up development activities, and local entrepreneurshipinacivicframework.
Transportationhasanimpactontheshapeandliveability of cities, as well as their socioeconomic, cultural, and environmental features. The efficiency of public transportation is one of the most obvious and crucial aspects of the transportation system for inhabitants. It is vital to construct an ideal transit network and transit serviceinordertodeliversmartservices.
McKinsey & Company gathered comments from two sources to address the issue of what are the most significant components of urban transportation systems: experts and a poll of locals. According to both professionalsandcitizens,themostimportantcomponent of transportation systems is safety, which is followed by efficiency, affordability, availability, convenience, and ecologicalsustainability[1].
Availability, Affordability, Convenience, Efficiency, Sustainability (AACES) transit is what we must focus on. Solutionsneedtoberesilient,andthispaperadvocatesthe useoftechnologytoproducesmartresultsforresidentsin order to increase economic growth and improve people's qualityoflifewhilemaintainingenvironmentalbalanceby usingbothhistoricalandfuturetrendstoproposeasetof research backed principles and practices for a better, greener, and more sustainable future by using both historical and future trends to propose a set of research backed principles and practices for a better, greener, and moresustainablefuture.
2. LITERATURE SURVEY
Todd Litman in his paper, ‘Determining Optimal Urban Expansion, Population and Vehicle Density, and Housing TypesforRapidlyGrowingCities’,examinestheeconomic, social, and environmental consequences of numerous urbandevelopmentcharacteristicssuchaspopulationand vehicle density, housing type, highway design and management,andrecreationfacilityaccessibility[2].
a) Unrestrictedcitiesaresurroundedbyanabundanceof lower valuedland.Theyhavealotofroomtogrow.
b) Semi constrained cities have a limited ability to expand. Their development policies should include a combination of infill development and modest expansiononmajorcorridors.
c) Constrainedcitiescannotexpandmuch.
d) In spatially constrained cities, optimal concentrations canbeabove80residentsperhectare;however,asurban expansion is limited, optimal densities rise, optimal vehicle ownership rates fall, and a greater share of housing should be multi family. Cities should provide a variety of housing and transportation options that respond to consumer demands, particularly affordable housing inaccessible, multimodal neighbourhoods, and affordable travel modes, with pricing or roadway managementthatfavourresource efficientmodes,aswell asconvenientaccesstoparksandrecreationalfacilities,in order to be efficient and equitable. Unrestricted cities are surrounded by an abundance of lower valued land. They havealotofroomtogrow.
Factor
Regional density
ownership
Intersection density
sq.
Portion of landinroad
Table1:OptimalUrbanExpansion,Densitiesand DevelopmentPolicies[2].
Effective transportation systems must be constructed which fulfil the present needs and serve future purposes as well. Increased job prospects, a consolidated market, better pay, and increased individual wealth are all factors that have attracted individuals to cities. For a long time, these factors have been a driving force behind urban expansion. Based on the World Urbanization Prospects: 2018 report by the United Nations Population Division, theWorldBankestimatedannualglobalurbanpopulation growth at 1.81% in 2020 [4]. By 2045, an estimated 1.5 times increase in global urban population is expected [5]. Butthisglobaltrendshowsthatthegrowthintheareaofa city is comparatively slower than the population. The increasing urban demands and rapid urbanization aggravate poor air and water quality, insufficient availability of water, huge waste generation and energy demands.
Figure1:PopulationGrowthWorldwide[5]
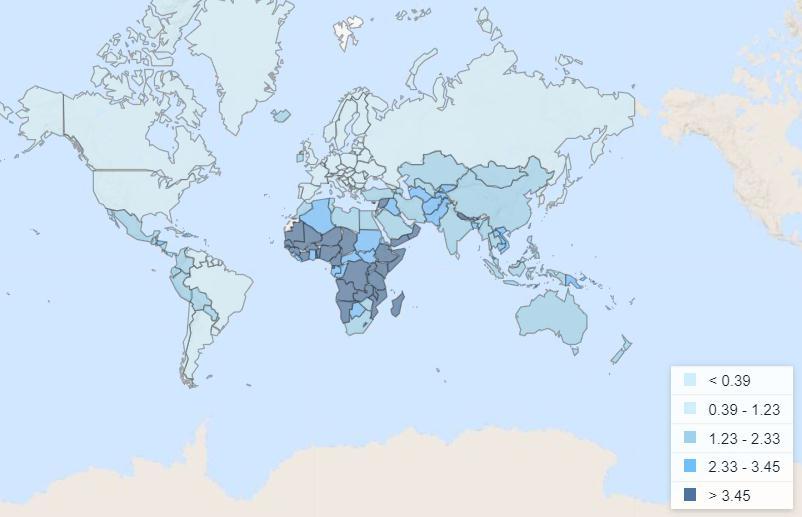
Climate change has a wide range of consequences for people's lives and health. It puts the pillars of human health in jeopardy clean air, safe drinking water, nutritiousfood,andsafeshelter andhasthepotential to undo decades of global health gains. Malnourishment, malaria, diarrhoea, and heat stress are anticipated to cause an additional 250 000 fatalities per year between 2030 and 2050 as a consequence of climate change. By 2030,thedirecthealthdamagecostsareexpectedtoreach between USD 2 4 billion per year. Even 1.5°C of global warmingisnotregardedassafe;everytenthofadegreeof warming will have a significant impact on people's lives andhealth[6].
3. PUBLIC HEALTH AND ENVIRONMENT
Improved health can be achieved by reducing greenhouse gas emissions through better transportation, dietary, and resource alternatives, particularly through reduced air pollution. Transportation accounted for 29 percent of the United States’ total emissions of 6.4 billion metric tons of carbondioxideequivalentin2017[7].Transportationand itscarbonreleasemakeforalargeandcomplicatedmatter.
Commutation is a daily travel habit and thus a crucial researchfactorinurbangeography,sociologyandplanning since it may represent both the standard of living and the effective and efficient use of urban space. Cities and metropolitan areas serve as hubs for a multitude of activities, many of which necessitate rapid and efficient peopleandcommoditiesmovement.
A SanFrancisco based urban planner,urbandesigner and architect Peter Calthorpe advocates pedestrian friendly streetsandhuman scale neighborhoods. Walkingisa low impact, not expensive, non polluting and by far the healthiest mode of commutation. Adults should engage in mild intensity strenuous cardiovascular aerobic activity, such as a brisk walk, for at least 30 minutes five days a week (or a total of 2 hours and 30 minutes), according to the US Department of Health and Human Services' 2008 Physical Activity Guidelines for Americans [8]. Walking
improves cardiovascular and pulmonary fitness, manages hypertension,highcholesterol,jointandmusclediscomfort and also diabetes, and controls body fat. It also enhances balance, muscle endurance and strength with stronger bones.
According to the World Health Organization, each individualshouldhaveaccesstoatleast9squaremetersof urban green space [9, 10], as long as it is accessible [11], safe [12],and functional [13]. In 2016, Mercer's Qualityof Living Survey named Vienna the most livable city in the world,with120squaremetersofurbangreenspaceforits 1.7 million residents. Singapore, the world's third densest metropolis, offers each of its citizens about 66 square metersofurbangreenspace.It'svitalsincethemostlivable cityisonewithenoughgreenspaceforitscitizens[14 16].
4. VISION ZERO
Vision Zero is a global movement aimed at eliminating traffic relatedfatalitiesandcasualtiesthroughasystematic approach to road safety. This strategy is founded on the notion that traffic injuries and deaths are both intolerable andpreventable.
Oslo, Norway's capital, has been designated a "Car Free City". Many new pedestrian paths have been added, and one street has been converted to a mixed use area. Two thirds of the space in the city is dedicated to pedestrians and other municipal activities. Throughout the city, playgrounds for children and families have been created. [17]
Oslo proves that car free cities are not beyond reality. A citywithnocars,a strongpublic transportnetwork,anda supportive community can exist, making its citizens healthy and happy. More green space, less pollution, a more aesthetically pleasing environment, fewer accidents and casualties, better health, a raised sense of community andtogethernessareallachievablewithvisionzero.
5. PUBLIC TRANSPORTATION
Transportation accounted for 29 percent of the United States' total emissions of 6.4 billion metric tonnes of carbon dioxide equivalent in 2017, according to the U.S. DepartmentofTransportation(USDOT)[7]anditscarbon releasemakeforalargeandcomplicatedmatter.
TheTransitsystemisoftenreferredtoasacity's"lifeline". High density movements necessitate the use of high capacitymeansoftransportationlikethebus,lightrail,and metro,whicharelessexpensive,moreenergy efficient,and take up significantly less space than private automobiles. Automobiles, unlike public transportation, are only available to those who own and are capable of operating them.
As Peter Calthorpe speaks [18] about the importance of pedestrian friendly walkable cities, focusing on Available, Affordable, Efficient, Convenient, Sustainable (AACES) Transit systems must be our prime focus. A rich metro networkishighlyessentialinacitygoingcar free.Optimal metro connectivity is where the network is strong and as quicklyaspossible,butalsoensuringnoextremelinkage
To promote walking, we consider an average of 10,000 steps per day and the U.S. Department of Health and HumanServicesrecommended30minutesbriskwalk,five days per week, as a benchmark for the minimum number ofstepsanormalindividualshouldcoverdaily,anddivide the city into circles of the radius of 0.8 km which is 10 minute walking distance (3 to 4 miles per hour is typical for most people. [19]) or 1049 steps using a conversion factor value 1312.33595801. The centre (approximately. based on 3E explained in section 7. Algorithm) of each of these circles serves as a metro station. Thus, the distance betweentwoadjacentstationscomesouttobe1.6km.
To deal with the inner gaps (which we call “packing left outs”) due to circle packing, which increases the station reachabilitydistanceforapersonoutsidethe0.8kmradius of three adjacent stations, we reduce the diameter to 1.4 km. This is a significant finding backed by existing metro systems around the globe. According to the data analysis we performed on these metro systems, the average distancebetweentwostationsis1.2km[20].
6. URBAN LAYOUT
We studied various urban layouts and decided to use the grid plan and fused grid plan. A fused grid is a scaled up versionofagridlayout.Long,widestreetscutthroughthe blocks to make transportation and navigation easier. In addition, each block was shaped into an octagon with chamferedcornerstogivetheeffectofbeing'cutoff'.
A. Grid Plan
GridPlanalsoknownasGridStreetPlan,GridironPlanisa type of urban planning technique where each street and roadintersectatrightanglesthusformingagrid.
Advantages
Cost Effective as the cost is inversely proportional tothewidthofthestreet.
Maximum land use thus solving the packing problem.
Lowervehiclespeedsduetofrequentintersections resultinfeweraccidents.
Disadvantages
Unevenlandscapesrestrictthemodel.
rainwaterretentioncapacity(highas30%).
B. Fused Grid
Fused Grids are a variation of Grid Layout with each grid larger in size and the grid consisting of cul de sacs or crescents. Each grid forms precincts or quadrants of the sizeof40acresor400m2
Advantages
o Increase in walkability compared to the conventionalgrid.[22]
o Maximum land use thus solving the packing problem.
o Neighbourhood streets exhibit low traffic volume thusfallinginnoiseandairpollution.[23]
o Traffic Congestion and the time delay are low duringpeakhours.
Disadvantages
o Unevenlandscapesrestrictthemodel.
o Three way intersection rather than a four way intersection,thusbeinglesssafe.[24 26]
C. Concentric Zone Model
The Concentric Zone Model is one of the pioneering models to illustrate urban social structures. The model includes different zones in concentric circles such as Business District at the very centre, Factory Zone, TransitionZonemixedofresidentialandcommercialuses, better qualitymiddleclasshomes,andCommuterZone at theoutercircleofthecity.
Advantages
o Oneofthesimplestmodelstobedesigned.
o Stressoneconomicdevelopment.
Disadvantages
o Unevenlandscapesrestrictthemodel.
o Themodeldoesnotfitthepolycentriccities.
o IntercityTransportationisdifficult.
7. ALGORITHM
The project uses data acquired from Google Earth Engine, implementing a machine learning model for urban layout classification and Open Street Maps data for existing site edifices.
A. Geographic Coordinate and Landscape
The very first step includes fetching the landscape coordinatesoftheuser’sinterest.Theextractionprocessis carriedoutbyGoogleEarthEngineAPI[27].Itprovidesthe location geometry in the form of ee.geometry data type. Usingthisweextractthecoordinatesofthelocationandits boundingboxesforfurtherplanningandusage.Asperthe World Bank data [28] on population growth, we have considered the global average 2.5 %. This has been considered the bounding box of the city landscape for foresightexpansion.
B. Examine Existing Edifice
While building a city, there can be existing settlements, forest areas, water bodies, and industries. For such situations, we either remove it if it is not contributing to thecityorpreserveitifitsupportsthesustainablemission. For identifying existing structures, the OSMnx library [29] comes in handy. OSMnx is a Python library for obtaining OpenStreetMap data and modeling, projecting, visualizing, and analyzing real world street networks and other geospatialgeometriesusingOpenStreetMapdata.
Once data is fetched, we categorize each data variation separately.Theselocationsareclassifiedintoonesthatcan be discarded and others that are to be preserved. We createacity maskedimagebyomittingthoseregionswith edifices. This image is essential for Rail Network Generation(explainedahead).
C. TAGEE
TAGEE [30], an acronym for Terrain Analysis in Google EarthEngine,helpsincalculatingterrainattributessuchas slope, aspect, and curvatures, for different directions and geographical extents. These attributes helped in understanding the terrain design and structure and its suitability for efficient urban layout. The landscape is divided into smaller sections using the Cut Polygon algorithm. We have taken into consideration the terrain analysis of the complete landscape and along with it the terrainanalysisofsmallersectionsofthelandscape.Using this algorithm, we have analyzed 18 major cities in the world and used the extracted data to train our machine learningmodel,explainedinthenextsection.
D. Urban Layout Classification
Urban Layout is a very important aspect of Urbanization. Theurbanlayoutofthelandscapeareaisdecidedbasedon its altitude, geographic conditions, and other terrain relatedattributesusingamachinelearningmodelanddata generationusingtheResNetmodel.
The Cut Polygon algorithm explained earlier is also used for this process as well. For each small geometry of the landscape, the pre trained ResNet model [31] is used to
figure out the urban layout of 18 cities into smaller sections. The whole data includes around 88 features that can lead to multidimensionality problems. Thus, we used PCAorPrincipalComponentAnalysisforreducingfeatures with similar trends and correlations. On applying PCA, 88 features boiled down to 13 features. Next, we applied different machine learning algorithms to our dataset. Amongst, Random Forest Classifier proved to be efficient withanaccuracyof64%.
When the user’s landscape is provided, it will be divided into small sections with respect to the bounding region of the landscape. For each section, an urban layout grid or radial is predicted using the Random Forest Classifier discussed earlier. Using the predicted data, an image is createdwithcolorsdescribingeachurbanlayout.Withthe help of the computer vision technique, centroids of each color are calculated. These centroid values will be passed ontothenextphaseofcityroadgeneration.
E. Generative Tensor Field XStreamlines
Tensorfieldsarethebasicbuildingblocksofroadnetwork generation.Useoftensorfieldsisa procedural methodfor the generation of roads. A tensor field is a continuous functionthatassociatesatensorTwitheverypointp=(x, y) ∈ R2. Eigenvectors decide the curve of the road. Major and minor eigenvectors are always perpendicular in the plane. XStreamlines are a very important concept that describes the curve along with the eigenvector fields. The frontend UI, City Generator Simulator [32] [33], we referred to is a city layout generation simulator that generates imaginary maps with no on field points and attributestakenintoconsideration.It hasprovideda clear picture of the project. We have made remarkable changes as per our needs as our outputs are based on a range of differentparametersasdiscussedinearliersections.
As the City Generator Simulator provides a imaginary city map, we have normalized the whole coordinate system with respect to the bounding box of the landscape. The centroid values we have calculated in the last section for urban layouts are used for center, size, and decay value. The decay value denotes which centroid will be more powerful and have more impact on nearby tensor fields when two or more centroids are in the proximity of each other.
While researching the project, we came across GCPN, Graph Convolutional Policy Network [34]. GCPN uses a graph basedstructuretooptimizetheprovidedgoalswith respect to a given pre defined set of rules. Though the GCPN paper has a research study in chemistry and drug discovery, a similar use case can be applied to road networkgenerationbutduetoaveryhandfulofcontentis available on Graph Neural Network we are still understandingtheconceptsandwillapplythesametothe projectinthefuture.
F. Rail Network Generation
Along with the road network, the railway network system is an important part of urban infrastructure. While planning the rail network, we encountered a few studies and derived a value of 1.6 kilometers for the distance between two stations. Thus, for generating a rail network we had stationary and fixed nodes and now the challenge was to connect these nodes. We first had thought of connectingeachnodetoallothernodesandwe’llbedoing pruning to reduce complexity. Unfortunately, this method iscomputationallynotviableasina fullyconnectedgraph of 100 nodes, the edges would be around 5000 and will increaseexponentially.Thus,wecomeupwithasolutionof usinggraph basedalgorithmsi.e.,Dijkstra’sAlgorithmand MSTAlgorithm.
Dijkstra’s algorithm is used to find the shortest path between the source node and the destination node based onsomeparameterssuchasdistanceorweights.
MSTorMinimumSpanningTreealgorithmconnectsallthe vertices together of the input graph. The solution graph avoids any cycle in the graph and provides an optimum solutionforourproblem.
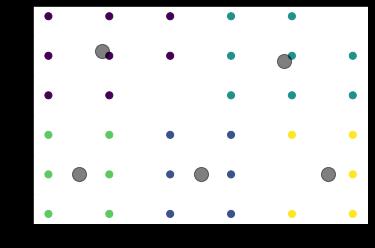
So,aswehavethefixednodesonthegraph,weclusterthe nodesintoindividualclusters.Nowweselectpointsineach cluster with respect to other clusters based on the Euclidean distance. So, for n clusters, there can be 1 node for all (n 1) clusters or (n 1) nodes, each for each cluster. For inter cluster connections, we are using Dijkstra’s algorithm. Now considering the connections within the cluster, we are applying the MST algorithm for efficient intra clusterconnections.
Another point to consider here is what if the node is plotted in place with some existing structure that can’t be displaced such as a forest or historic place. For such a situation,weareusingthecitymaskedimagementionedin the Examine Existing Edifice section. This image will help indecidingwhethertoconsiderapointifitisinthecoreof the forest or shift that point, if placed on the edge of the forestorthehistoricplace.
Keeping in mind the future expansion of the city, we have placed a few stations outside the user’s region of interest withinitsboundingbox.
Whileresearchingrailnetworkgeneration,wecameacross Link Prediction using Graph Neural Network [35]. Link Predictionishelpfulinpredictingtheedgesbetweennodes based on parameters such as the number of adjacent nodes, the weight of nodes, adjacent edges, transitive edges,etc.Weareworkingtowardsthisbyincorporatingit intoUrbanization.
IMPLEMENTATION

1. User Input
Figure2:UrbanizationUI
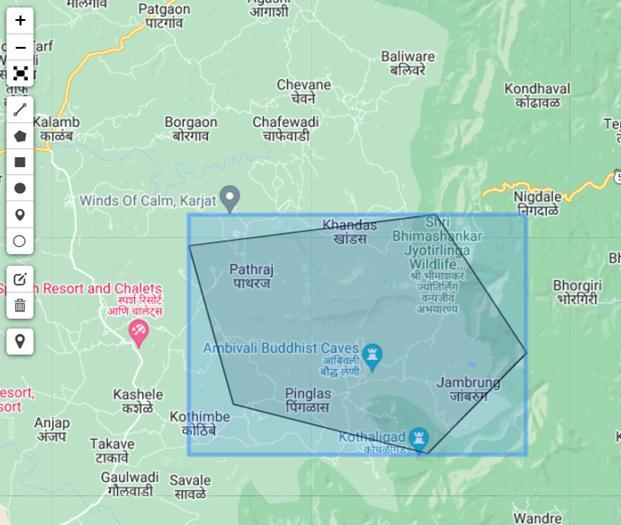
Nextusercanplothisregionofinterestontheearthengine embedded map. Along with the region of interest its boundingboxisalsocapturedandstored.
coordinates and bounding box values are normalized between0and1foreachmigrationtoothersectionsofthe project.
The white color indicates some kind of settlement, high altitudeterrain,waterbody,orforestarea.Whiletheblack regionisonewherewearegoingtoplotourcity.

3. TAGEE and Urban Layout Classification
Figure3:UserInputonEarthEngineMap
2. 3E Examine Existing Edifice
Lookingforexistingsettlementsorstructuresandcreating acity maskedimagerequiredforRailNetworkGeneration.
Figure5:UrbanLayoutsHeatmap
Now for the bounding box, the terrain details and attributes are extracted using TAGEE. This data is further usedforpredictingurbanlayout.Aheadwearegenerating an image describing urban layout distribution. Orange, blue, and green denote grid, organic and radial layouts. CentroidsofeachlayoutarestoredinJSONdatatype.

4. GTX Generative Tensor Field XStreamlines
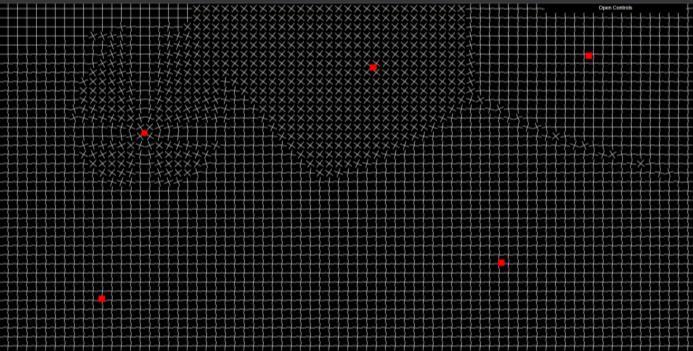
As discussed in the earlier section about GTX, it plots a landscapewidetensorfieldasshowninthefigure.Thered dots on the tensor field are the centroids calculated for urbanlayoutprediction.Thesedotswillformthecenterfor each layout and can influence the tensor fields in its proximity.
Optimized Blueprint Cartography / Output
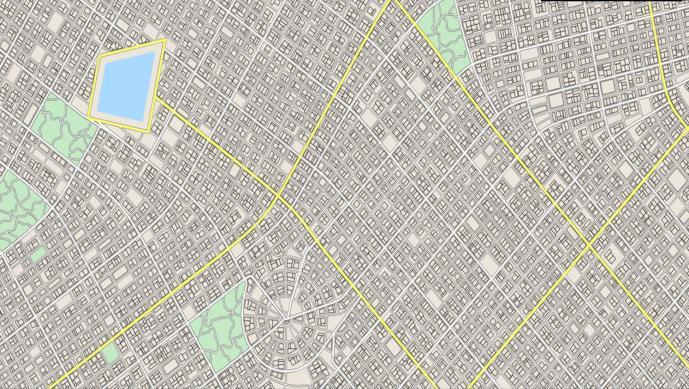
Optimized based on different parameters taken into consideration right from the beginning, the following city blueprint is generated using Urbanization. It has included all types of buildings, major and minor roads, parks and forest, and water bodies with appropriate and efficient roaddesigningandbuildingplacement.
Network Generation
Output
8:Nodeswiththeircentroidsforrailnetwork
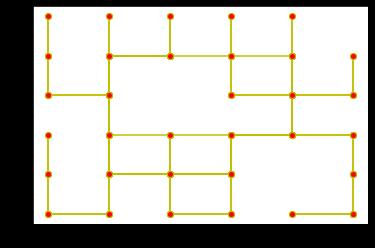
AsexplainedearlierinAlgorithmssection,wehaveplotted the centroid of each cluster. Based on these centroids Dijkstra and MST algorithms are applied for the final result presented below. Currently we have demonstrated thealgorithmonaexamplesetinprototypephaseandwe are working on its full scale deployment into Urbanization.
RailNetworkGenerationinPrototypePhase
8. CONCLUSIONS
To summarise the findings of the study, the problem of unplanned city transits is a huge setback for the urban cities, and it must be addressed as soon as possible. Urbanization is an online application that aids the urban planners to design and plan transit systems of city with more sustainability. Urbanization Smart City Smart Planner employs Generative Tensor field Xstreamlines (GTX). Urban Planners using Urbanization, provide the geographical area. The data is sent on to the GIS for area specificationsandGTXforroadplanningandmicroblocks designing. Taking into account all the elements stated above regarding technology implementation and ecologicallysoundness,Urbanizationbuildsablueprintfor theregionprovidedandsuggestssomeguidelinesthatcan benefittheplanner.Urbanizationdoesnotreplacetherole ofurbanplannerbutinsteaditaimsatreducingtheburden anddesigningmoresustainably.
health(who.int)
SourcesofGreenhouseGasEmissions
EPA
https://health.gov/sites/default/files/2019
[9] World Health Organization (2010). Urban Planning, Environment and Health: From Evidence to Policy Action. From http://www.euro.who.int/__data/assets/pdf_file/000 4/114448/E93987.pdf?ua=1. Accessed on April 22, 2016.
[10] Morar, T., Radoslav, R., Spiridon, L. C., & Păcurar, L. (2014). Assessing pedestrian accessibility to green spaceusingGIS.
[11] Takano, T., Nakamura, K., & Watanabe, M. (2002). Urban residential environments and senior citizens’ longevity in megacity areas: the importance of walkable green spaces. Journal of epidemiology and communityhealth,56(12),pp.913 918.
[12] Frumkin, H. (2003). Healthy places: exploring the evidence.Americanjournalofpublichealth,93(9),pp. 1451 1456.
[13] Singh, V. S., Pandey, D. N., & Chaudhry, P. (2010). Urban forests and open green spaces: Lessons for Jaipur, Rajasthan, India. RSPCB Occasional Paper, 1, pp.1 23.
[14] Jim, C. Y., & Chen, S. S. (2003). Comprehensive green spaceplanningbasedonlandscapeecologyprinciples in compact Nanjing city, China. Landscape and Urban Planning,65(3),pp.95 116
[15] Baharash,Bagherian(2015).Liveable Cities:Greening for Success from https://www.linkedin.com/pulse/liveable cities greening success baharash bagherian?trk=pulse det nav_art.AccessedonMarch20,2015.
[16] Healthy Parks Healthy People Central (Unspecified). Urban planning and the importance of green space in cities to human and environmental health. From http://www.hphpcentral.com/article/urban planning and theimportance of green space in cities to human and environmental health.AccessedonJuly 20, 2016. Healthy Parks Healthy People Central (Unspecified). Urban planning and the importance of green space in cities to human and environmental health. From http://www.hphpcentral.com/article/urban planning and theimportance of green space in cities to human and environmental health.AccessedonJuly 20,2016.
[17] https://en.wikipedia.org/wiki/Oslo
[18] TED Talk
https://www.youtube.com/watch?v=IFjD3NMv6Kw
[19] https://www.healthline.com/health/exercise fitness/average walking speed
[20] http://mic ro.com/metro/table.html
[21] Jane McIntosh, The Ancient Indus Valley: New Perspectives; ABC CLIO, 2008; ISBN 978 1 57607 907 2;pp.231,346.
[22] Sun, J. & Lovegrove, G. (2009). Research Study on Evaluating the Level of Safety of the Fused Grid Road Pattern, External Research Project for CMHC, Ottawa, Ontario
[23] IBI Group 2007 Comparing Current and Fused Grid Neighbourhood Layouts for mobility, infrastructure and emissions costs, Canada Mortgage and Housing Corporation
[24] Dumbaugh, Eric; Rae, Robert (2009). "Safe Urban Form: Revisiting the Relationship Between Community Design and Traffic Safety". Journal of the AmericanPlanningAssociation.75(3):309 329.
[25]
Marks, Harold (1957). "Subdividing for traffic safety". TrafficQuarterly.11(3):308 325.
[26] Lovegrove, Gordon R; Sayed, Tarek (1 May 2006). "Macro level collision prediction models for evaluating neighbourhood traffic safety". Canadian JournalofCivilEngineering.33(5):609 621.
[27] https://earthengine.google.com/
[28] https://data.worldbank.org/indicator/SP.URB.TOTL.I N.ZS
[29] Boeing, Geoff. (2017). OSMNX: New Methods for Acquiring, Constructing, Analyzing, and Visualizing Complex Street Networks. Computers Environment and Urban Systems. 65. 126 139. 10.1016/j.compenvurbsys.2017.05.004.
[30] Safanelli, J.L.; Poppiel, R.R.; Ruiz, L.F.C.; Bonfatti, B.R.; Mello, F.A.O.; Rizzo, R.; Demattê, J.A.M. Terrain Analysis in Google Earth Engine: A Method Adapted forHigh PerformanceGlobal ScaleAnalysis.ISPRSInt. J. Geo Inf. 2020, 9, 400. DOI: https://doi.org/10.3390/ijgi9060400
[31] Chen W, Wu AN, Biljecki F (2021): Classification of Urban Morphology with Deep Learning: Application onUrbanVitality.Computers,EnvironmentandUrban Systems90:101706
Guoning Chen, Gregory Esch, Peter Wonka, Pascal Müller, and Eugene Zhang. 2008. Interactive procedural street modeling. ACM Trans. Graph. 27, 3 (August 2008), 1 10. DOI:https://doi.org/10.1145/1360612.1360702
https://probabletrain.itch.io/city generator
[34] You,Jiaxuan,BowenLiu,ZhitaoYing,VijayPande,and Jure Leskovec. "Graph convolutional policy network for goal directed molecular graph generation." Advances in neural information processing systems 31(2018).
[35] Muhan Zhang and Yixin Chen. 2018. Link prediction basedongraphneuralnetworks.InProceedingsofthe 32ndInternational Conference onNeural Information Processing Systems (NIPS'18). Curran Associates Inc., RedHook,NY,USA,5171 5181
BIOGRAPHIES
DILIPJAIN
BEComputerEngineering,SIGCE
SIDDHESHKADAM
BEComputerEngineering,SIGCE
ADITYAMAHIMKAR



BEComputerEngineering,SIGCE
PROF.VAISHALIYEOLE
ComputerEngineeringDept,SIGCE