
and moreover architecture,
Social contact attempts to provide both a high effective alternative and natural interaction gateway between humans and machines, a good customer support in technological advancement, virtual learning development, and so on. As emotional responses are indeed a vital aspect of human interactions, they have naturally become a crucial element of the development of people machine connection based apps. Facialfeatures,physicalsigns,andlanguageareallexamples of how science could be used to analyze and interpret reactions. Feelings expressed through audio signals must be frequently identified and properly maintained in order to obtain more spontaneous and transparent interactions between users and machines. During the previous 20 years of research emphasized on emotion interpretation, various machine learning methods have been suggested and modified. As an outcome, SER was founded (Speech emotion recognition model). Speech identification is used in a broad array of applications.Frustrationidentificationisbeingused toevaluate the performance of audio interfaces or consulting services. It permits internet companies to personalize their services to the emotionalcircumstancesoftheirconsumers. Tracking aviation crews' anxiety levels can decrease the probability of an air traffic accidents. Numerous scientists have integrated expression identification systems into their technologies in attempt to optimize consumers computer interaction experiences and encourage them to participate. Hossain used real time face detection and emotion prediction to enhance the accuracy of a web online interfaces. The focus is to maximize customer participation by modifying the play according to their interests. The key focus is that input data, audio, and video proof will be assessed to identify the participant's mental state and give suggestions. For an effective SER system, three important concerns must be (1)addressed:selecting a solid emotional speech database (2) identifying and extracting useful characteristics (3) model.Usingmachinelearningalgorithms,createareliableRNNInpractice,theSERprogram'semotionsextraction of features is a big concern. Power, tone, amplitude intensity, Time Domain Power spectrum Values , Mel frequency cepstrum coefficients (MFCC), and amplification features were just a couple of fundamental speech characteristics that carry speech content which have been described by various studies. As an outcome, majority experts want to use a mixed features, which is composed up of several different distinct characteristics that carry extra incoming content. And use of a composite features, on either end, will result in heavy scale and duplicating the speech signals, challenging the training for most deep learning methods and elevating the risk of errors. As an outcome, selection of features is essential to remove duplicating of
experience,
International Research Journal of Engineering and Technology (IRJET) e ISSN: 2395 0056 p ISSN: 2395 0072Volume: 09 Issue: 01 | Jan 2022 www.irjet.net © 2021, IRJET | Impact Factor value: 7.529 | ISO 9001:2008 CertifiedJournal | Page 586 SPEECH EMOTION RECOGNITION USING LSTM R.LEELAVATHI1, S.ARUNA DEEPTHI2, V.ARUNA3 1, ,2 ,3Asst prof ,Vasavi college of Engineering ,Hyderabad, Telangana *** Abstract - Emotional responses are also an important component ofdailysocialinteractions. Itwas fundamentalfor finalbeenphaseFurthermore,themechanismpreviousforgettingminimizesconcentrationbasedspeech'swaves,supplementedneuraladvised,phases,orderonneedssocialdeterminationrecognizecharacteristics.computationalclassifEarlierissuggestionsofItbothrealisticandevensomesensibledecisiontakingpurposes.facilitatesusallinrecognizingandinterpretingthemoodsothersbyconveyingourownreactionsandmakingtoothers.Detectionandclassificationofemotionsanewresearchareawhichhasnowledtotheemergence.studieshaveexaminedarangeofemotionalicationtechniques.SpeechsignalsareagreatsourceforlinguisticsbecauseoftheirgreatAndthat'swhythenumberofexpertswantstospeechemotion.Overthelastdecade,theofspeechsignalsemotionwasakeyfocusforinteraction.Buttheactualeffectivenessofidentifyingbeupgradedduetotheextremescarcityofknowledgethefundamentaltemporallinkofthespeechwaveform.Intomakefulluseofthechangeinemotionalcontentoveranewmethodtovoicerecognitionisnowbeingcouplingstructuredaudioinformationwithlongtermnetworks(LSTM).Timeseriesaspectswerebystructurespeechfeaturesextractedfromthewhicharenowresponsibleforsustainingtheactualunderlyingrelationshipbetweenlayers.SomeLSTMoptimizedmethodsaregiventodetermineemotioninmultipleblocks.Tostartwith,thestrategycomputingcostsbyadjustingtheconventionalgate.Second,ratherthanusingtheoutputfromtheiterationofthenormalmethod,anattentionisappliedtoboththetimeandfeaturedimensionsinLSTM'sfinaloutputtoobtaintaskrelatedinformation.insteadofusingtheresultsfromthepreviousoftheregularmethodology,aeffectivetechniquehasusedtofindthespatialandcharacteristicaspectsintheoutputoftheLSTMtoacquireinformation. Key Words: Open cv, Keras, Python3.6, Skicit learn, Tensorflow, Num.py, Pandas, Librosa 1. INTRODUCTION





2. PROPOSED WORK
International Research Journal of Engineering and Technology (IRJET) e ISSN: 2395 0056 p ISSN: 2395 0072Volume: 09 Issue: 01 | Jan 2022 www.irjet.net high speech scale. Either extraction of features and selection of features can optimize machine learning models training accuracy and reduce time overhead, localize, and minimize internal needs. Speech emotion recognition concludes with categorization. It involves working with converting actual speech data into a specific emotion based on energy spectrum characteristics. A huge number of factors in the voice signal represent the emotional features. Choosing which characteristics to use is one of the most challenging aspects of emotion analysis. Many common aspects such power, tone, amplitude intensity, Time Domain Power spectrum Values , Mel frequency cepstrum coefficients (MFCC), and amplification features have been retrieved in recent study. We chose MFCCto extract theemotional state of speech signals in thisstudy..
Different strategies for discourse acknowledgment are studied in this section. Mixture of profound neural organizations (DNNs) are presented to enable programmed discourse acknowledgment while reducing energy utilization. B.Liu ,H.Qin , Y.Gong :”An energy efficient reconfigurable architecture for automatic speech recognition”. This study provides an innovative blended reconfigurable design that employs estimation registering units to speed up the half and half DNN while reducing energy consumption. This research shows a potential design for 20 watchword recognition that uses 163.8 terabits of energy per second compared to 3.3 terabits per second for standard voice recognition. Because of their large number of neurons and neurotransmitters, DNNs' preparation requirements necessitate a significant quantity of resources and low energy usage. To deal with these problems, DNN gas pedals have implemented a variety of advanced and simple plans. Because of its big size and excessive force use, FPGAs aren't suited for low power applications. Massive amounts of DSPs for DNNs have been distributed. ASICs are designed to work in tandem with explicit DNN models and geographies, with the possibility of exploiting them. The proposed processor is capable of performing up to 1.27 trillion tasks per second while consuming almost little energy. In terms of energy efficiency, it can also outstrip the current generation of DNN gas pedals. According to the research, using recreation exploration can improve energy efficiency by ten times. A YodaNN BWN gas pedal is recommended for ultra low force registration because the Binary Weight Network has shown fantastic energy economy and arranging abilities comparable to complete accuracy networks in various data sets. In this study, we describe a reconfigurable mixture DNN design that conserves energy while executing voice recognition circuits. For discourse acknowledgment, a crossover DNN is introduced, which includes BWN for the recognitionof20regularcatchphrases, aswellasshortandlong termmemory foracoustic models. To speed up crossover deep neural network and make it more energy productive a readjustable half breed advanced simple engineering with two gas pedals: BWN and RNN are propsed. The recommended LSTM RNN network is packed using a pressure method that employs the previously discussed crossover bit width weighting technique. Before theRNNgaspedalestimation,the compressed weight will be decoded into 16 pieces to simplify the equipment plan. N.Cummins , S.Amiriparian : “A deep spectrum feature representation based on images for emotive speech recognition”. We have a reconfigurable half breed advanced simple engineering with two gas pedals: BWN and RNN to speed up crossover DNN and make it more energy productive. The proposed LSTM RNN network is packed using a pressure method that uses the crossover bit width weighting technique that was previously explained. The compressedweightwillbedecodedinto16partsbeforethe © 2021, IRJET | Impact Factor value: 7.529 | ISO 9001:2008 CertifiedJournal
| Page 587
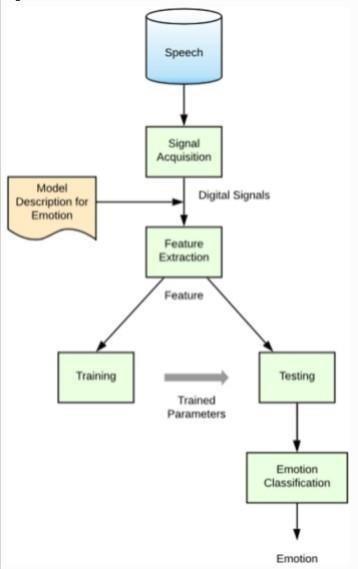
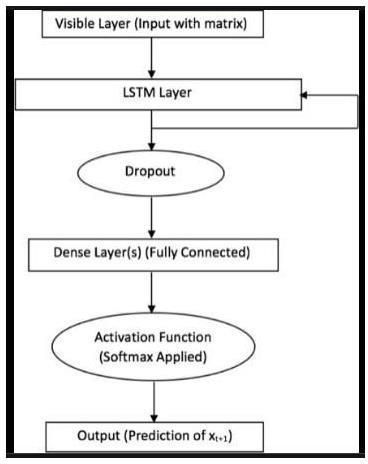
As speech is the form of expressing and to connect with the computer world, we define speech emotion recognition system. It includes grouping together various methodologies to analyze speech signals so that embedded emotions are identified. There are many models available to process speech signals to make prediction and identify the embedded emotion lying in it. Here in this project, we are implementing recurrent neural network model including Long Short Term Memory. Audio file is a sequential data and needed a appropriate model to learn it and analyze. So we choose sequential lstm model to implement this project. The main objectives are: 1. To design a system that can detect embedded emotion in speech. 2. To achieve accuracy in prediction. 3. To avoid Vanishing gradient problem with RNN. Fig-1: block diagram of emotion recognition
3. LITERATURE SURVEY
Appendix A discusses and assesses the ILSVRC 2014 object field system, while Appendix B describes the very deep functional generalization of other datasets, for completeness' sake.
RNN gaspedal estimationto maketheequipmentplaneasier to follow. First, we go through in depth a unique acoustic classification model known as deep spectrum characteristic, which is generated by processing a wav file through a neural network audio classification and constructing a feature map from the activation of the last fully connected layer. We compared the metrics of our new feature for level 2andlevel 5 speech based emotion recognition to the standardized acousticrepresentation.Whencomparedtonoise typetrain test conditions, the key findings show that deep spectrum characteristics perform similarly to other tests' acoustic characteristics. AlexNet and VGG19 are open source and previously trained deep CNN models that were tested on over one thousand files in audio classification. Some claim that a hierarchical blend of convolutional and clustering layers, rather than low level features, provides a strong visual representation. The deep rendering features retrieved from AlexNet's top activation have been demonstrated to have enough rendering and generalization capabilities for picture identification tasks. In the field of audio, it has been proved that feeding spectrograms through CNN produces appropriate screens for acoustic event detection, music detection, automatic audio identification, and speech based emotion recognition. The activation of the second fully connected layer (fc7), acquired by transmitting the spectrogram through AlexNet, is used as the feature vector for the deep spectrum feature. We compared the impact of deep range highlights to two types of standard acoustic element depictions: a slightly widened Geneva Minimalist Acoustic Parameter Set customized for feeling recognition and the 2013 Interspeech Brute Force Computational Paralinguistics Challenge , which is a massive list of capabilities that can be viewed as a complete list of capabilities for subbing. This article investigates the influence of convolutional network depth on precision in large scale image recognition situations.Our main contribution is to use an architecture with a very small convolution filter (3 3) to thoroughly evaluate the network with greater depth, demonstrating that by increasing the depth toaweightof16 19,itispossibletogetaclearviewof existing technology configuration to improve the layer. The Image Net Large scale Visual Recognition Challenge (Russakovsky ) in particular has aided in the improvement of deep audio recognition models and has served as a testing platform for several generations. scale image classification system, ranging from coding of high dimensional surface features (Perronnin et al., 2010) to deep convolutional networks (Krizhevsky et al., 2012). Many attempts have been made to improve upon Krizhevsky et aloriginal's architecture as ConvNetsbecomeacommodityinthefieldof computer vision. Another major component of the ConvNet architecture's depth of design is discussed in this article. To accomplish this, we adjust various architecture settings and gradually raise the network's depth by adding more convolutional layers, which is possible because all layers employ relatively small convolution filters. As a result, we propose a more precise ConvNet architecture that not only
International Research Journal of Engineering and Technology (IRJET) e ISSN: 2395 0056 p ISSN: 2395 0072Volume: 09 Issue: 01 | Jan 2022 www.irjet.net
CONVNET 2 Configuration All ConvNet tier settings were created using the same principles inspired byCiresan and others to quantify the benefit due to increased ConvNet depth in a fair environment. This section discusses the overall layout of the ConvNet configuration before delving into the exact configuration utilized in the next assessment. Instruction in architecture A fixed size 224 by 224 RGB image is sent into the ConvNet. Layers with very small containment fields (left/ right, top / bottom, smallest size to capture the concept of the centre) were used with a filter. After convolution, the spatial resolution is preserved via the spatial padding layer input of conv. The five largest pool layers, which follow a section of the switch, are responsible for spatial pooling. Three fully connected layers follow a stack of fully connected lstm layers; the first two contain 4096 channels each, while the third has 1000 channels.. All networks have the same setup for the fully linkedlayer. With the exception of one, none of our networks used LRN normalization. In this scenario, the LRN layer's parameters change only in depth from the network's 11 layer weight. For each arrangement, we show the number of parameters. Our network has the same amount of weights as shallower networks with larger convolutions, despite its depth. We utilize three of them, each of which is quite modest. Each pixel's input is convolved with the receptive fields over the whole network. The two 3x3 transform stacks are simple to inspect. An active receptive field of 5 5 is found in layers. As layers are boldly added from left to right, the depth of the composition grows. To begin, instead of using a single non linear rectifying layer, we use three to increase the discrimination of the choice. The 3rd floor 3x3 convolution stack is parameterized assuming that both the inputs and outputs have C channels. Layers allow the decision function's nonlinearity to be increased without altering the transition's receptive field. Despite the fact that our 1 1 convolution is basically a linear projection onto the same dimensional space, the rectification function introduces a nonlinearity. Recently, layers were used in the "network in a network" design, which used a deep convolutional network to identify street numbers and proved that increasing the depth increases performance. It was produced separately of our work, hence it uses deep ConvNet and low volume Product filters that are analogous to ours. Because your proposed system is more sophisticated than ours, the spatial resolution of the input is adjusted more radically in the early layers to reduce the amount of computation The ConvNet training and evaluation categorization is described in detail in this section. Krizhevsky is frequently followed in the Factor
.Evenachievesthehighestlevelofprecisioninaudioclassificationwhenutilizedaspartofabasicpipe(forexample, the deep characteristics classified bylinear SVM do not need to be fine tuned). The details of audio recognition training and evaluation are then introduced in Section 3, and the parameters in the ILSVRC classification task are compared.
© 2021, IRJET | Impact
value: 7.529 | ISO 9001:2008 CertifiedJournal | Page 588
3.1 AUDIO PROCESSING
Audio files need to be pre processed before extraction of features. Generally the process of Pre processing comprises of removalofnoiseandsilenceandpre emphasis.
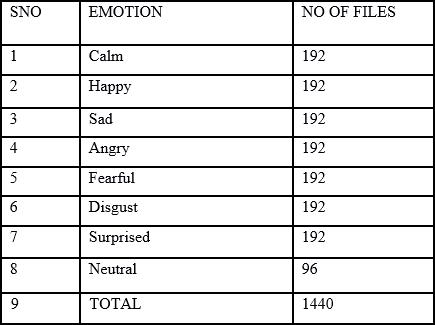
American accent. Each actor is allowed to record audio with different emotions including happy, calm,, sad, angry, surprise, fearful and disgust. The dataset is represented in tabular form:
Table 1: Audio dataset details.
ConvNet training process. In other words, to maximize multiple logistic regression targets, training is done using a small batch gradient descent with momentum. The weight loss is regularized , and first two stack of layers are dropped out of the training. Because of (a) the implicit regularizationenforced bymoredepthandlessconvolution, we believe that our network requires fewer epochs to converge, despite having more parameters and depth. (b) Some layers are pre initialized. Initializing the network weights is critical because inadequate initialization can lead the deep network to cease learning owing to unstable gradients. The stack of four layers are then initialized, and the three layers are fully connected to the layers of network A while training a deeper design. It's worth noting that, following the introduction of the article, we discovered that the Glorot & Bengio random initialization approach may be usedtoinitializetheweights withoutanyprior training. The rescaled training images are randomly cropped to generate 224 224 fixed size ConvNet input images. The crop will cover a small portion of the image that contains a small object or a component of that object. To establish the training scale S, we investigate two ways. We test trained models on two scales in our research. Multi scale training is the second way of S configuration, in which each training image is rescaled independently using random S samples from a given range. Scale jitter, in which a single model is trained to recognize objects at numerous scales, can alternatively be thought of as an improvement of the training set. For speed concerns, we train a multi scale model by fitting all layers of a single scale model to the same configuration. Test During the test, it is classified as follows using a trained ConvNet and an input picture. The network is then intensively applied on the rescaled test picture. The resultisa class score map withthe samenumberofchannels as classes and a spatial resolution that may be adjusted dependent on the size of the input image. The class score map is then spatially averaged to provide a fixed size vector of the image's class scores. The test suite was expanded further by flipping the picture horizontally; the final image score is determined by averaging the soft max values of the original and flipped images. It is not necessary to sample numerous crops during the test since the fully convolutional network applies to the entire picture, which is inefficient because it requires the network to be recalculated for each signal.
Page
International Research Journal of Engineering and Technology (IRJET) e ISSN: 2395 0056 p ISSN: 2395 0072Volume: 09 Issue: 01 | Jan 2022 www.irjet.net
3.2 DATA COLLECTION
Is a key factor in the formation of every data related tasks. Deep learning techniques generally need a huge dataset to minimize overfitting as it a major problem. Quite a few datasets for voice identification are available on various internetsources Themajorityofthetaskinthisfieldisdone on publicly available databases. Dataset structure used in this project is RAVDESSdataset It includes 1440 audiofilesof24 actors which includes half of male and half female actors and each of them has 60 recordings . The speech is in North
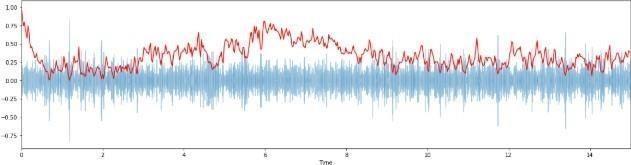
Figure 2: Image of Pre Processed Signal Speech signal usually contain parts of silence which has no information . So this silence has to be removed and various methods are available to remove it .In deep learning we have librosa package to read the audio files and analyze them. It helps in decreasing processing time and improve performance of system..Next pre emphasis is done to retain higher frequencies and leaving lower frequencies because only higher frequencies contain actual information of the speech. It is done usually to compensate the high frequencies which are suppressed when humans speak. In librosa package we have pre emphasis() method to perform it. It samples all frequencies to a defined samplingrate © 2021, IRJET | Impact Factor value: 7.529 | ISO 9001:2008 CertifiedJournal | 589
The vocal signal is broken down into frames, each of which lasts 20 30 milliseconds. M (MN) is used to differentiate successive frames from N samples collected from the voice stream. The standard values used are M=100 and N=256. When monitored over a short period of time, speech is a time varying signal that demands framing, but its features are rather unchanging. As a result, a spectrum analysis can only be done for a certain length of time.
Speech signals are generally time varying and there characteristics change as time passes. Speech signal is depicted in terms of amplitude spectrum. Based on these short term amplitude spectrum we can extract features from speech. The difficulty involved in this feature extraction is that speech signal vary for each individual speaker. There are many techniques available for feature extraction ,in this project we are using Mel frequency ceptral coefficients(MFCC). It is not that easy to recognize speech from the audio waveforms because of the huge variability of signal. So it is better to extract features which help to cutdown variability. It involves removing unwanted information from the speech.
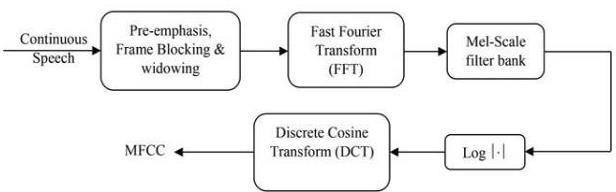
4 MEL FREQUENCY CEPTRAL COEFFICIENTS (MFCC): Applying window function on the signal and then applying Discrete Fourier Transform, taking the log of the magnitude, setting the frequencies on a Mel scale, and then applying the inverse DCT are all part of the MFCC feature extraction technique. The following sections describe the various steps involved in extracting MFCC features.
4.2
4.1 Pre Emphasis: Pre emphasis is a method of filtering that emphasises higher frequencies. With a high frequency roll off, it aims to balance the spectrum of audio sounds. In the case of spoken sounds, the source slopes at around 12 dB per octave. However, when acoustic feature energy is present, thespectrumshowsa +6dB/octavespikeasit radiates from the lips. As a result, a speech signal noted with a microphone at a distance has a 6 dB/octave downward slope when compared to the spectrum of the verbal track. As a result of pre emphasis, some glottal effects are removed from the vocal tract's characteristics.
ISO
90 Figure - 3: Block Diagram Of MFCC Feature Extraction
4.3 WINDOWING
International Research Journal of Engineering and Technology (IRJET) e ISSN: 2395 0056 p ISSN: 2395 0072Volume: 09 Issue: 01 | Jan 2022 www.irjet.net 3.3 FEATURE EXTRACTION
To preserve consistency of signal, each of the subsequent frames is multiplied by a hamming window function. The window function is used to lessen this inconsistency. At the start and conclusion of the recording, a window is utilized to taper the voice sample to zero which reduces distortion of signal.. Y (n) = X (n) * W (n) W (n) is the hamming window function
H(z) = 1 −bz−1
Figure - 4: Waveforms of Pre Emphasized Signals
Figure-5: Waveforms After Windowing FAST FOURIER TRANSFORM (FFT): Frequencydomaintotimedomainconversionisreferredto as anFFT.Themagnitudefrequencyresponseofeachframe © 2021, IRJET | Impact Factor value: 7.529 | 9001:2008 5
4.3.1
CertifiedJournal | Page
FRAMING :

After building the model it need to be fit which is nothing but adjusting the weights using a trained dataset. Training the network demands the specification of data sets, which includes a matrix of input patterns X and an array of output patterns y. And our built model network is trained utilizing backpropagationapproachandoptimizedusingthe optimization technique and loss function provided when the model is built. This algorithm is trained on particular count of epochs. Here we are using 40 epochssize.
4.4.2 COMPILING NETWORK : After building network we have compile it. Compilation is a time saving process. It converts the basic layer sequence into a very optimized value set of matrix transformation .This transformation usually must be in a syntax that can be run on our CPU ,according on how configuration of keras is done. And certain parameters like optimizer and error functions are to be specified before compilation ofmodel.
4.3.3 DISCRETE COSINE TRANSFORM : Because of the smoothness of the vocal tract, the levels of energy of subsequent bands tend to be related. A set of cepstral coefficients is generated when the altered Mel frequency coefficients are applied to the DCT. The following is the formula for MFCC: Where c(n) are the cepstral coefficients, C is no of ceptral coefficients.
Page 591
LSTM model issequentialmodel and built usingkeras in python. There are few steps that need to be followed in order to develop thismodel.
Figure 8:Graph Of Extracted MFCC Coefficients.
4.4.5 PREDICTION : 7.529 | ISO 9001:2008 |
4.4.3FITTING NETWORK :
4.4.1 DEFINING NETWORK : Keras defines neural networks as a series of layers. The Sequential class serves as a framework for these levels of layers. First ever step is to build a Sequential instance of class. Then build stack of layers and arrange them in the sequence in which they should be interlinked. The LSTM recurrent neural layers made up of memory cells which are known as LSTM () cells. Dense layer is a fully connected layer that frequently precedesLSTMstackoflayersandisusedto produce a result.
4.4.4 EVALUATING NETWORK : The network need be evaluated once it has been trained. This evaluation is done on a separate set of training data. It helps in predicting the performance of built model and the metrics used in this model is accuracy ofprediction.
CertifiedJournal
After evaluating the performance of model we use it to make prediction of data. This is done by using a function called predict() . The output format will be same as specified by the output layer.
© 2021, IRJET | Impact Factor value:
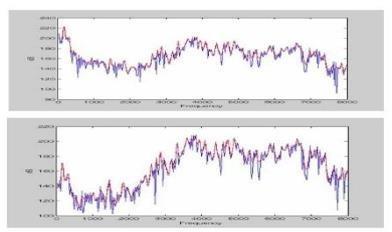
Figure 6: Fast Fourier Transform (FFT) 4.3.2 Mel-Scalefilterbank:Togenerateasmoothspectrum of magnitude, the frequency response of magnitude is multiplied by 20 triangular band pass filters. Additionally, the ranges of the features under analysis areminimized.
Figure 7: Mel scale filterbank energies
International Research Journal of Engineering and Technology (IRJET) e ISSN: 2395 0056 p ISSN: 2395 0072Volume: 09 Issue: 01 | Jan 2022 www.irjet.net isobtained using the FFT method.Aspectrum,alsoknownas a periodogram , is the outcome of FFT.
4.4 BUILDING THE MODEL

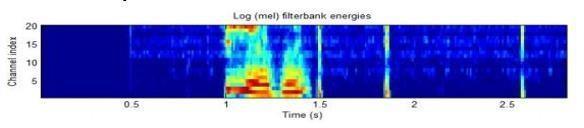
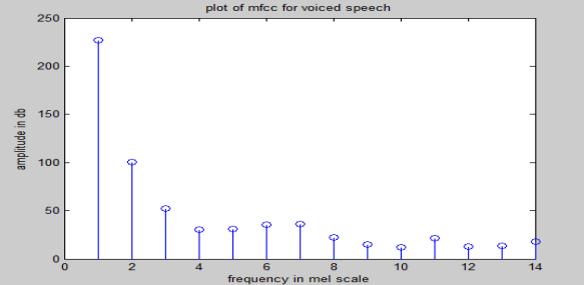
Figure 11:Graphs
© 2021,
| Impact Factor value: 7.529 | ISO 9001:2008 CertifiedJournal | Page 592
Figure 10: This the summary of the model which we have built representing all the layers 4.6 MODEL EVALUATION
International Research Journal of Engineering and Technology (IRJET) e ISSN: 2395 0056 p ISSN: 2395 0072Volume: 09 Issue: 01 | Jan 2022 www.irjet.net Figure-9: Architecture of LSTM used in the project 4.5 TRAINING THE MODEL
To train, we will use the fit() function on our model with the following parameters: training data (train_X), target data (train_y), validation data, and the number of epochs For our validation data, we will use the test set provided to us in our dataset, which we have split into X_test and y_test. The number of epochs is the number of times the model will cycle through the data. The more epochs we run, the more the model will improve, up to a certain point. After that point, the model will stop improving during each epoch. For our model, we will set the number of epochs to 25. Now we will train our model. To train, we will use the 'fit' function on our model with the following parameters: training data (train_X), target data (train_y), validation data, and the number of epochs. For our validation data, we will use the test set provided to us in our dataset, which we have split into X_ test and y_test.
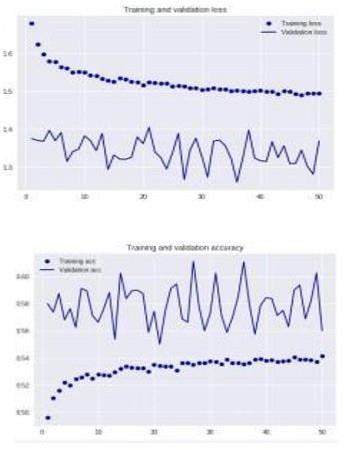
Evaluation of model is an essential step in the model creation procedure. It aids in determining the optimal model to characterize our data and how good our the selected model will perform in the upcoming future. To prevent the problem of overfitting the techniques analyze prediction accuracy using a test set. The goal of assessment is to predict the accuracy on future data. The graphs of Loss and Accuracy against epochs are shown below. 11:Graphs of the performance metrics of the performance metrics IRJET
Figure
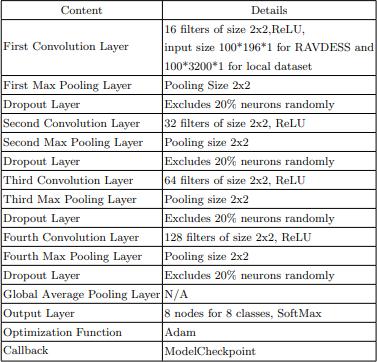
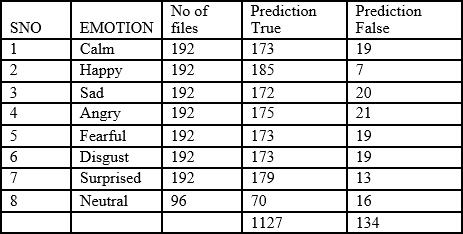
In this project we have used RAVDESS dataset depicted in the above table. After testing the model using this dataset we have obtained 78.2% accuracy in prediction of correct emotion.
[5] K. Simonyan and A. Zisserman, „„Very deep convolutional networks for large scale image recognition,‟‟ 2014, arXiv:1409.1556. [Online].
6. CONCLUSION We have achieved the main objective of the project that is to identify emotion of a person using recurrent neural networks with Long short term memory. In order to meet this requirement we are using a dataset of 1440 files that include emotions like calm , happy ,sad ,fear ,disgust ,surprise and neutral. The system is tested underLSTM
machine learning model. And machine learning models usually accept numeric values as input so we convert our data to arrays before they are used in extraction of features . The feature used in this model is MFCC and is extracted using librosa package. The extracted values are given as input to developed LSTM model which uses these features and give the final predicted emotion. The overall accuracy obtained in this model is 78.2%. Furthermore, the accuracy of model can be improved by clearing random silence from audio clip and adding more data volume by finding more annotated audioclips.
[4] J. Huang, B. Chen, B. Yao, and W. He, „„ECG arrhythmia classification using STFT based spectrogram and convolutional neural network,‟‟ IEEE Access, vol. 7, pp. 92871 92880,2019.
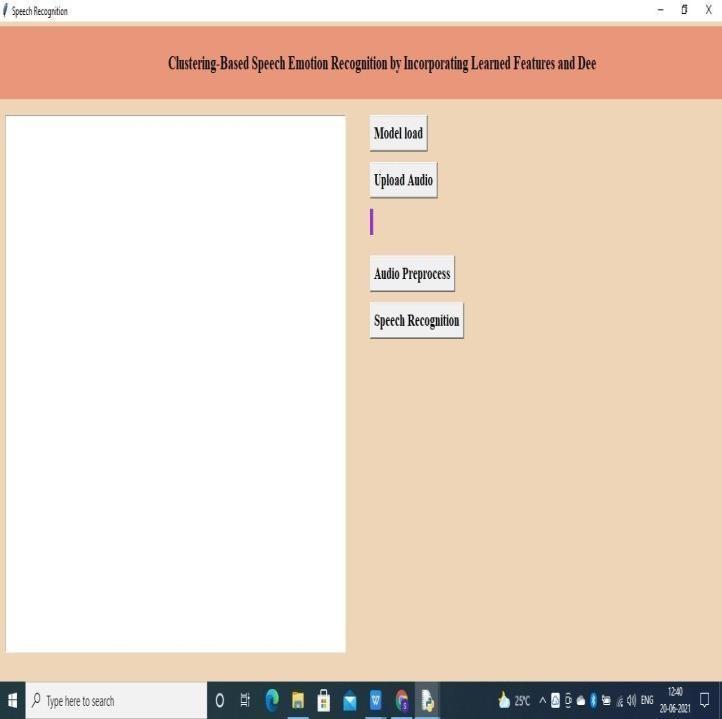
International Research Journal of Engineering and Technology (IRJET) e ISSN: 2395 0056 p ISSN: 2395 0072Volume: 09 Issue: 01 | Jan 2022 www.irjet.net 5. SIMULATIONFigure:RESULTS-12:
Results Table 3 : Tabular Form Of Predicted Outputs
7. FUTURE SCOPE
The model is further improved real time speaker detection system by implementing on digital signal processor. Sound systems can be designed to adapt to backgroundnoise levels. It canbe usedto developequipmentto help disabledpeople. This model can be used by various apps and online websites so that they can know the users emotions and incorporate new techniques to improve user experience to gain profits. This system can also be used in call centers for complaints and also in voice based virtual assistants orchatbox.
[1] B. Liu, H. Qin, Y. Gong, W. Ge, M. Xia, and L. Shi, „„EERA ASR: An energy efficient reconfigurable architecture for automatic speech recognition with hybrid DNN and approximate computing,‟‟ IEEE Access, vol. 6, pp. 52227 52237, 2018. [2] N.Cummins,S.Amiriparian, G.Hagerer,A.Batliner, S. Steidl, and B. W. Schuller, „„Animage based deepspectrum feature representation for the recognition of emotional speech,‟‟inProc.25thACMMultimediaConf.(MM),2017,pp. 478 484. [3] Mustaqeemand S. Kwon, „„A CNN assistedenhanced audio signal processing for speech emotion recognition,‟‟ Sensors, vol. 20, no. 1, p. 183, 2020.
[6] T. Hussain, K. Muhammad, A. Ullah, Z. Cao, S. W. Baik,andV.H.C.deAlbuquerque, „„Cloud assistedmultiview video summarization using CNN and bidirectional LSTM,‟‟ IEEETrans.Ind.Informat.,vol.16,no.1,pp.77 86,Jan.2020 © 2021, IRJET | Impact Factor value: 7.529 | ISO 9001:2008 CertifiedJournal | Page 593
REFERENCES
International Research Journal of Engineering and Technology (IRJET) e ISSN: 2395 0056 p ISSN: 2395 0072Volume: 09 Issue: 01 | Jan 2022 www.irjet.net [7] R. A. Khalil, E. Jones, M. I. Babar, T. Jan, M. H. Zafar, and T. Alhussain, „„Speech emotion recognition using deep learning techniques. [8] A. M. Badshah, N. Rahim, N. Ullah, J. Ahmad, K. Muhammad, M. Y. Lee, S. Kwon, and S. W. Baik, „„Deep features based speech emotion recognition for smart affective services,‟‟ Multimedia Tools Appl., vol. 78, no. 5, pp. 5571 5589, Mar. 2019. [9] S. U. Khan, I. U. Haq, S. Rho, S. W. Baik, and M. Y. Lee, „„Cover the violence: A novel Deep Learning Based approach towards violencedetection in movies,‟‟ Appl. Sci., vol. 9, no. 22, Acknowledgement: I am thankful to the authorities of Vasavi college of Engineering for allowing me to use resources for the completion of this paper. © 2021, IRJET | Impact Factor value: 7.529 | ISO 9001:2008 CertifiedJournal | Page 594