International Research Journal of Engineering and Technology (IRJET)
e-ISSN: 2395-0056
Volume: 08 Issue: 06 | June 2021
p-ISSN: 2395-0072
www.irjet.net
Application of GIS in Investigating the Influence of Rainfall-Runoff on Landslides Lavan Kumar B1, Sushanth S Gowda2, Manikanta M V3, Mohammed Zaumam Ur Rehman4 1-4Under
Graduate Students, Department of Civil Engineering, PES University, Karnataka, India ---------------------------------------------------------------------***----------------------------------------------------------------------
Abstract -Water cycle involves many different processes
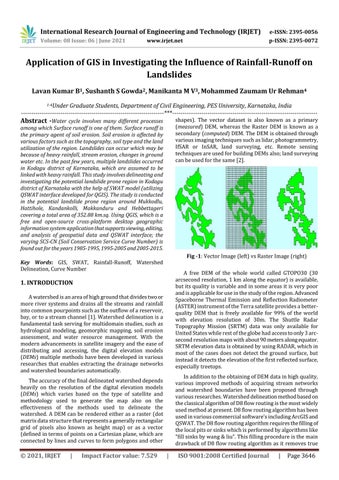
shapes). The vector dataset is also known as a primary (measured) DEM, whereas the Raster DEM is known as a secondary (computed) DEM. The DEM is obtained through various imaging techniques such as lidar, photogrammetry, IfSAR or InSAR, land surveying, etc. Remote sensing techniques are used for building DEMs also; land surveying can be used for the same [2].
among which Surface runoff is one of them. Surface runoff is the primary agent of soil erosion. Soil erosion is affected by various factors such as the topography, soil type and the land utilization of the region. Landslides can occur which may be because of heavy rainfall, stream erosion, changes in ground water etc. In the past few years, multiple landslides occurred in Kodagu district of Karnataka, which are assumed to be linked with heavy rainfall. This study involves delineating and investigating the potential landslide prone region in Kodagu district of Karnataka with the help of SWAT model (utilizing QSWAT interface developed for QGIS). The study is conducted in the potential landslide prone region around Mukkodlu, Hattihole, Kandankolli, Makkanduru and Hebbettageri covering a total area of 352.88 km.sq. Using QGIS, which is a free and open-source cross-platform desktop geographic information system application that supports viewing, editing, and analysis of geospatial data and QSWAT interface; the varying SCS-CN (Soil Conservation Service Curve Number) is found out for the years 1985-1995, 1995-2005 and 2005-2015.
Fig -1: Vector Image (left) vs Raster Image (right)
Key Words: GIS, SWAT, Rainfall-Runoff, Watershed Delineation, Curve Number
A free DEM of the whole world called GTOPO30 (30 arcsecond resolution, 1 km along the equator) is available, but its quality is variable and in some areas it is very poor and is applicable for use in the study of the region. Advanced Spaceborne Thermal Emission and Reflection Radiometer (ASTER) instrument of the Terra satellite provides a betterquality DEM that is freely available for 99% of the world with elevation resolution of 30m. The Shuttle Radar Topography Mission (SRTM) data was only available for United States while rest of the globe had access to only 3 arcsecond resolution maps with about 90 meters along equator. SRTM elevation data is obtained by using RADAR, which in most of the cases does not detect the ground surface, but instead it detects the elevation of the first reflected surface, especially treetops.
1. INTRODUCTION A watershed is an area of high ground that divides two or more river systems and drains all the streams and rainfall into common pourpoints such as the outflow of a reservoir, bay, or to a stream channel [1]. Watershed delineation is a fundamental task serving for multidomain studies, such as hydrological modeling, geomorphic mapping, soil erosion assessment, and water resource management. With the modern advancements in satellite imagery and the ease of distributing and accessing, the digital elevation models (DEMs) multiple methods have been developed in various researches that enables extracting the drainage networks and watershed boundaries automatically.
In addition to the obtaining of DEM data in high quality, various improved methods of acquiring stream networks and watershed boundaries have been proposed through various researches. Watershed delineation method based on the classical algorithm of D8 flow routing is the most widely used method at present. D8 flow routing algorithm has been used in various commercial software’s including ArcGIS and QSWAT. The D8 flow routing algorithm requires the filling of the local pits or sinks which is performed by algorithms like “fill sinks by wang & liu”. This filling procedure is the main drawback of D8 flow routing algorithm as it removes true
The accuracy of the final delineated watershed depends heavily on the resolution of the digital elevation models (DEMs) which varies based on the type of satellite and methodology used to generate the map also on the effectiveness of the methods used to delineate the watershed. A DEM can be rendered either as a raster (dot matrix data structure that represents a generally rectangular grid of pixels also known as height map) or as a vector (defined in terms of points on a Cartesian plane, which are connected by lines and curves to form polygons and other
© 2021, IRJET
|
Impact Factor value: 7.529
|
ISO 9001:2008 Certified Journal
|
Page 3646