1 minute read
Total Hardness (as CaCO3) 300 600


Volume: 08 Issue: 06 | June 2021 www.irjet.net p-ISSN: 2395-0072
4.2 WATER QUALITY INDEX
Advertisement
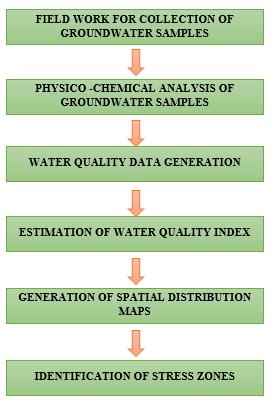
Figure 3 FLOW CHART OF METHODOLOGY
Water quality index is probably the best procedure for giving water quality information to concerned inhabitants and technique makers. It propels into a critical limit for groundwater examination and the board. The water quality list summarizes colossal measures of water quality information in essential terms, for instance phenomenal, great, awful, etc.
Three steps are followed to figure WQI. In the underlying advance, a weight (wi) was designated to all of the parameters subject to their overall importance in overall nature of drinking water (Table 2). The parameter nitrate was assigned the most outrageous heap of 5 due to its critical importance in the assessment of water quality
In the second step the relative weight (Wi) is determined from the condition as follows:
Wi = wi/Σwi
Where, Wi is relative weight, wi is every parameter's weight and n is number of parameters
Table 2 likewise gives determined relative weight (Wi) values for every parameter.
In third step,quality rating scale (qi) for every parameter is relegated by separating its focus by its individual standard in water test as per the rules set down in the BIS and the and the outcome increased by 100:
qi = (Ci/Si) x 100
Where, qi is the quality ranking, Ci denotes the concentration of respective water quality parameter of each water sample in mg/l, and Si denotes Indian drinking water level in mg/l for the parameters in accordance to the BIS 10500 :2012 guidelines. The SI is calculated for the computation of WQI for the water quality parameters, according to the equation
SIi = Wiqi WQI = ∑ SIi
where, SIi is the subindex of the ith parameter,qi= concentration-based rating of ith parameter