15 minute read
Figure 6 Mixing of concrete

International Research Journal of Engineering and Technology (IRJET) e-ISSN: 2395-0056 Volume: 07 Issue: 09 | Sep 2020 www.irjet.net p-ISSN: 2395-0072
Table 6 Details of Mix proportions (Kg/m3)
Advertisement
10
Constituent
Cement Water Fine aggregate 20mm 12.5mm Metakaolin S.P. Slump (mm) Plastic
MK 0
533.33 160 677
602 599 0 2.13 130 2520
MK 5
506.67 160 666
593 589 26.67 2.93 110 2477
MK
Density
480.0 160 655
583 580 53.33 3.47 110 2446
MK 15
453.33 160 645
574 570 80.0 4.26 100 2421
Conducted to determine the optimum dosage of SP for each of the mixtures in order to achieve the target slump of 100 ± 25 mm. The dosage of SP for each mixture was carefully selected as over dosage may induce bleeding and strength retardation. Table: 6 presents the mixture proportions for all of the mixture series with different dosage of SP for a target slump of 100 ± 25 mm. With respect to the aggregate grading, in the present investigation a combined aggregate grading as recommended by the DIN 1045 standards was utilized. The aggregates 20, 12.5 and 4.75 mm were combined in such a way, so that it meets nearly the combined grading specification of DIN ‘A’ curve. The percentage fractions of aggregates used for 20, 12.5 and 4.75 mm are 31, 32 and 37 of the total aggregate content. Blending aggregates in this fashion and designing concretes at very low water binder ratios will yield high strength concretes, because of the good packing density (Dinakar 2012).
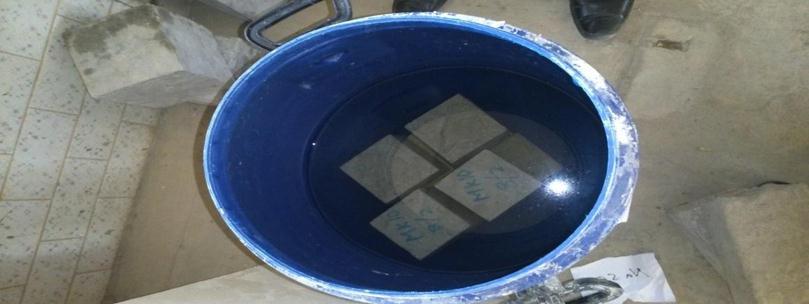
3.0 Mixing and Casting Details:
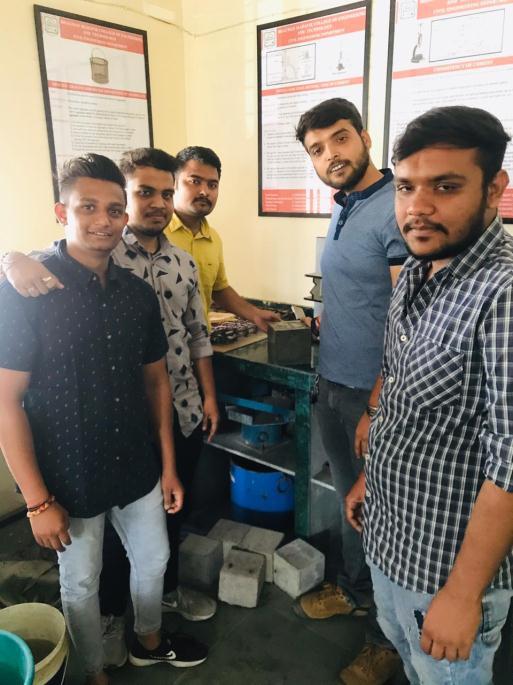
All the materials were mixed using a pan mixer with a maximum capacity of 80 liters. The materials were fed into the mixer in the order of coarse aggregate, cement, MK and sand. The materials were mixed dry for 1.5 min. Subsequently three-quarters of the water was added, followed by the SP and the remaining water while mixing continued for a further 5 min in order to obtain a homogenous mixture. Upon discharging from the mixer, the slump test was conducted on the fresh properties for each mixture. The fresh concrete was placed into the steel cube molds and compacted on a vibrating table. Finally, surface finishing was done carefully to obtain a uniform smooth surface. Figure 6 Mixing of concrete
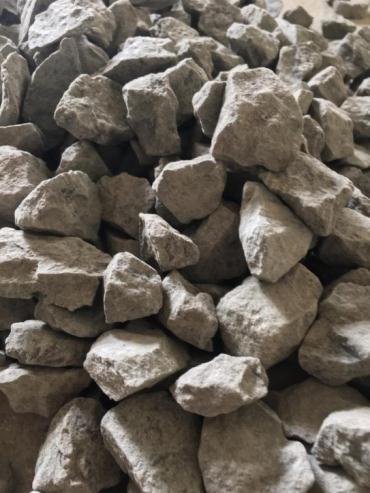
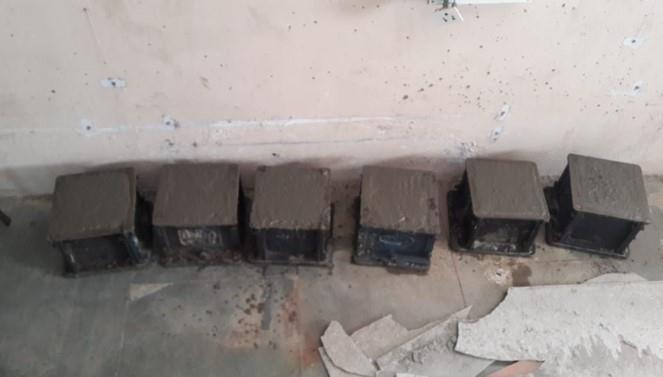
4.0 Specimens and Curing
The following specimens were cast from each mixture: •100 x 100 x 100 mm cubes were cast in iron molds.
All the specimens were cast on mechanical vibration table. After casting, all the specimens were covered with plastic sheets and water saturated burlap, and left at room temperature for 24 h. The specimens were demolded after 24 h of casting and were then cured in water at approximately 27 ºC until the testing day.
International Research Journal of Engineering and Technology (IRJET) e-ISSN: 2395-0056 Volume: 07 Issue: 09 | Sep 2020 www.irjet.net p-ISSN: 2395-0072
Figure 7 Casted Cubes
5.0 Test Results 5.1 Fresh Properties 5.1.1 Plastic Density
The results of the plastic densities with respect to the corresponding MK percentages are given in Table 6. From this it can be seen that the plastic densities varied between 2,421 and 2,520 kg/m3. The slight reduction in the densities of MK concretes was due to the lower specific gravity of MK compared to cement alone.
5.1.2 SP Demand
In this study, different SP dosages were added to the different mixtures in order to obtain the consistency or workability in terms of target slump of 100 ± 25 mm. It can be seen from Table 6, the SP demand increased with increase in the metakaolin replacements. For example, the 15%, 10% and 5 % MK mixtures require 100, 62.5 and 37.5 % more SP dosage in comparison with that of the control mixture. This was mainly because of the higher specific surface area of MK in comparison with the cement alone. Another reason, cited by Nehdi et al. (1998), is that the Van der Waals, which are the main causes for cement particles agglomeration and electrostatic attraction between cement and pozzolan particles becomes dominant due to the increase in the wet able surface area. Therefore, as the percentage replacement increases flocculation becomes more predominant. In the presence of a dispersant such as SP on the surface of cement grains, particles repulse each other because of the dispersion of agglomerated cement particles and remain separate thus delivering the required workability (Nehdi et al. 1998). The relationship between SP dosage with respect to the percentage of total dry weight of binder content is shown in Fig. 5. It can be seen from the figure, that the equation is linear in the form (y = mx + c), where the coefficients of m and c are strictly governed by MK content and w/b ratio. It should be noted that this equation only apply to cement content in the range453–533 kg/m3 for a slump within 100 ± 25 mm and chosen constituent materials and for w/b ratio
of 0.30. The proposed best fit linear equation is as follows:
Superplasticizer demand Vs
Metakaolin (%)
© 2020,
Figure 8 Superplasticizer demand Vs Metakaolin percentage
SP (%) = 0.405 + 0.026 (MK %), R2 = 0.99……….. (1)
As far as the workability is concerned, in fact all the concretes the control and the MK mixtures have obtained their design slumps as shown in Table 6. According to these results, concretes obtained had high slump values, highly cohesive and can be easily pump-able. No wide variations in the slump values for the mixtures containing increased amounts of MK were observed.
International Research Journal of Engineering and Technology (IRJET) e-ISSN: 2395-0056 Volume: 07 Issue: 09 | Sep 2020 www.irjet.net p-ISSN: 2395-0072
Table 7 Mechanical properties of concrete
Nam e
MK 0
MK 5
MK 10 MK 15
Compressive Strength age (days) MPa
3 days 56.4
59.4 5 53.9 6 48.9 3 7 days 78.2 3 78.7 4 77.8 5 79.8 8 28 days 91.8 7 95.6 0 98.8 1 91.0 4 90 days 101.0 0 102.5 0 106.1 3 102.9 6
Split ting ten. str. (MP a)
28 days 4.76
4.78
5.19
4.69
Elasti c modu lus (GPa)
28 days 45.43
46.57
47.16
45.42
Flexur al Streng th (MPa)
28 days 6.3
6.6
7.0
6.8
5.2 Mechanical Properties
5.2.1 Slump Cone Test:
Sampling of Materials for Slump Test:
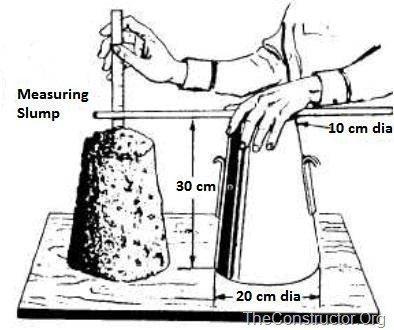
A concrete mix (M30) by weight with suitable water/ cement ratio is prepaid in the laboratory similar to that explained and required for casting 6 cubes after conducting Slump test. Figure 9 Measuring Slump of Concrete
Procedure for Concrete Slump Cone Test:
Clean the internal surface of the mouldand apply oil. Place the mould on a smooth horizontal non- porous base plate. Fill the mould with the prepared concrete mix in 4 approximately equal layers. Tamp each layer with 25 strokes of the rounded end of the tamping rod in a uniform manner over thecross section of the mould. For the subsequent layers, the tamping should penetrate into the underlying layer. Remove the excess concrete and level the surface with a trowel.
Clean away the mortar or water leaked out between the mould and the base plate.
Raise the mould from the concrete immediately and slowly in vertical direction.
Measure the slump as the difference between the height of the mould and that of height point of the specimen being tested.
Slump Value Observation:
The slump (Vertical settlement) measured shall be recorded in terms of millimetres of subsidence of the specimen during the test.
Results of Slump Test on Concrete
Slump for the given sample is mentioned below.
When the slump test is carried out, following are the shape
of the concrete slump that can be observed:
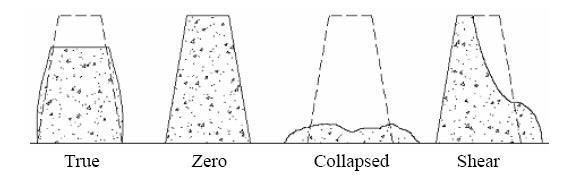
Figure 10 TypesofConcreteSlumpTestResults
True Slump –True slump is the only slump that can be measured in the test. The measurement is taken between the top of the cone and the top of the concrete after the cone has been removed as shown in figure-1. Zero Slump –Zero slump is the indication of very low water-cement ratio, which results in dry mixes. These type of concrete is generally used for road construction. Collapsed Slump –This is an indication that the watercement ratio is too high, i.e. concrete mix is too wet or it is a high workability mix, for which a slump test is not appropriate. Shear Slump –The shear slump indicates that the result is incomplete, and concrete to be retested.
The workability of the fresh concrete is measured by using the standard slump test apparatus. The unconfined compressive strength was obtained, at a loading rate of 2.5 kN/s at the age of, 3, 7, 28 and 90 days on 3,000 kN machine. The average compressive strength of three specimens was
International Research Journal of Engineering and Technology (IRJET) e-ISSN: 2395-0056 Volume: 07 Issue: 09 | Sep 2020 www.irjet.net p-ISSN: 2395-0072
considered for each age. The split tensile strength was also tested on the same machine at the age of 28 days.
5.2.2 Compressive Strength :
The compressive strength results of samples presented in Table 7, shows that all the concretes made in this study are high strength, as even the seven day compressive strength varied between 78 and 80 MPa. The 28-day strength varied between 91 and about 99 MPa, and the 90-day strength varied between 101 and 106 MPa. The 15 % replacement MK mixture had exhibited lower strengths comparatively than the other MK percentages, but comparable strengths at all the ages to that of control concrete. All the concretes including the control had achieved their target strength of 90 MPa at 28 day and at 90 days all the concretes achieved strengths of more than 100 MPa. Figure 11 presents the relation between compressive strength and MK percentages at 28 and 90 days. It can be seen that the compressive strength was the highest for the MK10 mixtures achieving strengths of 102.5 and 106 MPa at 28 and 90 days. This clearly shows that the replacement level of 10 % was the optimum as far as the compressive strength is concerned. This is slightly less than the replacement level of 15 % reported in a previous study for the same water/binder ratio of 0.30 (Khatib 2008). The reduction in compressive strength for MK15 compared to MK10 is explained as the result of a clinker dilution effect. The dilution effect is a result of replacing a part of cement by the equivalent quantity of MK. In MK concrete, the filler effect, pozzolanic reaction of MK with calcium hydroxide and compounding effect (synergetic effect of mineral admixture) react opposite of the dilution effects (Parande et al. 2008; Ding et al. 1999). For this very reason, there was an optimum MK replacement for MK concrete. With time, the compressive strength differences between the MK mixtures and OPC concrete becomes smaller. This might be due to the fact that all cementitious materials reactions were close to completion, or had stopped; mainly because the reactions between MK and OPC mixtures were slowed down with time (Wild and Khatib 1997). Figure 11 Variation of compressive strength with respect to metakaolin percentage
5.2.3 Splitting Tensile Strength :
The tensile strength results of MK concretes with varying amounts of MK are shown in Table 7. The average value of the 28-day tensile strength for the concretes made was about 4.85 MPa, which corresponds to 5.15 % of the compressive strength for the same concretes. Table 7 shows that the average ratio between the tensile strength (fsp) to cube compressive strength (fck) of concrete at 28 days was lower than the range (of about 9–10 %) for medium strength concrete reported earlier (Neville 1997; Rasiah 1983; Haque and Kayali 1998). This indicates that as the compressive strength increases lower would be the ratio, which is consistent with the results published by other investigators earlier (Rasiah 1983; Haque and Kayali 1998; Yogendran et al. 1987). From the results it can be seen that similar to compressive strength the splitting tensile strength also exhibited the highest strength at MK 10 mixture. Figure 12 presents the relation between compressive strength and splitting tensile strength of all the mixtures at 28 days. It can be observed that as the compressive strength increases, the tensile strength also increases. The relationship between compressive strength (fck) and split tensile strength (fsp) can be expressed as below (from Fig. 12).
fSP = 0.0357(fck)1.08014 R2 = 0.94 …….(2)
International Research Journal of Engineering and Technology (IRJET) e-ISSN: 2395-0056 Volume: 07 Issue: 09 | Sep 2020 www.irjet.net p-ISSN: 2395-0072
Figure 12 Variation of compressive strength with respect to splitting tensile strength
5.2.4 Elastic Modulus
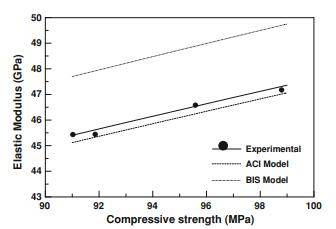
The modulus of elasticity is mainly related to the compressive strength of concrete. However, due to the existence of non-linear relationship between them (Neville 1997; Mehta and Monteiro 1999), the increase in the modulus of elasticity is not in proportion to the increase in compressive strength as noted in Table 7. The modulus values presented in Table 7 indicate that the rate of increase in the modulus is lower than the rate of increase in the compressive strength. The elastic modulus (E) values with respect to the MK contents are presented in Table 7. The trend is similar to that obtained for compressive strength; here the optimum MK percentage that gives maximum E is at 10 %. The strength (fck) is correlated with E as shown in Fig. 13. A direct linear, power and an exponential relationship were attempted and it was found that the power relationship in the form given below fitted the data best
E = 4.76 ck R2 = 0.98 ………. (3)
In addition, the predicted values according to the American Concrete Institute (ACI) model (E = 4.73 ck) and BIS
model (E = 5
ck) are also plotted in the same Fig. 13. The figure shows that the data points of MK mixtures lie slightly above the predicted modulus of ACI model but the BIS model overestimates the values obtained by actual testing Figure 13 Variation of compressive strength with respect to elastic modulus
5.2.5 Flexural Strength
The Flexural strength compared to control specimen with various percentages of Metakaolin. When compared to control specimen the Flexural strength for MK5% increases 4.76%. The Flexural strength for MK 10%, 15% increases respectively and decreases with higher concentration of Metakaolin. The Flexural strength test values are presents in Table 7.
Figure 14 Flexural Strength
Figure 15 Variation of Flexural Strength
International Research Journal of Engineering and Technology (IRJET) e-ISSN: 2395-0056 Volume: 07 Issue: 09 | Sep 2020 www.irjet.net p-ISSN: 2395-0072
6. CONCLUSIONS
The following conclusion can be drawn from the current study.
(a) Using MK as a partial replacement for cement decreased the plastic density of the mixtures. (b) The results shows that by utilizing local MK and cement designed for a low water/binder ratio of 0.3, high strength and high performance concretes can be developed and compressive strengths of more than 100 MPa can be realized. (c) The optimum replacement level of OPC by MK was 10 %, which gave the highest compressive strength in comparison to that of other replacement levels; this was due to the dilution effect of partial cement replacement. These concretes also exhibited a 28-day splitting tensile strength of the order of 5.15 % of their compressive strength and showed relatively high values of modulus of elasticity. Splitting tensile strengths and elastic modulus results have also followed the same trend to that of compressive strength results showing the highest values at 10 % replacement.
ACKNOWLEDGEMENT
We are glad to express our gratitude towards civil engineering department, Bhagwan Mahavir College of engineering and technology, Surat for gave us an opportunity to develop the project. Then our humble thanks to all professors and all staff members of our college for the co- operation and keep interest extended by them throughout our B.E course.
We are thankful to our project guide, Dr. Kamal Padhiar (Head of Civil Department), who inspires us to undertake this Project. His guidance and continuous interest kept us going in spite of all the difficulties throughout the project.
We deeply owe our gratitude to our faculties for their kind help, support and encouragement throughout this project.
We are thankful to all the staff member of civil department for their kind support at various stages of the work.
We are thankful to each and every group member who participated in this work to complete the project.
REFERENCES
[1] Abbas, R., Abo-El-Enein, S. A., & Ezzat, E. S. (2010). Properties and durability of metakaolin blended cements: Mortar and concrete. Materiales De Construccion, 60, 33–49.
[2] Abdul, R. H., & Wong, H. S. (2005). Strength estimation model for high-strength concrete incorporating metakaolin and silica fume. Cement Concrete Research, 35(4), 688–695. [3] Badogiannis, E., & Tsivilis, S. (2009). Exploitation of poor Greek kaolins: Durability of metakaolin concrete. Cement & Concrete Composites, 31(2), 128–133.
[4] Bai, J., Wild, S., & Sabir, B. B. (2002). Sorptivity and strength of air cured and water cured PC-PFA-MK concrete and the influence of binder composition on carbonation depth. Cement and Concrete Research, 32(11), 1813–1821.
[5] Basu, P. C. (2003). High performance concrete. In Proceedings INAE national seminar on engineered building materials and their performance (pp. 426–450).
[6] Basu, P. C., Mavinkurve, S., Bhattacharjee, K. N., Deshpande, Y., & Basu, S. (2000). High reactivity metakaolin: A supplementary cementitious material. In Proceedings ICIAsian conference on ecstasy in concrete, 20–22 Nov, Bangalore, India (pp. 237–436).
[7] Boddy, A., Hooton, R. D., & Gruber, K. A. (2001). Longterm testing of the chloride-penetration resistance of concrete containing high-reactivity metakaolin. Cement and Concrete Research, 31, 759–765.
[8] CEB-FIP. (1989). Diagnosis and assessment of concrete structures-state of the art report. CEB Bulletin, 192, 83–85.
[9] Dhir, R. K., & Yap, A. W. F. (1984). Superplasticized flowing concrete: durability. Magazine of Concrete Research, 36(127), 99–111.
[10] DIN 1045. (1988). Beton und Stahlbeton. Koln, Germany: Beton Verlag GMBH.
[11] Dinakar, P. (2012). Design of self compacting concrete with fly ash. Magazine of Concrete Research, 64(5), 401–409.
[12] Ding, Z., Zhang, D., & Yu, R. (1999). High strength composite cement. China Building & Material Science Technology, 1, 14–17.
[13] Dvorkin, L., Bezusyak, A., Lushnikova, N., & Ribakov, Y. (2012). Using mathematical modelling for design of self compacting high strength concrete with metakaolin admixture. Construction and Building Materials, 37, 851–864.
[14] Gruber, K. A., Ramlochan, T., Boddy, A., Hooton, R. D., & Thomas, M. D. A. (2001). Increasing concrete durability with high-reactivity metakaolin. Cement & Concrete Composites, 23, 479–484.
[15] Guneyisi, E., Gesoglu, M., & Mermerdas, K. (2008). Improving strength, drying shrinkage, and pore structure of concrete using metakaolin. Materials and Structures, 41, 937–949.