19 minute read
DMAIC


Volume: 07 Issue: 09 | Sep 2020 www.irjet.net p-ISSN: 2395-0072
Analyze: This phase helps in determining the root causes which led to the occurrence of variation and poor performance.
Advertisement
Improve: The improve stage addresses the causes identified and analyze phase and works towards improving them.
Control: To avoid a similar problem in the future we implement the control phase.
Fig -1: The DMAIC Methodology
However, itshould be noted that DMAIC is not unique to Six Sigma and can be used for other improvement applications as well.
With the help of this paper, an attempt was made to explore how the DMAIC methodology combined with Six Sigma tools can be applied to the oil crisis of 2020, taking into consideration the different causes which acted as precursors to this crisis, the impact that the crisis had, and what does the scenario look like as we near the end of the first half of 2020. With the help of the Six Sigma methodology DMAIC and its supplementary tools, the paper attempts to find out the primary causes which led to this crisis and how the different oil-producing nations are working towards solving this problem and what steps should be taken in the future to avoid such a crisis.
4. LITERATURE REVIEW
The oil crisis of 2020 came as a shock to the whole world. Although the glut in oil supply was predicted, the influence that it would have was unfathomable. To understand the oil crisis a brief on the oil industry is necessary -the early oil production, the key players, the challenges, and the booms and busts [1]. Hamilton, J.D. Explained the behavior of oil prices and the features of petroleum demand and supply [2]. The three sectors of oil industry (Upstream, middle stream and Downstream) and exploration and production in global oil industry were studied [3]. John, Emmanuel gave an understanding of OPEC (Organization of Petroleum Exporting Countries - the cartel of oil industry), since its foundation and its framework for operation [4]. Crude oil is a commodity which is produced all around the globe, and thus to categorize it into different baskets for the ease of trade different benchmarks were identified. Harraz, Hassan explained the difference between differentbenchmarks of oil and their importance in global crude oil market [5]. Data is an integral part in the process of research as it is the guiding beacon in the process, a regulated and accurate data was provided by the International Energy Agency’s Oil Market Report (OMR). OMR delivered a comprehensive and authoritative analysis on the global oil market with detailed statistics on oil supply, demand, prices, inventories and refining activity [6]. Jodi Oil World Database provided a compiled dedicated chart book of timely information on oil inventory data [7]. Kolochi, Prabu et al reported the impact and implementation of DMAIC phases of Six Sigma through a case study [10]. The International Energy Agency (IEA) released a report titled which made clear the role of coronavirus in the crisis [11]. Furthermore, the April and May reports released by the IEA were referred and emphasized the measures taken by the oil producing countries to tackle the crisis [12] [13]. To implement each phase of DMAIC process, understanding the impacts of crisis in general on consumers is indispensable [14]. A crisis of such an extent has affected the industry [15] to the core. A right partition between the general perception and which economies were actually affected by the crisis is resolved [16]. With all these resources the DMAIC methodology has been applied to the oil crisis of 2020.
5. METHODOLOGY
5.1 Define
Every oil crisis that has taken place till date can be traced back to three root causes [18], and these are: o Decrease inDemand o Increase in Supply o The monopoly power of oil producers falls In the case of the oil crisis of 2020, all three factors listed above acted as precursors provided below:
Volume: 07 Issue: 09 | Sep 2020 www.irjet.net p-ISSN: 2395-0072
⮚During November of 2019, there was an outbreak of the coronavirus in China. By the end of the First Quarter of 2020, the coronavirus epidemic had turned into a pandemic. With the spread of the virus, many countries started imposing lockdown, thus preventing people from going outside their homes, except for getting essential supplies.China which is the largest importer of oil was one of the first countries to impose a lockdown, this resulted in closed factories and reduced transport services. All these factors together caused a ‘Decrease in Demand’. ⮚To tackle the decrease in demand, an ideal solution would have been to reduce supply. However, in reality, the U.S, Saudi, and Russian oil producers continued pumping oil at the same rate. This caused an ‘Increase in Supply’, with no available space to store this excess oil. ⮚ A price war between Russia and Saudi Arabia further aggrandized the issue. This resulted in the ‘Monopoly of oil producers to fall’. All these factors combined caused one of the biggest oil crises, whose impacts will be felt throughout 2020.
5.2 Measure
Country % of Global Production
Russia 15
Saudi Arabia 12
USA China Iran Venezuela 8 6 5 4
Mexico Iraq Nigeria Kuwait United Arab Emirates Norway Brazil Canada Angola Libya 4 4 4 3
3 3 3 3 3 2
Cumulative %
15 27 35 41 46 50 54 58 62 65
68 71 74 77 80 82
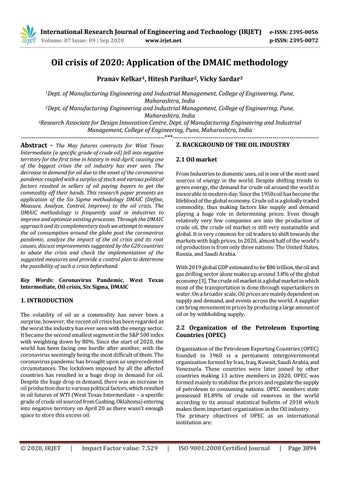
The purpose of this phase is to measure the process performance which can be achieved in the following ways o Find out the major oil producers over the past decade using the Pareto analysis [Chart1]. o Compare the crude oil consumption before and after the first quarter of 2020 using graphical analysis. Pareto analysis of oil production by country for the years 2010 & 2020 Analysis of Oil producing countries around the world for 2010 shows 16 countries contributed towards 80% of production including major contributors Russia, Saudi Arabia, and U.S.
Chart -1: Pareto chart of oil production by country (Jan 2010) Table -1: List of countries by oil production (January, 2010)
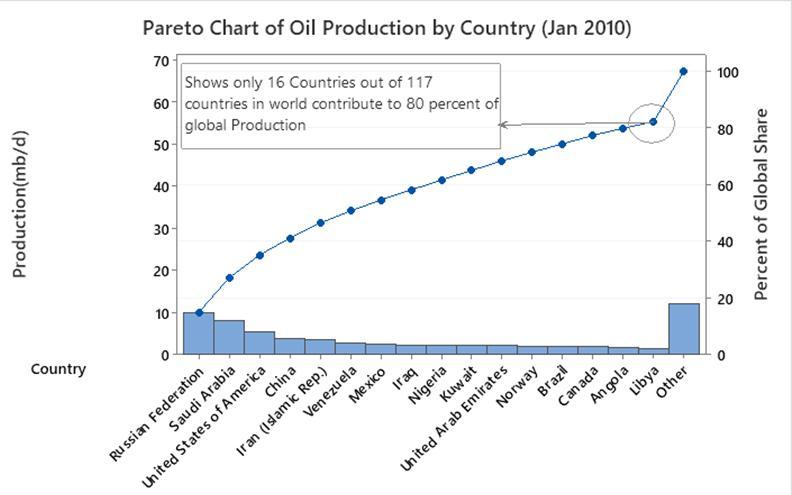
In the past decade, the United States surpassed Russia and Saudi Arabia to become the world's largest crude oil producer. U.S. crude oil production exceeded that of Saudi Arabia for the first time in more than two decades. According to analysis, it shows the United States, Russia, and Saudi Arabia cumulatively produce 48.9% of the world’s crude oil production. This shows how large these three nations can influence the global crude oil market.
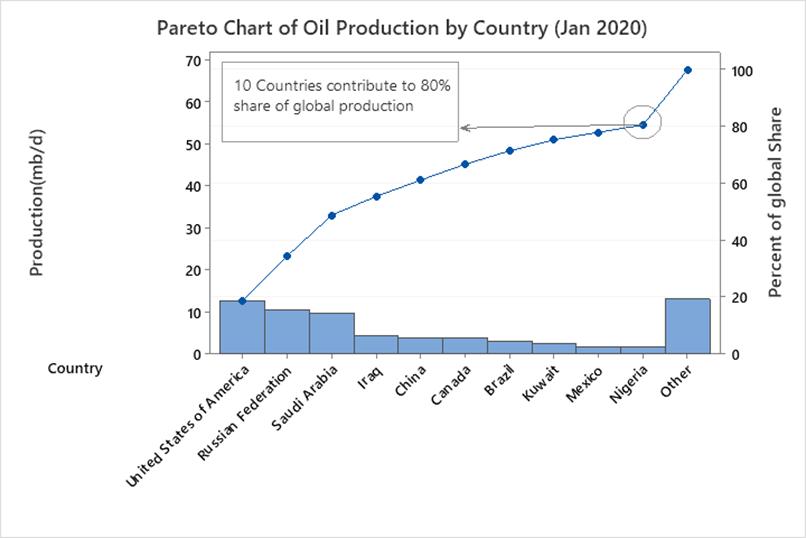
Chart -2: Pareto chart of oil production by country (Jan 2020)
Table -2: List of countries by oil production (January, 2020)
Country % of Global Production Cumulative %
USA 18.8 18.8 Russia 15.7 34.5 Saudi Arabia 14.4 48.9 (First 3 countries produce almost half of
Volume: 07 Issue: 09 | Sep 2020 www.irjet.net p-ISSN: 2395-0072
world share)
Iraq 6.6 55.5 China 5.7 61.2 Canada 5.6 66.8 Brazil 4.7 71.5 Kuwait 3.9 75.4 Mexico 2.6 78 Nigeria 2.6 80.6
5.2.1 Graphical analysis for comparison of crude oil consumption before and after the first quarter of 2020.
Global oil demand declined as the pandemic made people around the world stay indoors and avoid unnecessary travel. Around 3rd and half of the population were under lockdown which drastically reduced crude oil consumption.
Chart -3: Global crude oil consumption and annual change
According to the report from IEA global oil consumption for the year 2019 was 100.2 mb/d which declined to 96.7 mb/d in March 2020, a fall of 3.5 mb/d for the first time since 2009[6].
5.3 Analyze
The ‘measure’ phase, gives an overview of the changes that occurred between the first and second quarter of 2020 with regards to oil consumption and production. The analyze phase will serve the purpose of finding out the root causes, using the Fishbone diagram [Fig -2].
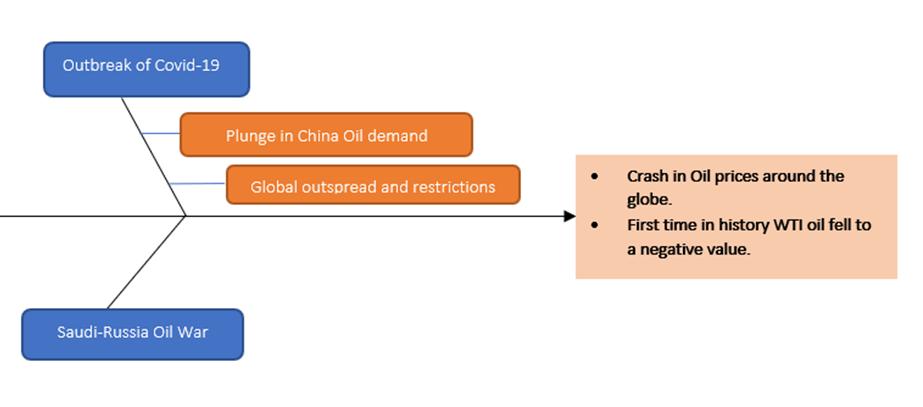
Fig -2: Root cause analysis
5.3.1 Impacts
The oil industry in the past decade or two has vastly proliferated in the United States, a drop in oil prices 10 or 20 years ago would have actually benefitted the economy as it would have reduced energy cost. But the oil industry today employs close to 10 million people either directly or indirectly and the oil crisis is going to have a resounding effect on industries other than oil such as manufacturers of pipelines, or oil drilling equipment [23] .
Table -3: Impact Overview
SR. NO.
1
Who was affected? What were the effects?
People employed in oil and its auxiliary sectors. The data from Bureau of Labor Statistics (BLS), revealed that 84,098 people have already lost their jobs in the oilfield equipment and service sector until the end of May [22] . Close to 1 million people employed in the oilfield services will be left jobless by the end of the year, which represents roughly a 21% reduction in the global oilfield equipment and service industry (OFS). 13% of the projected job cuts will be due to the drop in oil prices while the remaining 8% will be more directly linked to the novel coronavirus. Employment in the OFS sector has declined by 13.5% from May of 2019 to May of 2020 [26] .
2 Consume rs of oil Layman
3 Oil Industry A price drop in oil future contracts will not necessarily result in a price drop at the local gas station, so the crisis will not have a direct impact on the consumers of oil [14] .
Before the advent of the coronavirus, the U.S operated close to 650 rigs, but after the oil crisis it is now down to 378 working rigs, which is more than a 40% reduction. The oil producers of U.S have closed more than 6,000 wells and curtailed about 405,000 barrels a day in production which is 30% of the state’s total output. Russia confirmed their delivery of flagship Ural oil would drop to a
Volume: 07 Issue: 09 | Sep 2020 www.irjet.net p-ISSN: 2395-0072
4 Oil refiners
5 Energy Sector
6 Small scale oil producer s 10 year low in May.
Countries like Africa, Vietnam and Brazil are reducing their daily output or at least making plans to do so. The supply chain of oil refining, freight and storage is starting to seize up so there is no way to push this already underpriced oil into the market. The prices available to producers of oil in Western Canada have fallen as low as single digits and there have been reporting’s of negative oil price for some grades in parts of North America [15] .
Marathon Petroleum Corporation, one of the biggest oil refiners of U.S announced it is stopping production at a plant near San Francisco [23] . Many refineries across Asia and Europe are working at half their capacities with U.S oil refiners clocking in their lowest processing of oil in the past 30 years [11] .
A transition to clean energy sources which had recently begun will be hindered due to the drop in oil price. Oil and gas have known to go hand in hand, as is the case of many long-term gas contracts and a drop in oil prices will sooner or later result in a drop in natural gas contract prices. Possibility of a reductionin gas production. Suppliers with the highest shortterm costs of production and those who rely on spot sales are among the most vulnerable [11] .
Most vulnerable to this crisis are the smaller oil producers such as those of Ecuador. Oman is also going through a similar situation with rising debts, while Nigeria has applied for emergency funds. Iraq which is already in a state of political turmoil is facing cut backs in oil revenue.
The plunge in oil prices isjust another blow for Venezuela, a country struggling with hyperinflation [16] .
If the oil price through 2021 averages to be $30 a barrel the budget deficits of many countries will become far more severe.
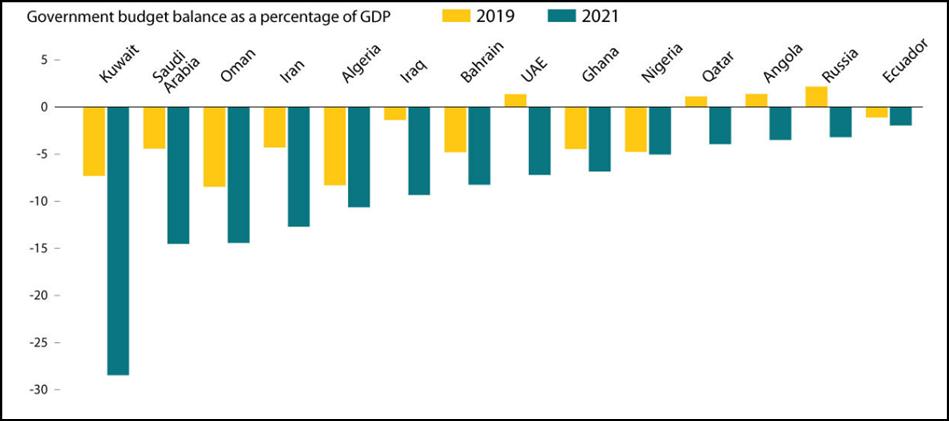
Fig -3: Government budget balances as a percent of GDP.
5.4 Improve
From the ‘analyze’ phase of DMAIC the primary causes which led to the crisis were identified as:
⮚Drop in Demand ⮚Surplus stock due to increased supply ⮚Russia -Saudi Arabia price war
A regression analysis was performed in order to determine the effect of the primary causes on the spot price of oil. For this purpose, the price of oil for the past 15 months was collected. It is evident that political factors cannot be quantified hence they are not included in the regression analysis.
Available Data [7][35]
Table -4: Reference data for regression
Oil spot Total Total price quantity quantity (EUROPE) – imported produced Brent (Y) (Kb/d) (X1) (Kb/d) (X2)
$63.96 46657.2536 67526.164 $66.14 44446.6183 66983.5108 $71.23 47871.2574 66092.5836 $71.32 44097.9794 66962.0358 $64.22 75889.76 67182.0955 $63.92 45431.5642 65687.4076 $59.04 45682.2931 66687.606
Volume: 07 Issue: 09 | Sep 2020 www.irjet.net p-ISSN: 2395-0072
$62.83 42851.7551 67176.4481 $59.71 44369.3293 68313.5324 $63.21 45603.9052 68531.0388 $67.31 45768.679 68327.1876 $63.65 44504.5902 67739.8023 $55.66 44670.6903 65033.6029 $32.01 42722.2057 63752.7927 $18.38 35095.8114 53770.714
In table 4, the oil spot price is the dependent variable Y, the total quantity imported and the total quantity produced were the independent variables X1 & X2 respectively. Since there is more than one independent variable, a multiple regression was performed. The R2 value based on table 4 came out to be 75.57% which implied that that the spot price of oil can be predicted with an accuracy of 75.57%.
⮚The below given regression equation [Equation 1] gave an approximate straight-line relation between the independent and the dependent variables.
Equation -1: Regression Equation
Oil spot price (EUROPE) -Brent =-169.2 + 0.000099 Total quantity imported+ 0.003387 Total quantity produced
⮚ In Table 5, the coefficient of both the independent variables, ‘Total quantity imported’ & ‘Total quantity produced’ was positive, hence the spot price of oil was positively correlated to them, meaning an increase in either of two would result in an increase in oil price and vice versa. ⮚ The coefficient of ‘Total quantity produced’ was greater than the coefficient of ‘Total quantity imported’ hence the price of oil depended more on the quantity produced.
Table -5: Coefficients
Term Coef SE Coef T-Value P-Value VIF
Constant - 37.9 -4.47 0.001 169.2
Total quantity imported Total quantity produced 0.000 099 0.000258 0.38 0.707 1.16
0.003 387 0.000616 5.50 0.000 1.16 ⮚From the model summary [Table 6] it wasunderstood that the spot price of oil could be predicted with an accuracy of 75.57%, for points lying within the domain of data points given above [Table 4].
Table -6: Model Summary
S R-sq R-sq(adj) R-sq(pred)
7.7374 75.57%71.50% 0.00% 7
From Table 7it is concluded that: ⮚ Null Hypothesis (H0) = There existed no association between the independent and dependent variables and the level of significance (LOS) was taken to be 5%.
⮚ The P-value for X2 that is total quantity produced was approximately zero (i.e. P < LOS), it wasconcluded that there was enough evidence to reject the null hypothesis. Which means that there was some association between X2 and Y. ⮚On the other hand, P-value for total quantity imported (X1) was greater than LOS meaning there was enough evidence to accept the null hypothesis meaning there was no association between X1 & Y.
Table -7: Analysis of Variance
Source DF Adj SS Adj MS F-Value P-Value
Regression 2 2222.76 1111.38 18.56 0.000 Total 1 8.85 8.85 0.15 0.707 quantity imported Total 1 1809.88 1809.88 30.23 0.000 quantity produced Error 12 718.42 59.87 Total 14 2941.18
⮚ The table shown below [Table 8] gave the difference in actual and predicted value for some unusual observations.
Table -8: Fits and Diagnostics for unusual observations
Oil spot price (EUROPE) Std - Brent Fit Residue Residue
5 64.22 65.82 -1.60 -1.22 X 14 32.01 50.92 -18.91 -2.57 R 15 18.38 16.36 2.02 0.76 X R Large residual X Unusual X
Volume: 07 Issue: 09 | Sep 2020 www.irjet.net p-ISSN: 2395-0072

Chart -4: Residual plot for spot oil price
From the tables 5, 6, 7 & 8 and equation 1, it was concluded that a change in the total quantity produced could help tackle the problem.
5.4.1 Steps taken by the G20 and OPEC+ nations to solve the crisis
As the world is still adjusting to the obstacles set forth by the onset of this pandemic, oil industries are already making efforts to abate the situation and break ground as soon as possible. The April report released by IEA [12] suggests that two important measures have been taken to tackle the crisis: o The IEA has urged all major consumers and producers of oil to work together to moderate the effects of the crisis through the G20 summit. On Friday, 10th of April a meeting was held by all Energy ministers of the G20 to decide on the production cuts and those present have offered to provide their support to the oil producers during these trying times. o The OPEC+ group has agreed to cut production by 9.7 million barrels per day (mb/day) initially effective May 1. Though the steps taken by the G20 countries won’t immediately improve the situation, it will reduce supply thus solving problems of storage as the oil already in stock will be pushed into the system. IEA has forecasted a drop in demand of oil for the months following April [12] as follows: o A drop in oil demand in April of as much as 29 million barrels per day year-on-year. o May is also expected to see a plunge in oil demand close to 26 million barrels per day year-on-year. o From June onwards we’ll see an improvement in demand, although it will still be 15 million barrels per day short of last year. The near-term demand losses cannot be subsided no matter how much we reduce the daily oil supply, but it will surely have an effect in the long-term demand.
5.5 Control
The primary purpose of this phase is to ensure the smooth implementation of the improvements suggested in the earlier phase and design a control plan so as to either avoid such a crisis in the future or to be well aware of it in advance.
5.5.1 Effect of the initiatives taken by the G20 and OPEC+ countries during April summit
o The OPEC+ alliance agreed to cut production effective from May, by 10.7 million barrels per day instead of the earlier agreed figure of 9.7 million barrels per day as oil production in April was high. o India, Korea, China, and United States all agreed to provide some temporary alternative to store the excess oil being produced or are making plans to take advantage of the situation and buy crude at a cheaper price. o Producers of oil other than the OPEC+ countries have also agreed to cut back on oil production to help the industry get out of this turmoil. IEA estimates Canada and U.S to reduce production by as much as 3.5 million barrels per day, in coming the months to tackle the low prices.
The cuts made in oil production will ensure that the second half of 2020 will see a deficit of oil supply & possibly an increase in demand a thus help in normalizing the market [12].
5.5.2 Graphical Analysis to compare the price of Brent Crude oil month-to-month
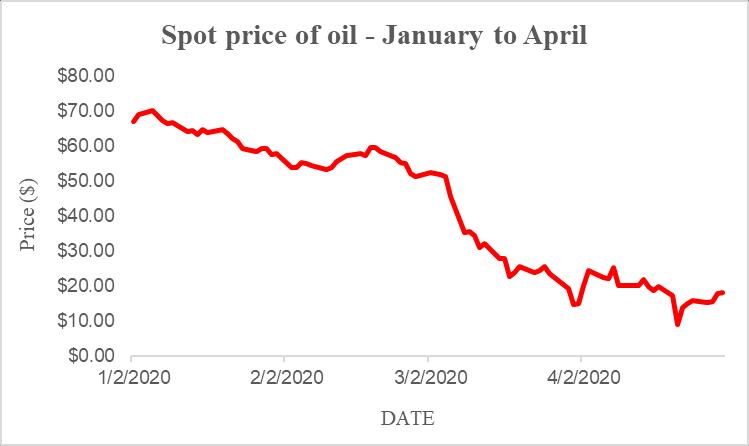
For the months of January to April the oil prices showed a decreasing trend:
Chart -5: Graph for spot price of oil –January to April
For the month of May to June the price of oil showed an uptick as shown:
Volume: 07 Issue: 09 | Sep 2020 www.irjet.net p-ISSN: 2395-0072
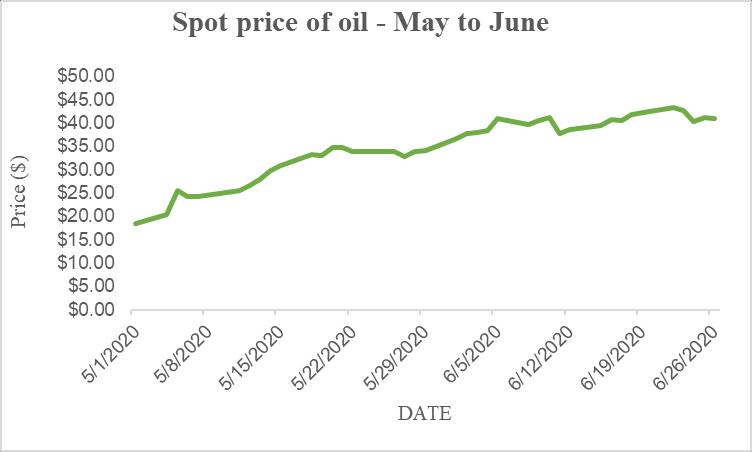
Chart -6: Graph for spot price of oil –May to June
The graph clearly indicates thatthe decisions taken during the OPEC+ & G20 summit have been effective and oil prices slowly returning back to normal.
To make sure that such a crisis is averted in the future or at least known about before-hand a flowchart [Figure 4] is developed to track the supply & demand cycle. Since political factors cannot be quantified, they have not been included in the flowchart.

Fig -4: Flowchart
On the basis of root cause analysis, it was concluded that one of the major reasons for this crisis was the imbalance in the supply and demand cycle, specifically the supply was much greater than the demand. Along with it there were certain political factors as well but since they are highly unpredictable in nature, it is difficult to develop a contingency plan for them. To maintain the supply and demand cycle, a flowchart is generated.
In case of an imbalance in the supply-demand dynamic
o If supply is greater than the demand: Decrease the oil production levels in order to bring the prices back to normal. o Else if demand exceeds the supply: increase production whilst keeping prices in check.
If the supply-demand dynamic is balanced: o Maintain decided upon production levels.
6. CONCLUSION
The paper represents how the six-sigma methodology DMAIC can be applied to the oil crisis of 2020 by making use of various statistical and six-sigma tools such as Regression analysis, Cause and effect analysis, Flowcharts and Graphical analysis. To implement the DMAIC approach, the problem at hand and its root causes were identified using Fishbone diagram. The oil consumption around the globe post the coronavirus pandemic was measured using graphical analysis and its impacts were noted. Measures taken by the G20 and OPEC+ countries to improve the situation were explored from the literature and a control plan was suggested to determine in advance the occurrence of such a crisis.
REFERENCES
[1] “Introduction to Global Markets for Crude Oil”. [2] Hamilton, J.D.. (2009). Understanding Crude Oil Prices. Energy Journal. 30. 179-206. 10.3386/w14492. [3] “What Percentage of the Global Economy Is the Oil and Gas Drilling Sector?”. Investopedia Feb 15 2020. [4] John, Emmanuel. (2018). OPEC (Organization of Petroleum Exporting Countries). [5] Harraz, Hassan. (2016). BENCHMARKS OF CRUDE OILS. 10.13140/RG.2.1.4306.5207. [6] IEA Oil Market Report. [7] Joint Organization Data Initiative (JODI) oil world database. [8] "Oil prices hit lowest level in 17 years as demand plunges". Financial Times. Retrieved 22 March 2020. [9] "Special Report: Trump told Saudi: Cut oil supply or lose U.S. military support-sources". Retrieved 30 April 2020. [10] kolochi, Prabu & Makesh, J. & Raj, K. & Devadasan, S.R. & Murugesh, R.. (2013). Six Sigma implementation through DMAIC: a case study. Int. J. of Process Management and Benchmarking. 3. 386 -400. 10.1504/IJPMB.2013.058162. [11] IEA (2020), The global oil industry is experiencing a shock like no other in its history, IEA, Paris [12] IEA (2020), Oil Market Report -April 2020, IEA, Paris