6 minute read
EXPERIMENTATION


International Research Journal of Engineering and Technology (IRJET) Volume: 07 Issue: 08 | Aug 2020 www.irjet.net e-ISSN: 2395-0056 p-ISSN: 2395-0072
Reddy tube is a hand-operated shock tube used to produce shock waves by using manual energy.
Advertisement
A Reddy tube is a hand-operated shock tube used to produce shock waves by using human energy. This contains a cylindrical stainless steel tube with a diameter of about 30 mm and a length of around 1m.It also contains two sections of length about 40cm and 60cm called the driver section and the driven section. The two sections are separated by 0.1 mm thick aluminum or Mylar or paper diaphragm. The far end of the driver section is fitted with a piston whereas the end of the driven section is locked with a door by a screw mechanism. The driver compartment is filled with a gas called a driver fuel, which is kept at reasonably high pressure due to the compression action of the piston. Afixtureis a type of holder or support device for the specimen. A fixture is used to mount the specimen in the correct position. It gives support during the operation and also there is an increase in accuracy, precision, reliability, and interchangeability in the finished parts.
3.2 Working of Reddy Tube
The paper diaphragm is placed inside the Reddy tube. The end of the driven tube is closed with a blanking plate. By connecting it to a vacuum pump the pressure is reduced inside the driven section of the shock tube, and then the valve is closed. The atmospheric gas is then compressed by pushing the piston horizontally towards the diaphragm until it ruptures. The pressure reading from the pressure gauge in the driver tube is observed. Due to the rupture of diaphragm, the driver gas quickly rushes inside the driven chamber and pushes the driven gas towards the far downstream end of the shock tube.
Fig-5: Reddy tube
This generates a moving shock wave that travels along the length of the driven section. As the shock passes through it, the shock wave immediately increases the temperature and pressure of the powered (test air) air. The primary shock wave that propagates is transmitted from the downstream end. The test gas undergoes more compression after the reflection which raises temperature and pressure to higher values still. This state of high pressure and temperature values is retained at the downstream end until an expansion wave mirrored from the driver tube's upstream end arrives there, and partly neutralizes the compression.
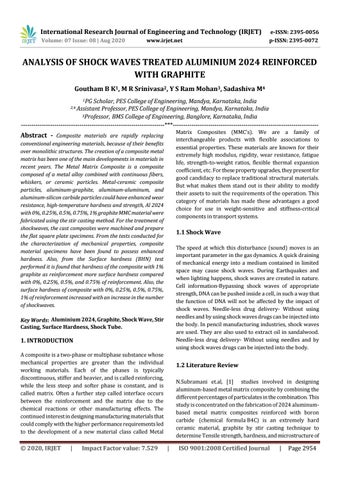
Fig-6: Diaphragm before and after it ruptures
At the time the diaphragm is ruptured, expansion waves are produced and they migrate in a direction opposite to that of the shock wave.
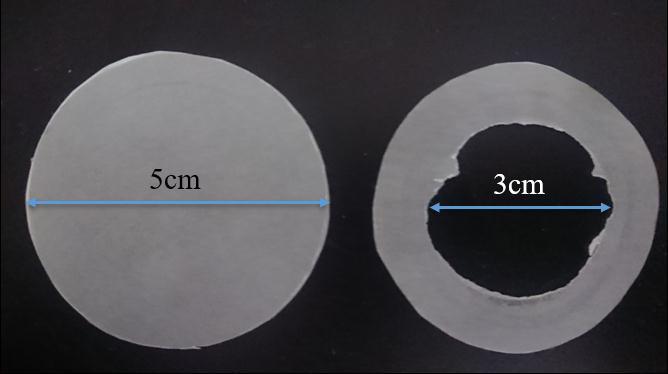
Fig-7:Plates subjected to multiple shocks The procedure repeats for all specimens of different percentages of reinforcement of graphite. For 0% there are three specimens so for all three specimens the shockwave treatment is different. For a specimen, we treat 20 number of shocks and 40 shocks, 60 shocks respectively.
4. RESULTS AND DISCUSSIONS
Al-Gr composite of different composition was prepared by the stir casting process. The cast specimens were treated to shockwaves than subjected to mechanical characterization (Hardness). The result of the characterization tests is discussed in the following section.
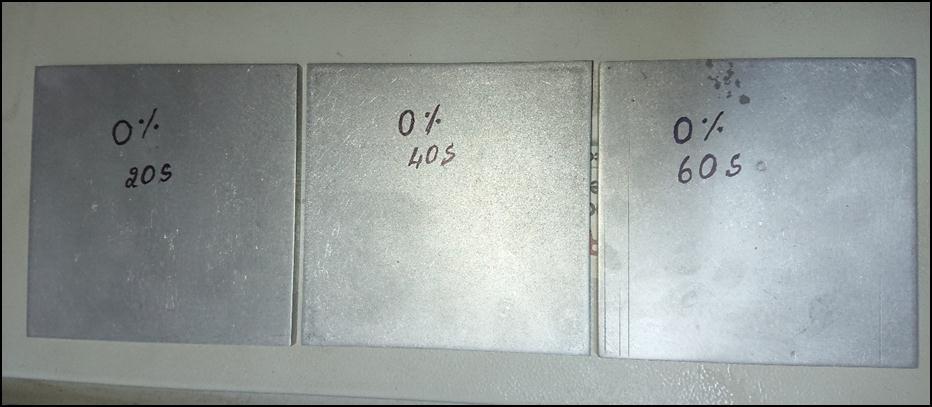
It can be observed that the hardness values of the composites are increasingly trendy. The improvement in hardness in the Aluminum 2024 matrix can be due to the uniform distribution of graphite particulate reinforcement, forming a tight interfacial bond between the matrix and the reinforcement.By taking random points on the shockwave treated aluminum 2024 reinforced with graphite, Brinell Hardness Number is calculated. The test method is IS-1500-
International Research Journal of Engineering and Technology (IRJET) Volume: 07 Issue: 08 | Aug 2020 www.irjet.net e-ISSN: 2395-0056 p-ISSN: 2395-0072
Fig-8: Random places where Hardness ismeasured
2010, a ball indenter of diameter 5mm, and the load 500kg areapplied for all test specimens. Test results and graphs are shown below and dwell time is 10 seconds.
4.1 The Experiment Is Conducted For Variation Of
Hardness For Varying % Of Reinforcement
Chart -1: Variation in surface hardness of 0% In chart -1, After 20 shocks for 0%, BHN is 70 and as shocks increase to 40. The BHN also increased to 71 and for 60 shocks the BHN is further increases to 75. And also, for 0.25% the surface hardness increases from 72 to 92 as the number of shocks increases from 20 to 6, shown in chart –2.
Chart-2: variation in surface hardness of 0.25%
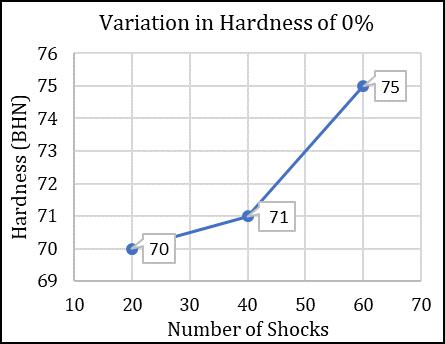
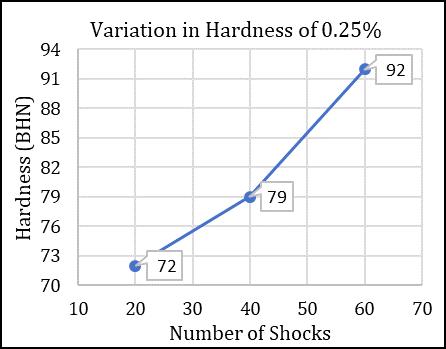
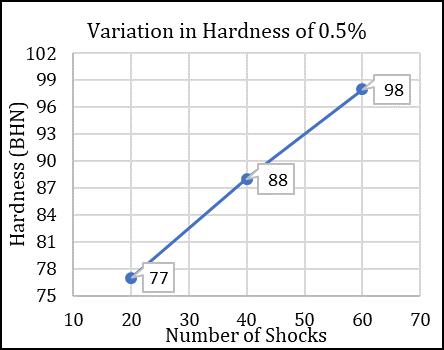
Chart-3: variation in surface hardness of 0.5%
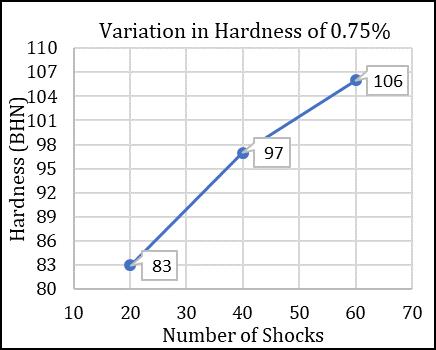
Chart-4: variation in surface hardness of 0.75%
In chart 3, for 0.5% treated with 20 shocks, the surface hardness (BHN) is more when compared to 0% and 0.25%
International Research Journal of Engineering and Technology (IRJET) Volume: 07 Issue: 08 | Aug 2020 www.irjet.net e-ISSN: 2395-0056 p-ISSN: 2395-0072
respectively. And for this plate also the surface hardness will increase from 77 to 98 as the number of shocks increases.
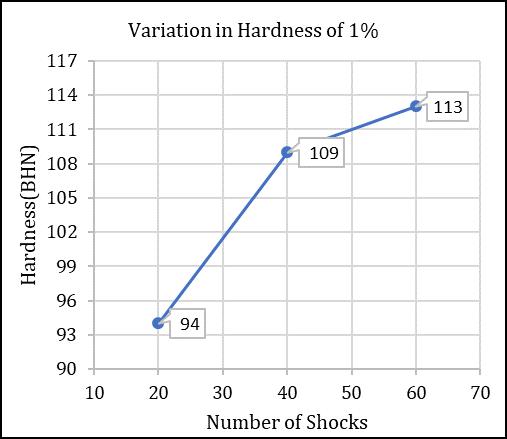
In chart 4, for 0.75% reinforcement of graphite treated with shocks the surface hardness is further increases and reaches the maximum surface hardness(BHN) of 106, which is high when compared to 0%, 0.25%, and 0.5% respectively. Chart-5: variation in surface hardness of 1% For 1% reinforcement of graphite, the surface hardness (BHN) of the plate is 94 for 20 shocks, 109 for 40 shocks and 113 for 60 number of shocks.
0.25%, 0.5%, 0.75%, 1% Reinforcement Of Graphite
Chart-6: variation in surface hardness of 0.5% Chart-6 shows that the increase in the percentage of surface hardness as the percentage of reinforcement increases and for the treatment of the different number of shocks. For 0% (as cast), 0.25%, 0.5%, 0.75%, and 1%, the percentage of increase in surface hardness (BHN) is 6.66%, 21.73%,
4.2 Percentage Of Increase In Surface Hardness For 0%,

21.42%, 21.69% and 16.81% respectively.
Chart-7: Increase in Hardness for % of Reinforcement.
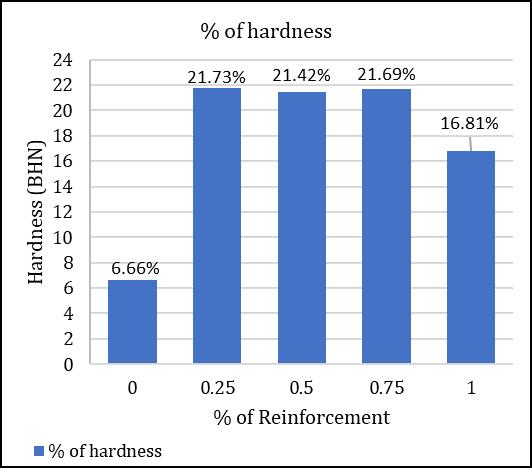
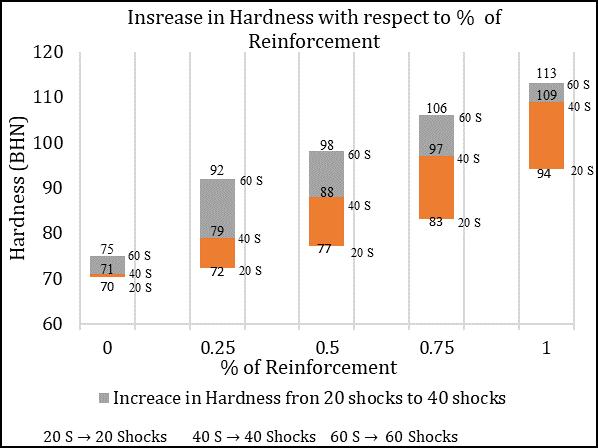
Chart-7clearly shows that how much increment in surface hardness for the different number of shocks. For 0% (as cast) the surface hardness(BHN) is 70 for 20 shocks, which is minimum. And for 1% The surface hardnessis 113 for 60 shocks which are maximum when compared to all other reinforced materials with a different number of shocks.
5. CONCLUSION
Research conducted in the present work to study the influence of percentage composition of Graphite particulates in Aluminium matrix alloy on the mechanical characteristic has provided the following conclusions, The Reddy tube and Reddy hypersonic shock tunnels have the potential to become revolutionary devices with the capability of bringing shock waves and high speed flows to the fingertips of aspiring engineers in the field. Increasing the percentage of reinforcement of graphite found enhances the shock absorption capacity of the material. More surface hardness results in the center portion compare to the surrounding area. Surface hardness enhancement was noticed with increased multiple shockwaves.
ACKNOWLEDGEMENT
PG center in machine design, Department of Mechanical Engineering P.E.S.C.E, Mandya. First I would like to thank my Guide M.R Srinivasa, and also our beloved HOD Dr. S. Ghanaraja who gave me the opportunity to do the project on