
18 minute read
Applying machine learning algorithms in sales

International Research Journal of Engineering and Technology (IRJET) Volume: 07 Issue: 06 | June 2020 www.irjet.net e-ISSN: 2395-0056 p-ISSN: 2395-0072
Advertisement
Purvika Bajaj1 , Renesa Ray2 , Shivani Shedge3 , Shravani Vidhate4 , Prof. Dr. Nikhilkumar Shardoor5
1234Student, Dept. of Computer Science and Engineering, MIT School of Engineering, MIT ADT University, Pune Maharashtra, India 5Guide, Dept. of Computer Science and Engineering, MIT School of Engineering, MIT ADT University, Pune Maharashtra, India --------------------------------------------------------------------*** ---------------------------------------------------------------------Abstract - Machine Learning is transforming every walk of life forecasting. The process of forecasting involves analyzing and has become a major contributor in real world scenarios. data from various sources such as market trends, consumer The revolutionary applications of Machine Learning can be behavior and other factors. This analysis would also help the seen in every field including education, healthcare, companies to manage the financial resources effectively. The engineering, sales, entertainment, transport and several more; forecasting process can be used for many purposes, the list is never ending. The traditional approach of sales and including: predicting the future demand of the products or marketing goals no longer help the companies, to cope up with service, predicting how much of the product will be sold in a the pace of competitive market, as they are carried out with no given period. insights to customers’ purchasing patterns. Major transformations can be seen in the domain of sales and This is where machine learning can be exploited in a great marketing as a result of Machine Learning advancements. way. Machine learning is the domain where the machines Owing to such advancements, various critical aspects such as gain the ability to outperform humans in specific tasks. They consumers’ purchase patterns, target audience, and predicting are used to do some specialized task in a logical way and sales for the recent years to come can be easily determined, gain better results for the progress of the current society. thus helping the sales team in formulating plans for a boost in The base of machine learning is the art of mathematics, with their business. The aim of this paper is to propose a dimension the help of which various paradigms can be formulated to for predicting the future sales of Big Mart Companies keeping approach the optimum output. In case of sales forecasting in view the sales of previous years. A comprehensive study of also machine learning has proved to be a boon.It is helpful in sales prediction is done using Machine Learning models such predicting the future sales more accurately. as Linear Regression, K-Neighbors Regressor, XGBoost Regressor and Random Forest Regressor. The prediction In our paper we have proposed the machine learning includes data parameters such as item weight, item fat algorithms towards the data collected from the previous content, item visibility, item type, item MRP, outlet sales of a grocery store. The objective here is to envisage the establishment year, outlet size and outlet location type. pattern of sales and the quantities of the products to be sold Sales forecasting has always been a very significant area to concentrate upon. An efficient and optimal way of forecasting has become essential for all the vendors in order to sustain the efficacy of the marketing organizations. Manual infestation of this task could lead to drastic errors leading to poor management of the organization, and most importantly would be time consuming, which is something not desirable in this expedited world. A major part of the global economy relies upon the business sectors, which are literally expected to produce appropriate quantities of products to meet the overall needs. Targeting the market audience is the major focus of business sectors. It is therefore important that the company has been able to achieve this objective by employing a system of based on some key features gathered from the raw data we Key Words: Standard Scaler, Label Encoder, Linear have. Analysis and exploration of the collected data has also Regression, K-Neighbors Regressor, XGBoost Regressor, been done to gain a complete insight of the data. Analysis Random Forest Regressor would help the business organizations to make a 1. INTRODUCTION strategy.
probabilistic decision at each important stage of marketing
2. RELATED WORK
[1] ’Walmart's Sales Data Analysis - A Big Data Analytics Perspective’ In this study, inspection of the data collected from a retail store and prediction ofthe future strategies related to the store management is executed. Effect of various sequence of events such as the climatic conditions, holidays etc. can actually modify the state of different departments so it also studies this effects and examines its influence on sales.
[2] ’Applying machine learning algorithms in sales prediction’
International Research Journal of Engineering and Technology (IRJET) Volume: 07 Issue: 06 | June 2020 www.irjet.net e-ISSN: 2395-0056 p-ISSN: 2395-0072
This is a thesis in which several distinct procedures of machine learning algorithms are utilized to get better, optimal results, which are further examined for prediction task. It has made use of four algorithms, an ensemble technique etc. Feature selection has also been implemented using different tactics.
[3] ’Sales Prediction System Using Machine Learning’ In this paper, the objective is to get proper results for predicting the future sales or demands of a firm by applying techniques like Clustering Models and measures for sales predictions. The potential of the algorithmic methods are estimated and accordingly used in further research.
[4] ’Intelligent Sales Prediction Using Machine Learning Techniques’ This research presents the exploration of the decisions to be made from the experimental data and from the insights obtained from the visualization of data. It has used data mining techniques. Gradient Boost algorithm has been shown to exhibit maximum accuracy in picturizing the future transactions.
[5] ’Retail sales prediction and item recommendations using customer demographics at store level’ This paper outlines a sales prediction system along with the product recommendation system, which was used for the benefit of the group of retail stores. Consumer demographic details have been used for precisely designing the sales of each individual.
[6] ‘Utilization of artificial neural networks and GAs for constructing an intelligent sales prediction system’ In the study, usage of deep neural network techniques is to know about their sales strategy regarding electronic components ahead in time. Some optimization algorithms are also used to maximize the efficiency of the system: like Genetic Algorithm.
[7]’Bayesian learning for sales rate prediction for thousands of retailers’
In this paper it is shown that from the prediction of the single one’s rate of transactions, many vendors would benefit from it, that means the informationobtained could be beneficial for the construction of a set-up that would estimate large number of outputs. The prediction uses neural network approach. Here they have practiced Bayesian learning to gain insights.
[8] ’Combining Data Mining and Machine Learning for Effective User Profiling’ This research describes the way of detecting suspicious behavior by employing an automatic prototype. Several machine learning methodologies have been made in use for concluding this appropriate prototype. Here data mining and constructive induction techniques are merged to pull out the discrepancy found in the conducts of the owners of cell phones.
3. DATA VISUALIZATION
3.1 Heat map for determining correlation between the dataset attributes
Heat map, an element of the data visualization library called Seaborn, is a color encoded matrix which is used here to depict the correlation between target variable and the rest of the attributes.
Higher the intensity of the color of an attribute relative to the target variable, lower is the dependency of the target variable on the respective attribute.
It is observed that target variable i.e., Item_Outlet_Sales is least dependent on Item_Visibility and most dependent on Item_MRP. Thus, higher the MRP of an item, lower will be the Item_Outlet_Sales.
Fig–1:Heatmapfor correlation between attributes
3.2 Count Plots
The distribution of various Outlet Types i.e., Supermarket Type1, Supermarket Type2, Grocery Store, Supermarket Type3 is plotted. It is observed that maximum outlets areof SupermarketType1.
International Research Journal of Engineering and Technology (IRJET) Volume: 07 Issue: 06 | June 2020 www.irjet.net e-ISSN: 2395-0056 p-ISSN: 2395-0072

Fig–4: No. of items with each type

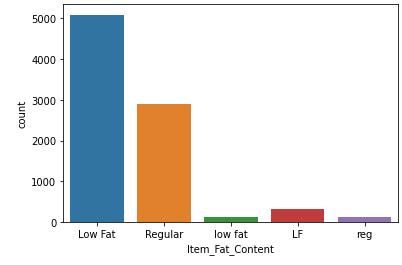
Fig–2: Count of each outlet type The count plot for Item Fat Content is plotted which consists of two categories Low Fat and Regular Fat written in different manners. It is observed that most of the items have low fat content. Fig–3: No. of items with each type of fat content The distribution of each item type is depicted by the following plot. Most of the items are Fruits and Vegetables followed by Snack Foods. In contrast to this, Seafood is least in count. Most of the outlets are medium sized whereas very few are
high or large sized.

Fig–5: No. of outlets of different sizes
As per the dataset used, there are three categories of Outlet Location Type i.e., Tier1, Tier2 and Tier3. Maximum number

of outlets belongs to Tier3 type location.
Fig–6: No. of outlets belonging to different categories of location type
International Research Journal of Engineering and Technology (IRJET) Volume: 07 Issue: 06 | June 2020 www.irjet.net e-ISSN: 2395-0056 p-ISSN: 2395-0072
3.3 Impact of various attributes on Item Outlet Sales
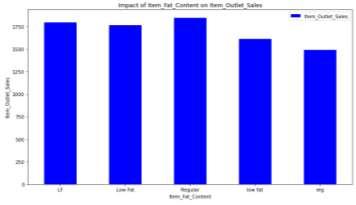
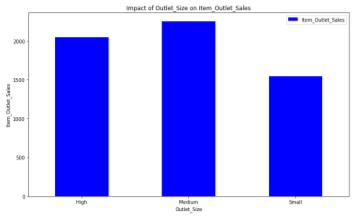
It is noted that the outlet established in the year 2004 has the highest Sales. Item outlet sales for the Low Fat Content types of items are the highest. Medium sized outlets have the highest sales. It is observed that the Outlet type has significant effect on the sales. Supermarket Type3 outlets have the highest sales.

Fig–7: Impact of Outlet Establishment Year on Outlet Sales

Whereas, grocery store outlets have the lowest sales. Fig–10: Impact of Outlet Typeon Outlet Sales
Outlets belonging to the Tier2 location type have the largest

Fig–8: Impact of Item Fat Contenton Outlet Sales
sales.
Fig–9: Impact of Outlet Sizeon Outlet Sales Fig–11: Impact of Outlet Location Typeon Outlet Sales
4. DATA PREPROCESSING
In machine learning algorithm, data can’t be used in its normal form as it is the as the way it is obtained, sothe data needs to be devised before employing it in machine learning models. This technique is used to solve problems that are not yet known by the knowledge extractor. For example, if you have a problem with your car and want to know how much oil it takes to drive, you can ask the car’s driver to tell you the exact amount of oil needed. This is called preprocessing work. The goal of preprocessing is to find out what kind of information the car needs before making any decisions about whether to use it or not. Proper formatted and cleaned data is essential for preprocessing. Data preprocessing consists of the following activities:
1) Importing the dataset: In our study we have used the dataset collected from a grocery store to check the future
International Research Journal of Engineering and Technology (IRJET) Volume: 07 Issue: 06 | June 2020 www.irjet.net e-ISSN: 2395-0056 p-ISSN: 2395-0072
sales or demand of an item outlet. It includes the following attributes:
Item_identifier, Item_weight, Item_fat_content, Item_visibility, Item_type, Item_MRP, Outlet_identifier, Outlet_establishment_year, Outlet_size, Outlet_location_type, Outlet_type, Item_Outlet_sales
Dataset is imported by saving the dataset file as CSV file.
2) As a part of data cleaning, some columns are needed to be removed which do not contribute in attaining the final results of the algorithm. Here Item_identifier and Outlet_identifier are dropped.
3) Handling missing values: Missing data is something that needs to be manipulated so that there remains no discrepancy in the data to be fed into the model. Here there were some missing values in Item_weight and Outlet_size column. In case of Outlet_size , the entire row has been dropped with those of missing values and in case of Item_weight the missing spaces are filled with mean of all the other entries in the column.
4) Encoding categorical data: As machine learning concepts make use of mathematical models to solve problems, we need to make sure that we have enough numerical data to support our hypothesis in order to get the best out of it, as mathematics works well with numbers. LabelEncoder is a class imported from the sklearn library to do this task. We have encoded ‘Item_fat_content’, ‘Item_type’, ‘Outlet_size’, ‘Outlet_location_type’, ‘Outlet_type’, ‘Outlet_establishment_year’. 5) Feature scaling: Feature scaling is a method in which we scale the data into an accurate and scalable size for the purpose of increasing accuracy and reducing error. It basically prevents the large variance of data points to be used in the algorithm and allows us to achieve better results. StandardScaler is a class imported from sklearn library. Here, standardization method has been used. We have standardized ‘Item_weight’ and ‘Item_mrp’. 6) Extracting Independent and Dependent variables: Dependent variables are the targets or the output variables which needs to be finally evaluated and then compared against each other. Independent variables are the features or the input variables which can’t be changed by any means and accordingly the targets are predicted. Independent variables include: ‘Item_weight’, ‘Item_fat_content’, ‘Item_visibility’, ‘Item_type’, ‘Item_mrp’, ‘Outlet_establishment_year’, ‘Outlet_size’, ‘Outlet_location_type’, ‘Outlet_type’. Dependent variable include: ‘Item_Outlet_sales’ 7) Splitting the dataset into training and test dataset: To avoid overfitting, two separate datasets are not imported for trainand test. So, splitting is done in a single dataset. The training dataset are the data we need to train the model on. Test datasets are those ones which can be used to predict the outcome of a test.
5. ALGORIHTMS USED
5.1 Linear Regression
Linear Regression is the most commonly and widely used algorithm Machine Learning algorithm. It is used for establishing a linear relation between the target or dependent variable and the response or independent variables. The linear regression model is based upon the following equation:
y θ0+ θ1x1 +θ2x2 + θ3x3 +……+ θnxn where, y is the target variable, θ0 is the intercept, x1,x2,x3,….,xn are independent variables and θ1, θ2, θ3,……, θn are their respective coefficients. The main aim of this algorithm is to find the best fit line to the target variable and the independent variables of the data. It is achieved by finding the most optimal values for all θ. With best fit it is meant that the predicted value should be very close to the actual values and have minimum error.
Error is the distance between the data points to the fitted regression line and generally can be calculated by using the following equation:
Error = y -y , where, y is the actual value and y is the predicted value.
5.2 K-Neighbors Regressor
KNN algorithm for Regression is a supervised learning approach. It predicts the target based on the similarity with other available cases. The similarity is calculated using the distance measure, with Euclidian distance being the most common approach.
Predictions are made by finding the K most similar instances i.e., the neighbors, of the testing point, from the entire dataset. KNN algorithm calculates the distance between mathematical values of these points using the Euclidean distance formula:
The value of K to be selected shouldn’t be very small as it might result into noise in the data and in turn overfitting. The general solution is to reserve a part of data for testing the accuracy of the model. Then choose K=1, and then use the training part of modeling and calculate theaccuracy of
International Research Journal of Engineering and Technology (IRJET) Volume: 07 Issue: 06 | June 2020 www.irjet.net e-ISSN: 2395-0056 p-ISSN: 2395-0072
prediction using all samples in the test set. Repeat this process increasing the K and choose K such that it is best for the model.
5.3 XGBoost Regressor
XGBoost also known as Extreme Gradient Boosting has been used in order to get an efficient model with high computational speed and efficacy. The formula makes predictions using the ensemble method that models the anticipated errors of some decision trees to optimize last predictions. Production of this model also reports the value of each feature’s effects in determining the last building performance score prediction. This feature value indicates that outcome in absolute measures –each characteristic has on predicting school performance. XGBoost supports parallelization by creating decision trees in a parallel fashion. Distributed computing is another major property held by this algorithm as it can evaluate any large and complex model. It is an out-core-computation as it analyses huge and varied datasets. Handling of utilization of resources is done quite well by this calculative model. An extra model needs to be implemented at each step in order to reduce the error.
XGBoost objective function at iteration t is:
L(t)= ∑i=1nL(y_outi, y_out1i(t-1) + ft(xi) + g(ft)
where,y_out= real value knowm from the training dataset, and the summation part could be said as f(x + dx) where x= y_out1i(t-1)
We need to take the Taylor approximation. Let’s take the simplest linear approximation of f(x) as:
f(x)= f(b) + f`(b)(x-b) dx= ft(xi)
where,f(x) is the loss function L, while b is the previous step (t-1) predicted value and dx is the new learner we need to add in step t.
Second order Taylor approximation is:
f(x)= f(b) + f`(b)(x-b) + 0.5f``(b)(x-b)^2
L(t)= ∑i=1n[L(y_outi, y_out1(t-1)) + hift(xi) + 0.5kift^2(xi)] + g(ft)
If we remove the constant parts, we have the following simplified objective to minimize at step t,
L1(t) ∑i=1n[hift(xi) + 0.5kift^2(xi)] + g(ft)
5.4 Random Forest Regressor
Random Forest is defined as the collection of decision trees which helps to give correct output by making use of bagging mechanism. Bagging along with boosting are two of the most common ensemble techniques which intend to tackle higher variability and higher prejudice. In bagging, we have multiple base learners, or we can say base models, which in turn takes various random samples of records from the training dataset. In case of Random Forest Regressor decision trees are the base learners, and they are trained on the data collected by them. Decision trees are itself not accurate learners as, when it is implemented up to its full depth, mostly there are chances of overfitting with high training accuracy, but low real accuracy. So, we give out the samples of the main data file by utilizing row sampling and feature sampling with replacement technique to each of the decision trees and this method is referred to as bootstrap. The result is that every model has been trained on all of these data files and then whenever we feed a test data to each of the trained one out there, the predictions estimated by each of them are combined in a way such that the final output is the mean of all of the results generated. The process of combining the individual results here is known as aggregation. The hyperparameter that we need to regulate in this algorithm is the no of decision trees to be considered to create a random forest.
Let’s calculate the Gini importance of a single node of a decision tree:
Mij= wjCj -wl(j)Cl(j) –wr(j)Cr(j)
where Mij-importance of node j, wj-weighted no of samples reaching node j, Cj- the entropy value of node j, l(j)- child node from left split, r(j)-child node from right split on node j
The importance of each feature on a base learner is then found outas:
Nij ∑j:node j splits on feature iMij/∑k€all nodesMik
where Nij-importance of feature i
Normalized value will be:
normNii= Nii/∑j€all featuresNij
The final feature importance, at the Random Forest level, is it’s average over all the trees. RFONii ∑j€all treesnormNiij/T
where RFONii- importance of feature I calculated from all trees in the random forest model, normNiij-the normalized feature importance for i in tree j and T-total no of trees .
6. RESULTS
Machine Learning algorithms such as Linear Regression, KNearest Neighbors algorithm, XGBoost algorithm and Random Forest algorithmhave been used to predict the sales of various outlets of the Big Mart. Various parameterssuch as Root Mean Squared Error (RMSE), Variance Score, Training and Testing Accuracies which determine the
International Research Journal of Engineering and Technology (IRJET) Volume: 07 Issue: 06 | June 2020 www.irjet.net e-ISSN: 2395-0056 p-ISSN: 2395-0072
precision of results are tabulated for each of the four algorithms. Random Forest Algorithm is found to be the most suitableof all with an accuracy of 93.53%.
7. CONCLUSION
With traditional methods not being of much help to the business organizations in revenue growth, use of Machine Learning approaches prove to be an important aspect for shaping business strategies keeping into consideration the purchase patterns of the consumers. Prediction of sales with respect to various factors including the sales of previous years helps businesses adopt suitable strategies for increasing sales and set their foot undaunted in the competitive world.
REFERENCES
[1] Singh Manpreet, Bhawick Ghutla, Reuben Lilo Jnr, Aesaan FS Mohammed, and Mahmood A. Rashid. "Walmart's Sales Data Analysis-A Big Data Analytics Perspective." In 2017 4th Asia-Pacific World Congress on Computer Science and Engineering (APWC on CSE), pp. 114-119. IEEE, 2017.
[2] Sekban, Judi. "Applying machine learning algorithms in sales prediction." (2019).
[3] Panjwani, Mansi, Rahul Ramrakhiani, Hitesh Jumnani, Krishna Zanwar, and Rupali Hande. Sales Prediction System Using Machine Learning. No. 3243. EasyChair, 2020.
[4]Cheriyan, Sunitha, Shaniba Ibrahim, Saju Mohanan, and Susan Treesa. "Intelligent Sales Prediction Using Machine Learning Techniques." In 2018 International Conference on Computing, Electronics & Communications Engineering (iCCECE), pp. 53-58. IEEE, 2018.
[5] Giering, Michael. "Retail sales prediction and item recommendations using customer demographics at store level." ACM SIGKDD Explorations Newsletter 10, no. 2 (2008): 84-89.
[6] Baba, Norio, and Hidetsugu Suto. "Utilization of artificial neural networks and GAs for constructing an intelligent sales prediction system." In Proceedings of the IEEE-INNS-ENNS International Joint Conference on Neural Networks. IJCNN 2000. Neural Computing: New Challenges and Perspectives for the New Millennium, vol. 6, pp. 565-570. IEEE, 2000.
[7] Ragg, Thomas, Wolfram Menzel, Walter Baum, and Michael Wigbers. "Bayesian learning for sales rate prediction for thousands of retailers." Neurocomputing 43, no. 1-4 (2002): 127-144.
[8] Fawcett, Tom, and Foster J. Provost. "Combining Data Mining and Machine Learning for Effective User Profiling." In KDD, pp. 8-13. 1996.
