International Research Journal of Engineering and Technology (IRJET)
e-ISSN: 2395-0056
Volume: 06 Issue: 05 | May 2019
p-ISSN: 2395-0072
www.irjet.net
IR Instrument Thermal Background Modelling and Radiometric Analysis Gaurav Jha1, Ankush Kumar2, Prof. Usha Neelakantan3 1Master
of Engineering (4th Semester), L.D. College of Engineering, Ahmedabad 2SCI/ENGR-SD, Space Applications Centre, ISRO, Ahmedabad 3HOD, Electronics and Communication Engineering, L.D. College of Engineering, Ahmedabad -------------------------------------------------------------------------***-----------------------------------------------------------------------Abstract - In this paper the thermal modelling IR instruments is carried out along with it’s radiometric analysis. The focus in thermal modelling is laid on the instruments focal plane array temperature. For analysis the FPA data sheet is used in which the FPA temperature varies in 28 such datasets. Coefficients are generated and stored. Second part deals with radiometric analysis where SNR is determined after subtracting the dark and then the LTC coefficients are generated. Fitting profile chosen for both thermal modelling and radiometric analysis is same except for order of fitting while for generating LTC coefficients different profile (linear fitting) is chosen. Keywords: Radiometric Modelling, IR Instruments
Analysis,
Background
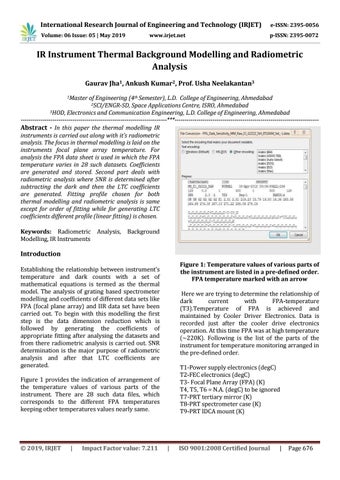
Introduction Figure 1: Temperature values of various parts of the instrument are listed in a pre-defined order. FPA temperature marked with an arrow
Establishing the relationship between instrument’s temperature and dark counts with a set of mathematical equations is termed as the thermal model. The analysis of grating based spectrometer modelling and coefficients of different data sets like FPA (focal plane array) and IIR data set have been carried out. To begin with this modelling the first step is the data dimension reduction which is followed by generating the coefficients of appropriate fitting after analysing the datasets and from there radiometric analysis is carried out. SNR determination is the major purpose of radiometric analysis and after that LTC coefficients are generated.
Here we are trying to determine the relationship of dark current with FPA-temperature (T3).Temperature of FPA is achieved and maintained by Cooler Driver Electronics. Data is recorded just after the cooler drive electronics operation. At this time FPA was at high temperature (~220K). Following is the list of the parts of the instrument for temperature monitoring arranged in the pre-defined order. T1-Power supply electronics (degC) T2-FEC electronics (degC) T3- Focal Plane Array (FPA) (K) T4, T5, T6 = N.A. (degC) to be ignored T7-PRT tertiary mirror (K) T8-PRT spectrometer case (K) T9-PRT IDCA mount (K)
Figure 1 provides the indication of arrangement of the temperature values of various parts of the instrument. There are 28 such data files, which corresponds to the different FPA temperatures keeping other temperatures values nearly same.
© 2019, IRJET
|
Impact Factor value: 7.211
|
ISO 9001:2008 Certified Journal
|
Page 676