International Research Journal of Engineering and Technology (IRJET) e-ISSN:2395-0056

Volume: 10 Issue: 03 | Mar 2023 www.irjet.net

International Research Journal of Engineering and Technology (IRJET) e-ISSN:2395-0056
Volume: 10 Issue: 03 | Mar 2023 www.irjet.net
1,4Accra Institute of Technology, Faculty of Engineering, Department of Electrical Engineering, Accra, Ghana
2Regent University College of Science & Technology, Faculty of Engineering, Computing & Allied Sciences, Accra, Ghana
3University of Mines and Technology, Faculty of Engineering, Department of Renewable Energy Engineering, Tarkwa, Ghana
5Accra Institute of Technology, Faculty of Business, Department of Business School, Accra, Ghana.
ABSTRACT: Although cellular networks have been largely deployed by various mobile communication service providers all over the developing world, to cope with the ever increasing demand for mobile and wireless data services, poor services such as congestion, call drops and cell interference just to mention a few, have made their real impact on the populace unnoticeable. This article presents among others, analysis on how antenna down tilting can be used to improve on the performance of cellular networks. Radio Wave Propagation Models such as Hata-Okumura and COST-231 Hata Models that are important for proper cellular network planning, interference estimations, frequency assignments and cell parameters have been discussed. The effect of antenna down tilting on Received power (Received Signal Code Power) at the Mobile Station (MS), and signal- to-noise ratio (Ec/No) or signal-to-interference ratio (Ec/Io) on the network have been investigated. Data for this work was collected at some selected 3G cellular sites through drive test data-collection approach. Plots were used to stimulate the results from the studies before and after the parameter adjustments were made to prove that antenna down tilting plays significant role in cellular network performance.
KEY WORDS: Cellular Networks, Radio Wave Propagation, COST-231 Hata Models, Signal-to-Interference Ratio, Antenna, ReceivedPowerandNetwork
Wirelessdeliveryofinformationandservicesplayacrucialroletofacilitategrowthandprosperity. Today,itisoneofthekey measurestoourmodern dayqualityoflife.Themultipleaccesstechniques orschemes thatare employed by majority ofthe cellular telephony industry are: Frequency-Division Multiple Access (FDMA), Code-Division Multiple Access (CDMA), Orthogonal Frequency Division Multiple Access (OFDMA) and Non-Orthogonal Multiple Access, (NOMA) FDMA are used in thesecondgeneration(2G)systems, CDMAinthethirdgeneration(3G)systems,OFDMA inthe4Gsystemsand NOMAinthe 5Gsystems.MultipleAccessSchemeisaprocessthatenablesmultipleuserstogainaccesstothewirelessnetworkanduseit simultaneously.
The system capacity of any cellular multiple access techniques or schemes is vulnerable to other-cell interference Hence, in the planning process of multiple access radio network, the major aim is to plan the network in such a way that, cell interferenceisminimisedinordertomaximizenetworkcapacity.Maximizationofnetworkcapacitycanberealisedifnetwork topologyisoptimized.Oneimportantphaseofthetopologyplanningisthedefinitionofantennaconfigurationandespecially, antennadowntiltangle.
Antennadown-tiltingisamethodofeffectivelyadjustingtheverticalradiationpatternofthe antennainordertoincreasethe amount of power radiated downwards. Antenna downtilt has two different concepts mechanical downtilt (MDT) and electrical downtilt (EDT). Electrical downtilting is when the antenna is tilted in such a way that the radiation patterns are horizontal.Inmechanicaldowntilt(MDT),theantennaelementisphysicallydirectedtowardstheground. Byutilizingantenna down tilt, signal level within a cell can be improved and interference radiation towards other cells can also be effectively reduced. But, if the downtilt angle exceeds certain degree, it may lead to ''cell border areas'' coverage problems. Hence, it is
important to specify the optimum downtilt angle distinctive for each site and antenna configuration. Antenna downtilting is paramountforallcellulartelephonygenerations(2G,3G,4Gand5G).
The initial deployment of a cellular system is based on extensive drive tests and computer simulations. Later on, the system parametersarefine-tunedbasedoncollectedstatisticsandfaultreportstakeninthefield.Unfortunately,thisapproachdoes not cope with real-time changes in traffic and propagation conditions. The efficiency of a cellular network depends on its correct configuration and adjustment of radiant systems: transmit and receive antennas. The effects of adjusting antenna height and tilt in cellular networks are well known in radio network planning and optimization. There is substantial reductions in path-loss, delay spread, transmitted power, and system interference when suitable height and antenna tilt are selectedforastaticsystem [1]. Theneedforadaptingantennasettingstotheexpectedtrafficdistributionandcellsizecannot beoveremphasized.
Thesecondgenerationcellularsystemisdigitalunlikethefirstgenerationwhichisanalog.The2Gforalargeextendcorrected thelimitationsof1G.The2Galsohasadvantagessuchas:
Improvedspectralutilization,achievedbyusingadvancedmodulationtechniques.
Lowerbitratevoicecodingenabledmoreusersgettingtheservicessimultaneously.
Reductionofoverheadinsignaling,pavedwayforcapacityenhancement.
Goodsourceandchannelcodingtechniques,makethesignalmorerobusttoInterference.
NewserviceslikeSMSwereincluded.
Improvedefficiencyofaccessandhand-offcontrolwereachieved.
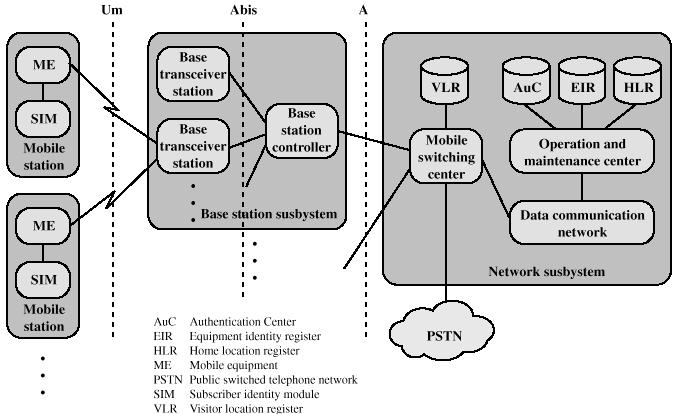
Thenetworktopologyofsecondgenerationcellularsystemisasshowninfigure1.
It should be noted that, with 2G one has no access to the internet; to correct this disadvantage, node such as General Packet RadioService(GPRS)wasincorporatedintothe2Gsystem.Withthisintroduction,the2Gbecame2.5G.Therewereotheradd ons such as Enhanced Data Rates for Global Evolution or Enhanced Data Rate for GSM Evolution (EDGE). This add-on improvedtheeffectivenessofinternetconnectivitytocellulartelephonysystem.
The need for higher capacity, faster data rates, better Quality of Service (QoS) and solving the incompatibilities problems betweenGSMandCDMAaresomeofthebasisforevolutionofThirdGenerationCellularSystem(3G).Someofthestandards of 3G are based on Wideband Code Digital Multiple Access (W-CDMA) which is also called Universal Mobile Telecommunications Systems (UMTS). In 3G (UMTS) the Base Station Controller (BSS) is renamed RNS (Radio Network System), The Base Transceiver Station (BTS) is called Node B, its function is to convert data flows over the interfaces to the UserEquipment(UE)andtheCoreNetwork(CN). TheBSCfunctionalityisreplacedbyRadioNetworkController(RNC).The function of the RNC is to route voice message to the Mobile Switching Centre (MSC) and data packet to the Serving GPRS SupportNode(SGSN).The CoreNetwork includesthesameelementsasin2.5G network andsupportcircuitservicesvia the MobileSwitchingCentre(MSC)andpacketservicesvia ServingGPRSSupportNode (SGSN)andGatewayGPRSSupportNode (GGSN) Thisaccessionisdepictedinfigure2 A3Gterminalcansimultaneouslyreceivedatafrommultiplecellsandcombine themintoabettersignal.3Gsupportsdifferentlevelsofserviceasdefinedby3GPP's(ThirdGenerationPartnershipProject).
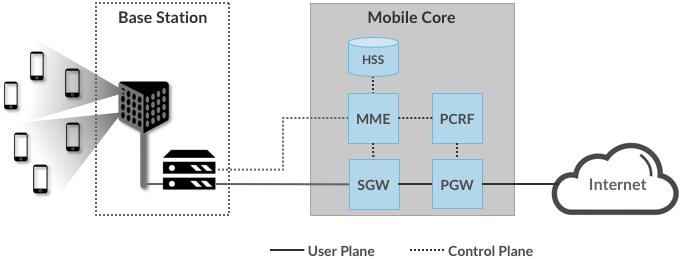
In the quest to derive high quality of video streaming and data speed, ranging from 100Mbps to 1Gbps among others from cellulartelephony,thefourthgenerationmobilesystemwasborneandlaunchedin2009.Ingeneral,the4Gcellularnetworkis madeupoftwomajorsubsystems;thesearetheRadioAccessNetwork(RAN)andtheMobileCore.Theradioaccessnetwork basicallyconsistoftheUserEquipment(cellularphone)andtheBaseStationknownas EvolvedNodeB(eNodeBoreNB).The function of RAN is to manage the radio spectrum, making sure it is used efficiently and meets the quality-of-service (QoS) requirements of every user [2].The Mobile Core Network is a generic term and in 4G, it is known as Evolved Packet Core (EPC). Some of the important nodes under this core network are: Mobility Management Entity (MME), Home Subscriber Server(HSS),Policy&ChargingRulesFunction(PCRF),ServingGateway(SGW)andPacketGateway(PGW).Thefunctionality of the mobile core network include: providing Internet protocol (IP) connectivity for both data and voice services, ensuring thisconnectivityfulfillsthepromisedQoSrequirements,trackingusermobilitytoensureuninterruptedservice andtracking subscriberusageforbillingandcharging [3]. Asimple4Gnetworktopologyisdepictedinfigure3.
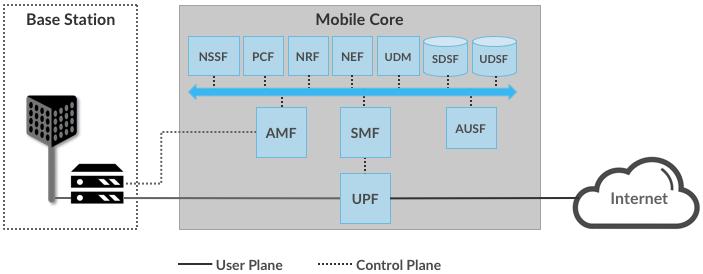
5G is the fifth generation technology standard for broadband cellular networks which cellular phone companies began deployingworldwidesince2019 [4]. The5Gnetworkistheplannedsuccessortothe4Gnetworkwhichprovideconnectivity to most current cellphones. The fourth generation mobile telephony system has drawbacks such as: high battery usage and expensive equipment requiredtoimplement nextgeneration network. The5G networksare notlimited to cellularnetworks only, but used as general internet service providers for laptops and desktop computers. It is also used for new applications such as internet of things (IoT) and machine to machine (M2M) communications The 5G system architecture is mainly composed of User Equipment (UE), Next Generation Node B (gNB or gNodeB) and Evolved Packet Core (EPC). UE is the cellulardevice,gNBisthebasestationfor5G,justaseNBisthebasestationfor4G,NodeBthebasestationfor3GandBTSthe basestationforGSMnetworks(2Gand1G).NextGenerationNodeB (gNB)isthe5GNR(NewRadio)RANandEPCisthe5G Mobile Core (NG-Core) Network The function of the RAN (Radio Access Network) is to provide radio access and harmonize cellular system resources through user equipment (UE). The 5G NR is the global air interface standard for 5G networks that wasdeveloppedby3GPPwithoperationalfrequencyfrombelow1GHztomorethan40GHz [5]. ThefunctionsofEPCnetwork istoprovidemobilitymanagement,IPconnection,QoSmanagement,andbillingmanagementtothesystem. ItconsistsofAMF (CoreAccessand MobilityManagementFunction), SMF (SessionManagementFunction),PCF (PolicyControl Function),UDM (UnifiedDataManagement),AUSF(AuthenticationServerFunction),SDSF(StructuredDataStorageNetworkFunction),UDSF (Unstructured Data Storage Network Function), NEF (Network Exposure Function), NRF (NF Repository Function), NSSF (NetworkSlicingSelectorFunction)andUPF(UserPlaneFunction)asdepictedinfigure4.
Antenna downTilt,ReceivedPowerandRadioPropagationplayparamountrolein thegood network performanceinmobile telephonybeit1G,2G,3G,4Gor5G.
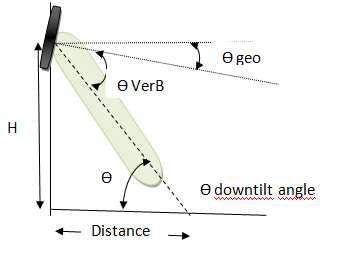
Antenna down-tiltingisa powerful methodforimprovingnetwork performancein cellularnetwork.Down-tiltingofantenna can improve certain performance aspects, especially those related to signal quality on the network. Utilizing the correct elevation angle on each cell in a cellular network is important to ensure that the signal level is maximized within the dominance area of a cell and minimized everywhere else. Consequently, by deploying the most appropriate tilt angle, the CarriertoInterference(C/I)ratiowithinthedominanceareaofacellismaximized,leadingtooptimumsystemperformance. However, constant network evolution due to variation of subscriber density and addition of new cells require on-going modification of the tilt angle to ensure that cell performance is constantly maximized. The optimum down-tilt angle with empiricalformulaofBaseStationsectorofmacro-celldependsontheGeometricalFactor andonAntennaVerticalBeam WidthFactor thiscanalsobeexpressedasθ-3dB foreitherMechanicalDown-Tilting(MDT)orElectricalDown-Tilting (EDT) [6]. Figure5showsMechanicalDown-Tilt.
TheGeometricalfactor,iscalculatedas
Where:
H=Transmitter(BTS)Height
hMS =MobileStation(MS)Height
Thedistancebetweenthetransmitter(BTS)Height,HandtheMobileStation(MS)Height,hMSisgivenby:
Where:
∆h=H hMS
Wu and Yuan (1996) method of calculating down-tilt angle as expressed in Equation 2. 1 either overestimates or underestimates the Base Station Sector down-tilt angle. From a simulation work performed using Monte Carlo approach; an empiricalequationforanoptimumdown-tiltangleselectionwasderivedwithastandarddeviationerrorof0.5corresponding to1to3degrees [7]. ThisderivationisexpressedinEquation2.5.
Thisvaluewasfoundtobeintherangeof3.5degreesto10.5degrees.
Where:
OptimumDown-TiltAngle
EffectiveHeightoftheBaseStation(BS),m
d=CellRadius,km
=AntennaHalfBeamPower,dB
Theformulaissimpleandfastincomputation;howeveritdoesnotgiveinformationaboutthecellinterferencearea.
2.2.1
a
Antennagainofbasestationforaspecificuserdependsonantennapattern,antennaorientation(azimuthandtilt)anduser’s coordinates with respect to base station. If α is the angle of Mobile Station (MS) location with respect to the minimum attenuation and β the antenna tilt angle with respect to the horizontal plane, r the distance between Mobile Station (MS) locationandtheBaseStation(BS);iftheBaseStationantennahasaheightofh,thenthemechanicalangletilt(verticalangle tilt)ofa3Dantennapatternwillbegivenas:
Theelectricalangletilt(horizontalangletilt)ofa3Dantennapatternwouldbegivenas:
Theaboveformula wasproposed usingantenna orientationgeometrymethod.Many Researchershaveall conductedstudies onantennadown-tilting [8]. Incoveragelimitedenvironmentssuchasinruralareas,mechanicaltiltingismoreusefulwhere asincapacity-limitedenvironmentssuch asinacitycentre,electricaldown-tiltcouldprovidebetterperformance Electrical tilt performed better than mechanical tilt in variation of the target Carrier to Noise Interference Ratio (CIR). Network performance was evaluated under different load in antenna down-tilting situation in Mobile Telecommunication Systems whereHata-Okumuramodelofpropagationwasapplied [9]. TheresultsindicatedlowerCIRatdistancesclosetoBaseStation (BS),duetothefactthatantennawasemittingitspowermoretothecellboundary.
TheReceivedPower( )ataMobileStation(MS)fromaBaseStation(BS)sectordependsontheTransmitPower ( ),the BS sector Antenna Gain, transmitter ( ), the handset Antenna Gain, receiver ( ), and the path loss (Lp). Using Friis transmissionequationsformobilecommunication,theReceivedPower( ),willbegivenforfreespacepathloss(FSPL)as: 2.8
λ= wavelengthinm
c= velocityofelectromagneticwavesinthefreespace(3*108m/s)
d=AntennaSeparationDistancebetweenTransmitterandReceiver(BaseStationandMobileStation)
f= CarrierFrequency,MHz
Inlogarithmicform,
Since 20log =20logd+20logf+32.45
ItshouldbenotedthattheGainhasaunitofdBwhilethePowerhasaunitofdBmordBW Itisassumedthat,theexpression in equation 2.13 has antenna gain of one, which implies that the antenna is completely Omni-directional, and radiating uniformly in all directions; this is an example of a purely isotopic antenna. But, there is no such thing as a purely isotopic antennainpractice.Assumingtheantennaneedsdowntiltingsinceitisaffectedby impedancemismatch,misalignmentofthe antennapointing,polarizationorabsorption;then,theReceivedPowercanbedeterminedbytheexpressioninequation2.14:
Where:
= the gain of the Base Station transmit antenna in the direction in which it sees the Mobile Stationreceiveantenna.
=thegainoftheMobileStationreceiveantennainthedirection( )inwhichitseestheBaseStation transmitantenna.
and =thereflectioncoefficientsoftheBStransmitandMSreceiveantennas,respectively
atx and arx = the polarization vectors of the BS transmit and MS receive antennas, respectively, taken in the appropriatedirections.
α=theabsorptionoftheinterveningmedium.
InanurbansettlementthemobilenetworkwouldbeaffectedbymultipathandoftentherewouldbeNoclearlineofsight,the averageratioofthereceivedpowertothetransmittedpowercouldbegivenby:
Where:
ˠ=PathLossExponentandrangesbetween2and8
Now
Considerasituationwherebythemobilenetworkisoperatinginanunobstructedarea,thereceivedpowerwouldbegivenby:
Since
TheaboveFriisTransmissionEquationshowsthatmorepowerislostathigherfrequenciesandhenceitissaidthatthepath lossishigherforhigherfrequencies.
The electromagnetic power received by an antenna system is determined by both the antenna efficiency and its receive diversity.Toincreasethereceivedpowerofanantenna system,severaldiversitytypescanbeutilized.Receivedpowerofan antenna system can be increased by combining space diversity, polarization diversity and frequency diversity. A square Microstripantennaona xy planehasaunidirectionaltransmitpatternatφdirectionandadirectionalcharacteristicatangleθ direction due to the existence of a ground plane [10]. Here the Microstrip antenna was designed so that the polarization is nearlycircular.
LetL,thelengthoftheantennathereforetheresonantfrequencyoftheantennacanbedeterminedby:
Thelengthoftheantennacanbederivedas:
Therighttrianglesatthediagonalcornersoftheantennaarecutoff,wherethelength,cofthetwosidesofthetriangleisequal andciscalculatedusing:
∆S=AreaoftheTriangle,whichcanbestatedas:
Where:
S=AreaoftheAntennaPatch
Q =QualityFactoroftheAntennaPatch
canalsobedeterminedusing:
Where:
=SkinDepth
ρ=ConductorResistivity
=ResonanceFrequency
=MediumPermeability
=EffectiveLossTangent
Theelectricalenergy atresonanceis
Where:
V0 =AntennaOutputVoltage
AccordingtoPozarandSchaubert(1995),theRadiatedorReceivedPower, canbecalculatedusing: = * ( ) ( )+
Where:
With
A=* + and B=* +
Sinceasquareantennaisused;a=b=L.
2.27
Radio propagation is the way radio signals are transmitted from one point to another inside the earth’s atmosphere or free space.Itspredictabilityisnever100%thatiswhystrongprobabilisticconceptscomeintoplaywhiletransmittingsignals The modeinwhichpropagationofradiowavesorsignalsisadapteddependsstronglyonthedistancebetweenthetransmitterand the receiver. These signals are predisposed or influenced by the objects in their path and the medium through which they propagate.
Inmobileradiosystems,pathlossmodelsarenecessaryforproperplanning,interferenceestimations,frequencyassignments andcellparameterswhicharethebasicfornetworkplanningprocessaswellasLocationBasedService(LBS)techniques.Path lossisthereductioninpowerofanelectromagneticwaveasitpropagatesthroughspace.Large-scalepropagationmodelsare propagation models that predict the mean signal strength for an arbitrary transmitter-receiver separation distance which is usefulinestimatingtheradiocoverageareaofatransmitter.Smallscalepropagationmodelsorfadingmodelscharacterizethe rapid fluctuations of the received signal strength over very short travel distances or short time durations. It is well known phenomena that cellular radio systems operate in urban areas where there is no direct line-of-sight path between the transmitterandthereceiverandwherethepresenceofhighrisebuildingscauseseverediffractionloss.Pathlossisimportant in wireless communications and signal propagation, it occurs due to free-space loss, refraction, diffraction, reflection, aperture-mediumcouplinglossandabsorption.Pathlossisalsoinfluencedbyterraincontours,environment(urbanorrural, vegetationandfoliage),propagationmedium(dryormoistair),thedistancebetweenthetransmitterandthereceiver,andthe heightofantennas.Thispathlossinwirelesscommunicationsisrepresentedbyvaluesknownaspathlossexponent.
Forpropagationinfreespace,pathlossexponentis2.
Forrelativelylossyenvironmentspathlossexponentis4
Forbuildings,stadiumsandotherindoorenvironments,thepathlossexponentcanrangebetween4and6.
Fortunnel(mayactasawaveguide),thepathlossexponentislessthan2.
Thefree-spacepathlossisdenotedbyLp (d), whichisgivenby:
Where:
c=VelocityofLight, =CarrierFrequency
d=DistancebetweenTransmitterandReceiver
Forlong-distancepathlosswithshadowing,thepathlossisdenotedbyLp(d),whichisexpressedas:
Equivalently,
Where:
n=PathLossComponent,
d0 =Close-TinReferenceDistance(Typically1KmforMacrocells,100mforMicrocells),
d=DistancebetweenTransmitterandReceiver
IncitiessuchasAccra, Johannesburg,Lagos,Kenya,Cairoetc wherethedensityofpeopleissohigh,anaccurate path lossor pathattenuationpredictionmodelwillbeofgreathelpforBTSorNodeBoreNodeBorgNodeBmappingforoptimumnetwork design.Themostsignificantpropagationmodelsprovidingthefoundationforcellularcommunicationservicesare [11]:
Hata-Okumuramodel
COST231model
ECC33model
Hata-Okumura Model
Okumura model is Radio propagation model that is used for Urban Areas and for signal prediction [12]. The frequency coverageofthismodelisintherangeof200MHzto1900MHzanddistancesof1Kmto100Km.Itcanbeapplicableforbase stationeffectiveantennaheights(ht)rangingfrom30mto1000m.Itisusedtomeasuretheradiosignalstrengthinbuildup areas.Itisaperfectmodelformeasuringradiopropagationincitieshavingdenseandtallstructure.
TheHatamodelisanempiricalformulationofthegraphicalpath-lossdataprovidedbytheOkumuraandisvalidoverroughly thesamerangeoffrequencies,150-1500MHz.Thisempiricalformulasimplifiesthecalculationofpathlossbecauseitisclosed form formula and it is not based on empirical curves for the different parameters. The Okumara-Hata model is the combinationofboththeabovemodels.
ThestandardformulaforempiricalPathLoss(PL),dBinurbanareasundertheOkumara-Hatamodelisgivenby:
PLdB=A Blog(d)
Where:
d=Distance,Km.
A=FixedLossDependsonFrequency,f
Theseparametersaregivenbyempiricalformula:
A=69.55 26.16logf 13.82log −α
B 44.9 6.55log
Where:
f=frequencymeasured,MHz
=heightofbasestationantenna,m
2.31
2.32
2.33
=heightofmobilestationantenna,m;
a( = CorrelationFactorindBm.
COST-231 Hata Model
Hata model is used for frequency range of 150 MHz to 1500 MHz to predict the median path loss for the distance d from transmittertoreceiverantennaupto20km,andtransmitterantennaheightisconsidered30to200mandreceiverantenna height is 1 to 10 m. COST stands for Co-operative for Scientific and Technical Research, this research work is an European initiative that came up with the COST 231 model. It is used to extend Hata-Okumura- model for personal communication system (PCS) applications operating at 1800 to 2000 MHz. COST 231 model is also initiated as an extension of Hata model which is used to predict the path loss in the frequency range 1500 MHz to 2000 MHz. This model provides simple and easy waystocalculatethepathlossevenathigherfrequencyrange(3.5GHz)duetoitssimplicityandcorrectionfactors.
ThestandardformulatocalculatepathlossinurbanareasunderCOST-231Hatamodelisgivenby:
ECC-33ModelisextrapolatedfromoriginalmeasurementsbyOkumuraandmodifieditsassumptionssothatitismoreclosely represents a fixed wireless access (FWA) system. The ECC 33 path loss model is developed by Electronic Communication Committee (ECC). The original Okumura model does not provide any data greater than 3 GHz. Based on prior knowledge of Okumuramodelanextrapolatedmethodisappliedtopredictthemodelforhigherfrequencygreaterthan3GHz.Inthismodel pathlossisgivenby:
Where:
A FreeSpaceAttenuation
A =BasicMediumPathLoss.
Gt BSHeightGainFactor
Gr ReceivedAntennaHeightGainFactor.
Theresearcherslimitedtheworkto3G;wherethecellulargenerationdensityisveryhighindevelopingcountriesascompare to4Gand 5G.Theargument for thiswork was based on COST-231 Hata propagationModel wheretheconnection frequency levelsrangebetween900MHz and2100MHz. Forthis work,a carrierfrequencyof 1800MHz(1.8GHz) wasemployed The environmentunderwhichdatawascollectedfortheresearchisurbansettlement;apathlossexponentof3-3.5underpinned thework.Thedistancerangeofthemodeladoptedisbetween1.5to2.5kmandthebasestationantennaheightsrangingfrom 30mto45m.TheReceivedPowerattheMobileStationfromeachBaseStation(BS)sectordependedontheTransmitPower, the BS sector Antenna Gain, the handset Antenna Gain and the Path Loss. The researchers used three sectorised antenna directionsandantennaazimuthorientation.Thebestconfigurationforathreesectorisedsitewouldbe00,1200 and2400 and the worst is 900, 2100 and 3300. The objective of the research is to demonstrate how antenna down-tilting can improve networkcoverageareaandincreasethereceivedpoweratthemobilestation.
Thissectionofthepaperdiscussedtheoptimumdowntiltanglebetweensitesofbasestationselectedfortheresearch. Drive testingmechanismmethodwasusedtocollectdataforthework.
The optimum down tilt angle is mainly a function of the site-to-site distance, base station antenna height and the vertical beamwidthofthatantenna.Theoptimumdowntiltanglerangevariesbetween30 and60 forsite-to-site,distancesbetween1.5 and2.5km,basestationantennaheightsbetween30 and34m. Theoptimumdowntiltangledecreasesasthesiteseparation increasesandincreasesastheantennaheightincreases.Thechangeofoptimumtiltangleismoresensitivetoantennaheight changesthantosite-to-sitedistancemodifications.
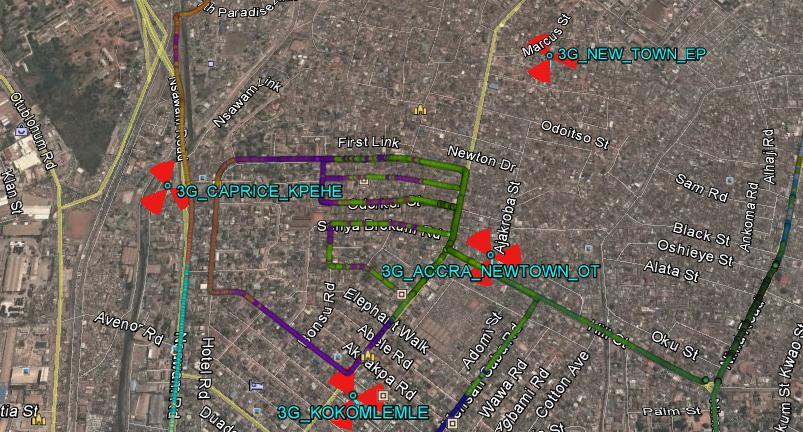
Themeasurementmechanismforthestudywasbasedonthedrivetestingsystem.DriveTestingisamethodofmeasuringand assessing the coverage, capacity and Quality of Service (QoS) of a mobile radio network. The drive test is also a procedure adopted in cellular networks for all the available technologies (CDMA, GSM, UMTS, LTE, 5G NR etc.) which involve collecting dataonamovingvehicle.Itisconductedbychecking coveragecriteriaofacellsitewithRadioFrequency(RF)drivetesttool. The following are the tools that were used for the drive test: Laptop with drive test software and Global Positioning System (GPS) connection capability and data cables, multi-connector port, Vehicle, Drive test Mobile Phone, GPS device, Extension board, M2000, MapInfo, Google Earth, Inverter and Probe (software uses for data analysis). The data collected by drive test toolasLogfileswasanalyzedtoevaluatevariousRF parametersofthenetwork.Theprocedureallowedthecellularnetwork operators (theresearchers) toexamineandevaluatethe network coverageinparticulargeographical areas,putinmeasures toimproveonit.Thegeographicalareasadoptedfortheresearchwere:AccraNewton_OT,AccraNewton_EP,Caprice_Kpehe, andKokomlemlecellsites.Thesesitesareindicatedin figure6;thedrivetestroutes TheKeyPerformanceIndicators(KPIs) thatwerecapturedduringthedrivetestingprocedurewereReceivedSignalCodePower,RSCP(ReceivedPower)dataindBm, andSignal–To-NoiseRatio(EC/NO)orSignal-To-Interference-Ratio(Ec/Io)
Themeasurementsetupwasdesignedtocollectenoughdatatoenabletheresearcherstoextractthetypicalbehaviourofthe channels in a cluttered environment, such as urban, areas. The measurements were done while driving using the drive test terminalinsidethevehicle.Thedrivetestterminalfittedwiththesoftwaretocollectdataatthevarious3Gsitesasthevehicle wasmoving.Datacollectedwasgroupedbycollectionsoftwareandstoredinanoutputfiles.Thedatastoredintheoutputfiles was skillfully sieved and processed with the help of Microsoft office Excel Sheet and finally by the probe software (software assistantusedfordataanalysis).
TheGPScollectedthedataoflatitudeandlongitudeofeachpointasshownintable1Itwasalsousefulasaguideforfollowing thecorrectroutes.GoogleEarthhelpedintracingtheroutesusingtheeasypathsorpolygons.Themobilephoneperformed or made calls to a specific number from time to time, configured in the Collecting Software. The calls test were two types: long andshort durations.Theaverageshort callsdurationwas180seconds.Itonlyservedto check whetherthecallswere being establishedandsuccessfullycompleted.Longcallsduration(10-15mins)servedtoverifyifthehandovers(continuitybetween the cells) of the network were working effectively or were dropping call, possibly caused by antenna not aligning well and neededdowntilting.
Where:
E_(0)=ElectricalTiltAngle
M_(0)=MechanicalTiltAngle
After the initial analysis of the drive test, it was observed that Accra Newton_EP site was functioning fairly well. Accra Newton_OT,Caprice_KpeheandKokomlemlesiteswerehavingdifferentshortcomings.AccraNewton_OTandCaprice_Kpehe neededadjustmentonthemechanicalantennaangle.Itwasalsodetectedthat,theirazimuthshaddeviatedtotheworstvalues (90 /210 /330 ) and needed to be rectified. Electrical and Mechanical antenna angles downtilting were needed at Kokomlemlesite
Theanalysis afterthedrive test indicatedthat,the receivedpower (RSCP)andsignal-to-interferenceratio(EC/IO) weregood alongtheroutesandserviceareaswhereAccraNewton_EPsite,issituated.Hence,thesitewasfunctioningwellandtherefore therewasnoneedforanyalterationonitsparameters
The analysis also indicated good received power (RSCP) along the routes where Accra Newton_OT and Caprice_ Kpehe sites aresituated However,thetwositesexhibitedcharacteristicsofovershootingresultingfrombadsignal-to-interference(EC/IO) and creating call drops problems along the catchment areas of the sites. Therefore mechanisms of antenna down-tilting and azimuth change of the affected sites were implemented in order to improve the signal situation. Accra Newton_OT and Caprice_ Kpehe sites’ azimuth were changed from 90/210/330 to 70/220/310 degrees. Mechanical antenna downtilt angle from 00 to 3.50 and electrical antenna downtilt angle from 40 to 50 were effected at Caprice_ Kpehe cell site. On Accra Newton_OTcellsite,30 wereaddedtothemechanicalantennadowntiltangle.
Kokomlemlesiteexhibitedcalldropsandcongestionemanatingfromimproperhandoverstheanalysisrevealed.Torectifythe problem both mechanical andelectrical antenna downtiltingwerecarried out after antenna heightshiftingupwardhasbeen done. Both mechanical and electrical antennas down tilts were increased by 20 while the antenna height was shifted by two metres (34/31/31) upwards These adjustments improved the received power and the overall quality of service at the catchmentareasofthesite Table2depictedtheparametersofthesitesafterthechangeswereeffected.
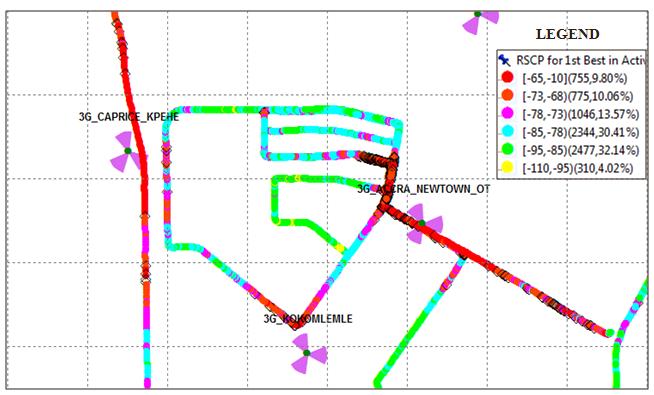
Afterthechanges,drivetestwasconductedagainattheaffectedsitestocheckonthereceivedpower(RSCP)andthesignal-tointerference ratio (Ec/Io) levels. It was observed that, there were vast improvement in these two KPIs A plot of the drive testing statistical data of the received power after the adjustments of the parameters of the three cell sites is illustrated in chart1 Thereceivedpowerchartclearlyindicatedthat,thecountsmainlyfellwithingoodRSCPrangeofabove-95dBmalong thepathswherethetestwascarriedout.Insimpleterm,thereceivedpowerforthethreesitesweregood.
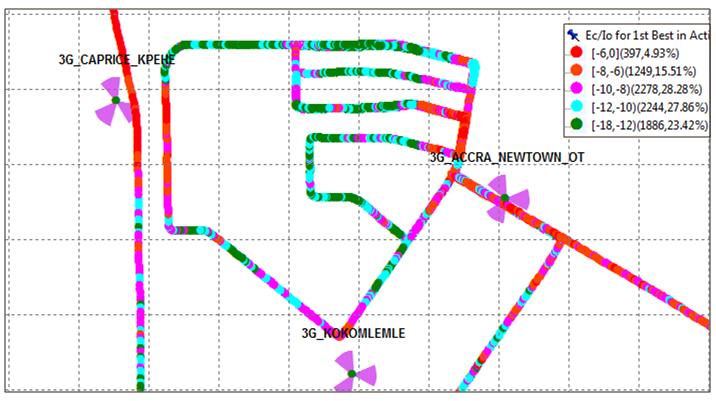
Therewassignificantimprovementinthequalityofservice(enhancedcoverageareaandgeneralnetworkperformance)atall thethreesites.Chart2,showsaplotofsignal-to-interferenceratio(Ec/No)statisticaldatacapturedafterthechange.Itcould be seen clearly that, statistical data recorded counts fell mainly within the good range of aggregate Ec/Io level (Aggregate Ec/Iolevelpoor<-12dB).Insimpleterm,thesignal-to-interferenceratio(Ec/Io)forthethreesitesweregood.
In this research, the impact of antenna down-tilt on the performance of cellular network has been studied. Extensive drive testingmeasurementswereperformedin urbansettlementenvironment.Antennadowntiltingisveryimportantinthelifeof anycellularsiteirrespectiveofthetechnologyused(GSM,CDMA,UMTS,LTE,5GNRetc),withoutit,cellularnetworkproblems suchascongestion,pilotpollution,dropcallsandmanyotherswouldcontinuetoplaguethecellularcommunicationindustry.
After the adjustment of the parameters, the received power at the mobile station became efficient and the impact at the cell siteswasexcellent.Thebasestationsiteswherethechangeswereeffectedhadtheiroptimumdowntiltanglethatculminated tohavingbettercoveragecapacity.Itshouldbewellnotedthatthetwoconceptsofantennadowntiltingnamelyelectricaland mechanical downtilting have been used to resolve network problems at the three sites In down-tilting, a less co-channel interferenceisobservedforfar-endusers,thiscontributestohighlyincreasesystemcapacitybutincontrastdecreasethecell serviceradius.
This study used large volumes of real drive test data to project the behaviour of the radios. Meaningful data was extracted from this enormous drive test data to statistically analyse the received power and signal-to-interference ratio to predict the user pattern and identify coverage and capacity challenges. Every technology is underpinned by theories or models, mobile communicationsisnoexception,COST-231Hatamodel andFriisEquationsfindingswereofrelevantforthis work.Although theseexperimentswereconductedseveralyearsago,theirdiscoveriessuchas:antennaheight(30to100m),siteradius(1to 100Km)andcarrierfrequency(900to2100MHz)arestillrelevanttotoday’scellularnetworkplanningandmanagement
[1]E. Benner,andA.Sesay,''EffectsofAntennaHeight,AntennaGainandPatternDowntiltingforCellularMobileRadio''.IEEE Tr.OnVehicularTechnology,Vol.45,No2,1996
[2]Sheikh,M.U.,Lempiainen,J.&Jäntti,R.ArgumentsforOneRadioAccessNetwork(OneRAN)MobileInfrastructure. TelecommunSyst 80,477–486,Jun3,2022.
[3]Peterson,L.and Sunay, O.,BasicArchitecture.In 5G Mobile Networks:ASystemsApproach Cham: Springer International Publishing.pp.17-29,2020.
[4] Gallagher, J.C. and Devine, M.E., Fifth-Generation (5G) Telecommunications Technologies: issues for Congress. CongressionalResearchService,1(30),pp.1-39,2019.
[5] Nguyen Huu Trung, Multiplexing Techniques for Applications Based-on 5G Systems Jan 6, 2022, Available: https://www.intechopen.com/chapters/79928,[Accessed:Jan12,2023].
[6]JYang,OptimalBaseStationAntennaDowntiltinDownlinkCellularNetworks,2018·
[7]Dotche, K.A., Sensitivity ofReceivedPowerinAntenna Down-TiltinClutteredMobileEnvironmentsa CaseStudyof West AfricaTelecomIndustry(Doctoraldissertation),2010.
[8] Amer, R., Saad, W. and Marchetti, N., Toward a Connected Sky: Performance of Beamforming with Down-Tilted Antennas forGroundandUAVUserCo-Existence.IEEECommunicationsLetters,23(10),pp.1840-1844,2019.
[9] M. Hata, ''Empirical Formula for Propagation Loss in Land Mobile Radio Service,'' in IEEE Transactions on Vehicular Technology,Vol.VT-29,No.3,Aug1980
[10]PrachiDwivedi,DevkantSen,Micro-StripAntennaDesignfor5GSub6GHzandWi-FiApplications,Sept3,2022
[11]Sabharwal,Mukesh;Kumar,VijayandBansal,Mohit,ComparativeAnalysisofDifferentParametersinPropagationModel forMobileCommunicationSystem,Oct19,2017.
[12]Ibhaze,A.E.,Imoize,A.L.,Ajose,S.O.,John,S.N.,Ndujiuba,C.U.andIdachaba,AnEmpiricalPropagationModelforPathLoss Predictionat2100MHzinaDenseUrbanEnvironment.IndianJournalofScienceandTechnology,10(5),pp.1-9,Feb2017.