
International Research Journal of Engineering and Technology (IRJET) e-ISSN: 2395-0056
Volume: 13 Issue: 04 | Apr 2026 www.irjet.net p-ISSN: 2395-0072
International Research Journal of Engineering and Technology (IRJET) e-ISSN: 2395-0056
Volume: 13 Issue: 04 | Apr 2026 www.irjet.net p-ISSN: 2395-0072
Venkatesh Daggupati1, Siva Nga Sai Jammula2
1Electrical Engineering at Texas Tech University, Lubbock, Texas, USA
2Electrical Engineering at Worcester Polytechnic Institute, Worcester, Massachusetts, USA
Abstract - To provide stability and a continuous supply of power, the detection and classification of faults in the trans- mission lines (TLs) are critical and vital in this modern age. Ensuring the stability of power systems hinges on effective error detection and classification within transmission lines (TLs). While strategies like the Extreme Learning Machine (ELM) algorithm have demonstrated effectiveness, their adaptability to diverse error situations remains a concern. Prioritizing error variety is essential for enhancing adaptability to real-world conditions, finally reinforcing the resilience of the power grid. Building upon the ELM algorithm, this undertaking advocates integrating deep learning techniques to improve error detection and classification in TLs. Through this approach, capitalizing on deep learning ‘s capability to autonomously discern complex and detailed patterns, potentially leading to more exact and true defect identification. Additionally, the undertaking extends beyond algorithmic improvements to encompass growing and refining datasets, vital for enhancing error detection system dependability Real-time implementation plans are moreover examined to evaluate adaptability in dynamic operational environments. By embracing error variety and harnessing deep learning, this assignment aims to deliver a sturdy and resilient and flexible defect detection and classification framework, poised to excel in real-world applications and enhance modern power system resilience.
Key Words: Fault Detection, Fault Classification, Deep Learning, Extreme Learning Machine (ELM), Fault Diversity, Power Systems stability
Inthe presentandexisting era ofIndustry 4.0, the electrical powerdemandis risingcontinuously.To fulfill the demand,the numberofpowergenerationunitsismoreovergrowing.Alltheseunitsarelinkedthroughacomplicatedpowersystemnetwork (PSN), which has essentially three important and significant components: power generation, transmission, and distribution. Poweristransferredfromoneplacetoanotherplacethroughthetransmissionlines.Reliableandstableoperationofthepower systemisvitalandcrucialtominimizingitsimpactsonsector,business,transportation,anddomesticsectors.Oneofthemost crucialandvitalaspectsthathinderthecontinuoussupplyofelectricityandpowerisanerrorinthepowersystem.
InthepresentandexistingeraofIndustry4.0,theelectricalpowerdemandisgrowingcontinuously.Tofulfillthedemand, the numberofpowergenerationunitsisfurthermoregrowing.Alltheseunitsarelinkedthroughacomplicatedandintricatepower systemnetwork(PSN),whichhasessentiallythreeimportantandsignificantcomponents:powergeneration,transmission,and distribution.Poweristransferredfromoneplacetoanotherplacethroughthetransmissionlines.Reliableandstableoperation ofthe powersystemis necessaryandfundamental to minimize its impactsonsector,business,transportation, anddomestic sectors.Oneofthemostsignificantandessentialaspectsthathinderthecontinuoussupplyofelectricityandpowerisadefect inthepowersystem.Mostoftheinquiryiscompletedinthedomainofprotectiverelayingofpowersystems.However,actuating the relay is time-consuming and this operation can be made quicker applying machine learning (ML). ML is broadly used in every aspect of life because of the availability of relevant data. Using available defect data such as error voltage and contemporary and ongoing a ML model can be trained to identify and sort new instances. In the area of power systems, researchershaveconcentratedondetectingandcategorizingfaultsapplyingdistinctDeepLearning(DL)andMLalgorithms
International Research Journal of Engineering and Technology (IRJET) e-ISSN: 2395-0056
Volume: 13 Issue: 04 | Apr 2026 www.irjet.net
p-ISSN: 2395-0072
The literature on advanced defect detection in transmission lines presentsamixedandassortedarrayofmethodologiesand technologies aimed at bolstering power system dependability and resilience. Machine learning algorithms, incorporating supportvectormachines(SVMs),decisiontrees,andneuralnetworks,havebeenthoroughlyinvestigatedfortheireffectiveness inerroridentificationandclassification.
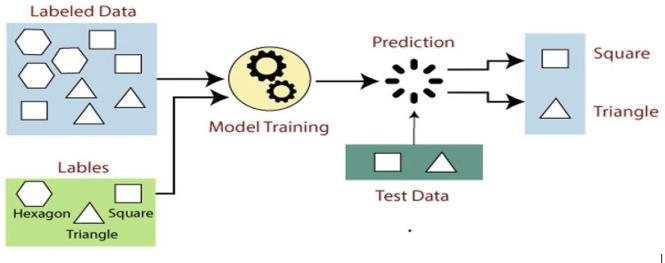
Figure 1: Scheme of supervised learning, showing labeled data used for model training and predictions on test data
SVMs, renowned for their capability to handle high- dimensional data and nonlinear connections, exhibit resilient defect detection performance by mapping input data into higher-dimensional spaces. Decision trees offer clear defect classification frameworks, assisting operators in understanding underlying decision-making procedures and fundamental defect detection features Deep learning techniques, such as convolutional neural networks (CNNs) and recurrent neural networks (RNNs), demonstrate notable potential inerrordetectionapplications.CNNsexcel inidentifyingsophisticatedand multifacetederror patternsacrossdissimilardefectclasses,especiallyinimagerecognitionactivities,whileRNNsareadeptatmodelingsequential data and temporal dependencies for error prediction. Additionally, Extreme Learning Machines (ELM) have emerged as a hopeful and encouraging avenue for defect detection, characterized by their simplicity and fast learning abilities. Unlike conventionalneuralnetworks,ELMalgorithmsstreamlinetrainingprocedures,arisinginenhancedgeneralizationperformance. IntegratingInternetof Things(IoT)technologieswith machinelearning enablesreal-timedefectdetectionby collectingdata fromtransmissionlinesandanalyzingitforanomalies.Advancementsindetectingtechnologies,suchasphasormeasurement units(PMUs)anddistributedsensors,contributetoenhanceddefectdetectionandlocalizationinsmartgrids.Renewableenergy integration poses unique obstacles for error detection, requiring responsive and versatile algorithms capable of dynamically adjusting to changing grid dynamics. Innovations leveraging blockchain and augmented actuality enhance error detection system dependability and visualization during upkeep processes. Additionally, transfer learning techniques have been investigatedtoleverageexistingknowledgeanddataforimprovederrordetectionabilitiesintransmissionlines.
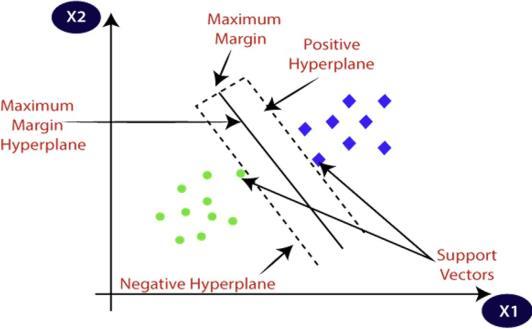
Figure 2: Illustration of SVM Classification in a Two-Dimensional Space
3. PROPOSED FRAMEWORK FOR FAULT DETECTION AND FAULT CLASSIFICATION
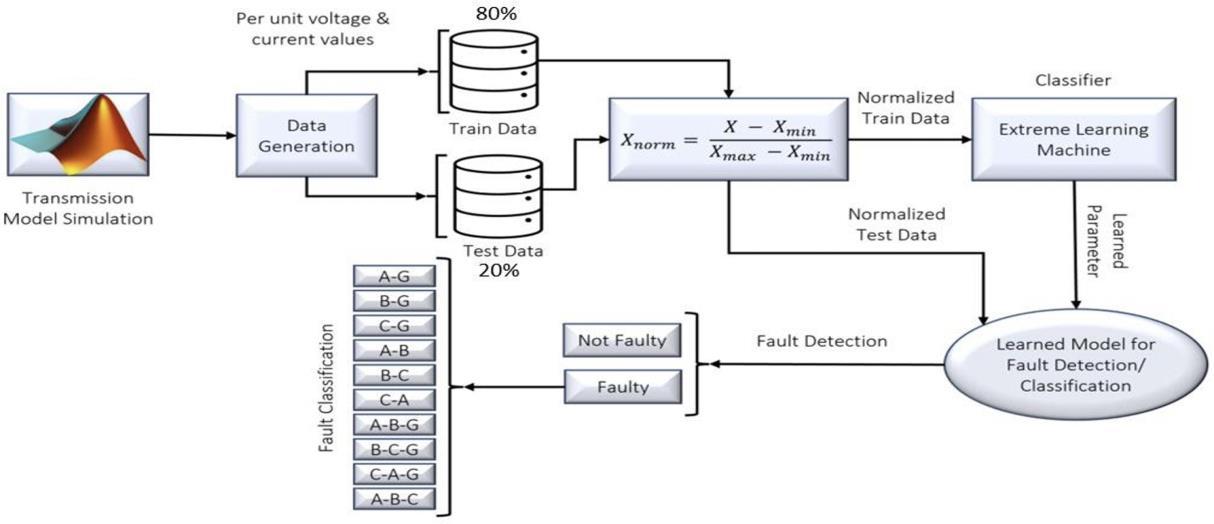
Inthisstudy,aninnovative deeplearning-basedframework fortransmissionline errordetectionandclassificationhasbeen
developed, as illustrated in Fig. 1. A long-distance transmission line system was modeled utilizing MATLAB/Simulink, comprisingofsynchronousmachines,a13.8/735kVtrans-former,andvariousandseveralRLCloadslinkedthrough300km lines.
International Research Journal of Engineering and Technology (IRJET) e-ISSN: 2395-0056
Volume: 13 Issue: 04 | Apr 2026 www.irjet.net
p-ISSN: 2395-0072
Usingaprogrammabledefectblock,abroadrangeoffaultswasgenerated,comprisingLG,LL,LLG,LLL,andLLLG,alongwith healthy conditions. The corresponding three-phase voltage and contemporary and ongoing waveforms were collected and saved.Faultdatawerecapturedatthetimeofthedisturbance,whilenormaldataweresampledunderstablerunningconditions. Thedatasetwasthensplitintotrainingandtestingsets,followedbymin–maxnormalizationtoscalefeatureswithinacorrected range.Finally,a Convolutional Neural Network (CNN) wastrained for multiclasserrorclassification, and the outcomeswere comparedwithconventionalandcustomarySVMandELMmodelsinconditionsofaccuracy,dependability,andcomputational intricacy.Eachstepoftheframeworkisdescribedinthesubsequentsubsections.
The proposed framework was executed in MATLAB/Simulink, where two standard and normal transmission line (TL) configurationsweremodeledtoreproducerealisticlong-distancepowertransfer.Thesemodelsrepresentedsystemsinwhich energy generated in one region is communicated to distant loads. In real-life systems, loads are generally a combination of resistive (R), inductive (L), and capacitive (C) components; nonetheless, for simplicity, equivalent single RLC loads were evaluatedinthisstudy.
Table 1: MAIN SYSTEM PARAMETERS
Component Parameters
Synchronous machine
6 × 350MVA,13.8kV,initializedat1500 MW
Transmissionline Three-phase,300km
Transformer 13.8/735kV,6 × 350MVA
Source 30,000MVA,735kV
Loads 100MW,330MW,250MW
To increase system intricacy and realism, the two TL models were combined into a single integrated simulation block. This compositesystemincludedthreegenerationunitsandfourRLCloads,witheachtransmissionlinespanning300km.Faultsof allimportantandsignificanttypes;singleline-to-ground(LG),line-to-line(LL),doubleline-to-ground(LLG),three-phase(LLL), andthree-phase-to-ground(LLLG);weretriggeredemployingaprogrammabledefectblock.Theblockenabledcontroloferror type, inception time, and location. The per-unit voltage and contemporary and ongoing wave- forms were saved for every situation,offeringdataforfurtheranalysis.
International Research Journal of Engineering and Technology (IRJET) e-ISSN: 2395-0056
Volume: 13 Issue: 04 | Apr 2026 www.irjet.net
p-ISSN: 2395-0072
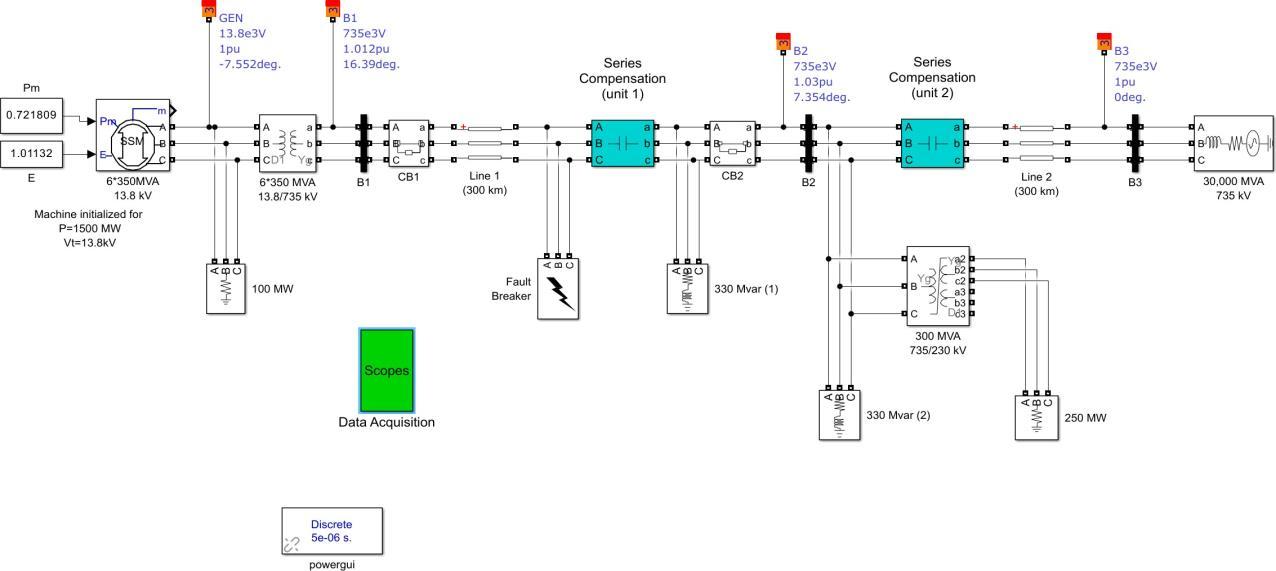
Figure 4: Simulink block model of the transmission line system featuring a connected fault block
Thesimulationensuredthatthedatasetcapturedbothhealthyanddefectiveandflawedconditions.Faultdatawererecorded exactly at the disturbance intervals, while no-fault data were sampled at random under stable operation. Each generated sample consisted of six features:three per-unit phase voltagesand three per-unit phase currents. This process produced a balanced dataset across all classes, covering a broad spectrum of running states. This structured simulation and data generationprocedureguaranteedthattheproposedframeworkhadentrytoarichandmixedandassorteddataset,allowing thedeeplearningmodeltolearnresilienterrorsignaturesapplicabletoreal-worldpowersystemsituations.
Thesignalschosenfordatacollectionwerethethree-phasevoltages(Va,Vb,Vc)andcurrents(Ia,Ib,Ic)fromthetransmission linemodel.Thesimulationwasrunfor0.2seconds,longenoughtocapturebothhealthyoperationandtemporaryresponses during error events. Faulty waveforms were extracted at the instant of disturbance, while non-fault (healthy) data were sampledatrandomintervalsundersteady-stateconditions.
Toobtain the data, the measuredsignalswere exportedfrom Simulink scopesinto the MATLAB workspace.Currents were savedunderthevariableI(xyz)andvoltagesasV(xyz)inastructuredtime-seriesformat.Thesewerethenreorganizedwere retained for analysis. Each data segment was then labeled with its respective fault type. A numeric coding scheme was introducedtomapclassestointegerlabels(e.g.,No-Fault=0,LLL=1,LLLG=2,LLG=3,LG=5,LL=6,etc.),asillustratedin Table1.ThisstructuredlabelingallowedCNNtoeasilyassociaterawwaveformswiththeircategoriesduringtraining.
Thedatasetwassubsequentlypreprocessedtoenhancelearningperformance.Noiseanddiscrepancieswereremovedduring cleaning,andthenmin–maxnormalizationwasappliedsothatallfeaturesweremappedintotherange[0,1].
Table 2: BINARY REPRESENTATION OF FAULT TYPES
AandGround)
Band Ground)
CandGround)
AandPhase B)
Band PhaseC)
CandPhaseA)
PhasesA,Band Ground)
PhasesB,Cand Ground)
PhasesC,Aand Ground)
International Research Journal of Engineering and Technology (IRJET) e-ISSN: 2395-0056
Volume: 13 Issue: 04 | Apr 2026 www.irjet.net p-ISSN: 2395-0072
Thisstepwasnecessaryandfundamentaltoavoidscalebiasandensureuniformcontributionofallfeatures.Themathematical representationis:
whereXistheoriginalfeature,andXmin,Xmaxarethe minimumandmaximumvaluesofthatfeature.Thefinaldatasetwas balancedacrossallclasses(10faulttypes+1no-fault)topreventbiastowardanysinglecategory.Fortrainingandevaluation, thedatasetwaspartitionedinto80.
By following this thorough and meticulous pipeline; signal extraction, temporary separation, labeling, normalization, and balancedpartitioning;theprepareddatasetsuppliedastronganddurablefoundationfortrainingtheCNN.Thisensuredthat the classifier could generalize effectively to invisible fault situations and deliver high-accuracy defect detection and classification.
TheproposedframeworkemploysaConvolutionalNeuralNetwork(CNN)asthecentraldeeplearningarchitecturetodetect andcategorizetransmissionlinefaults.CNNswereselectedbecauseoftheirsuperiorcapabilitytocapturespatialandtemporal correlationswithinmultivariateelectricalsignals,permittingthenetworktolearnfault-specificpatternsdirectlyfromtheraw voltageandcontemporaryandongoinginputs.Unlikestandardprocedures,whichdependheavilyonmanualfeatureextraction, CNNsautomaticallyrecognizehierarchicalfeaturesthatdistinguisherrorcategorieswithminimalpreprocessingeffort.
TheCNNarchitectureconsistsofthefollowinglayers:
1. Input Layer: Receivessixnormalizedfeaturespersample(three-phasevoltagesandthree-phasecurrents).
2. Convolutional Layers: Apply several filters to detect localized patterns such as abrupt drops in voltage or surges in current triggered by faults. These filters slide across the input, making feature maps that highlight distinctive electrical behaviors.
3. Pooling Layers: Max pooling was utilized after convolutional layers to reduce the dimensionality of feature maps,
International Research Journal of Engineering and Technology (IRJET) e-ISSN: 2395-0056
Volume: 13 Issue: 04 | Apr 2026 www.irjet.net p-ISSN: 2395-0072
suppressnoise,andimproveinvariancetosmallsignalchanges.Thisreducescomputationalintricacywhilemaintainingthe mostsignificantandessentialfeatures.
4. Fully Connected Layers: High-level reasoning layers that integrate features from earlier stages and learn non- linear combinationsforclassification.
5. SoftMax Output Layer: Produces probability distributions over all defect types (10 error categories +1 no- fault), assigningthemostanticipatedclasslabelforeachsample.
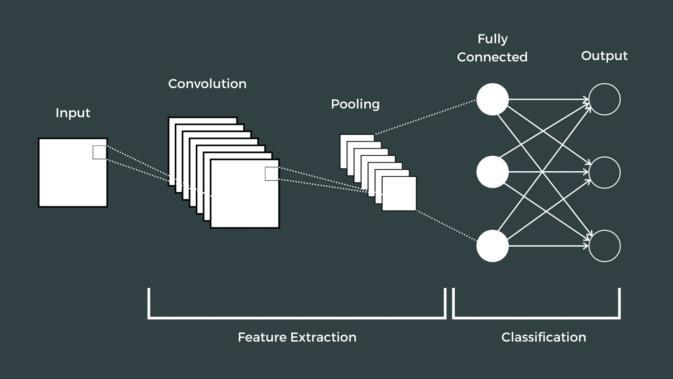
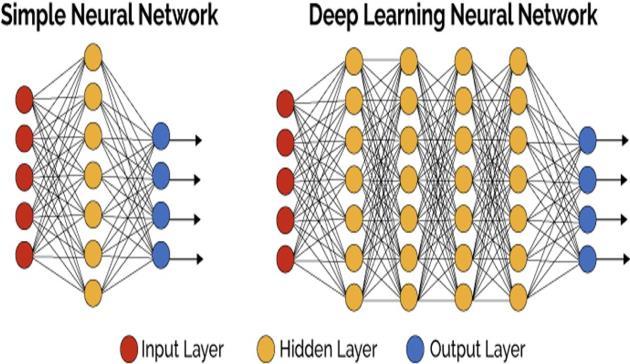
Figure 6: (a) Convolutional Neural Network for Fault Detection and Classification. (b) Comparison of simple neural network and deep learning neural network architectures.
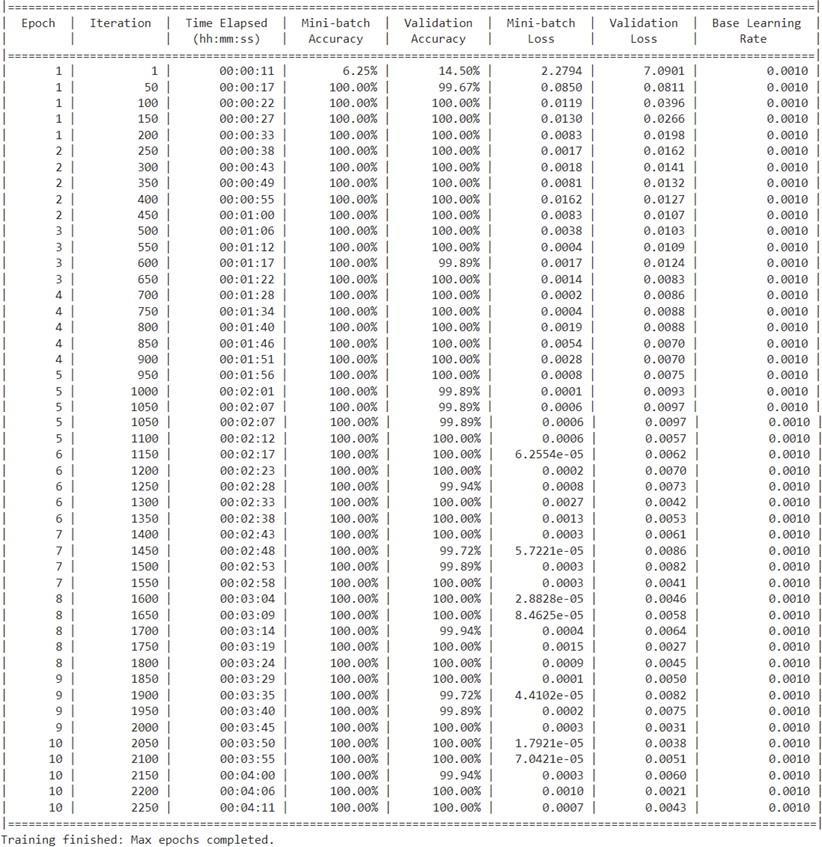
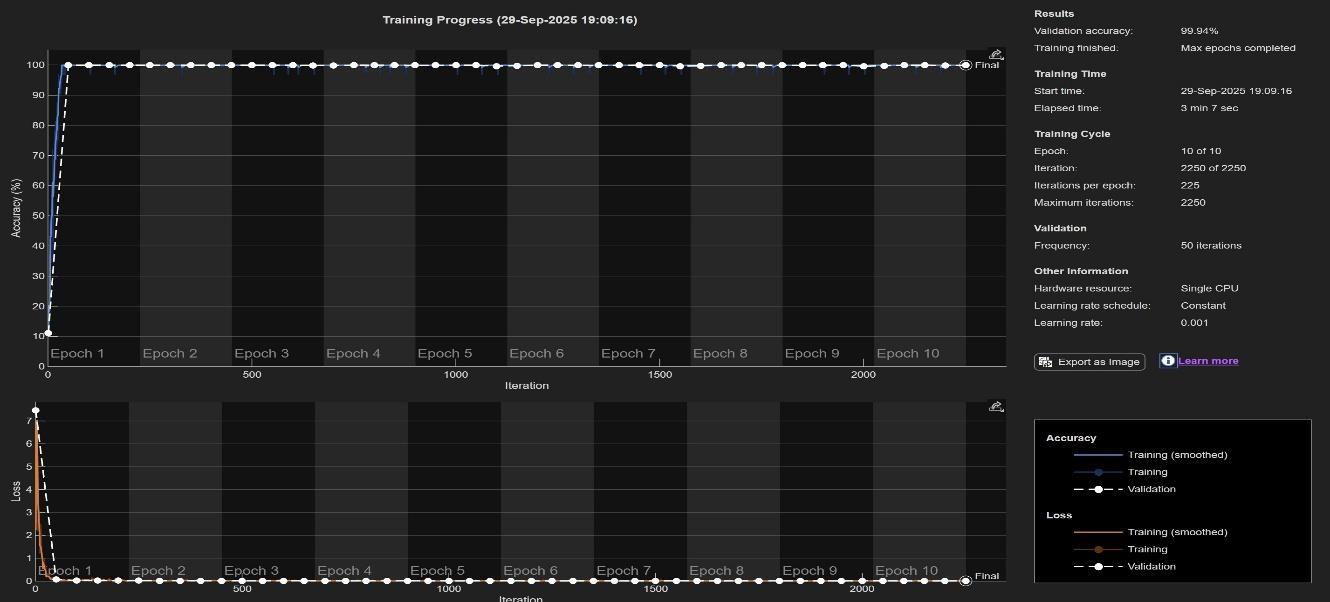
Fortraining, the datasetwasdividedinto80%training and20%testingsubsets,witha portionofthe training data usedfor validation.ThemodelwasoptimizedbyapplyingtheAdamoptimizerwithalearningratetunedforstability,amini-batchsize of32,and10epochsoftraining.Duringtraining,themodelparameterswereupdatedapplyingbackpropagationandgradient descent,minimizingthecross-entropylossbe-tweenpredictedandtrueclasslabels.Performanceobservationwascarriedout ingenuinetimebymonitoringaccuracyandlosscurves.Astrainingprogressed,theaccuracyincreasedconsistentlywhilethe lossdecreased,confirmingtheCNN’scapabilitytomeeteffectively.Validationinspectionswereintegratedtodetectoverfitting. Aftertraining,predictionsweregeneratedforthetestsetandassessedapplyingaconfusionmatrix,whichrevealednear-perfect classificationacrosserrorkinds.ThemodelfurtherdemonstratedhighdependabilitythroughROCcurveanalysis,generating anareaunderthecurve(AUC)of0.94.
Overall, CNN accomplished a classification accuracy of 98.9%, compared to 84.9% for SVM, presenting its superiority in capturingerrorvariety.Byintegratingconvolutionalfilters,pooling,andnonlinearreasoning,theCNNmodelsuppliedarobust, scalable, economical and cost-effective instrument for real-time error detection and classification in power transmission systems.
TheproposedCNNframeworkwasevaluatedutilizingathoroughsetofstatisticalperformancemeasures.Theseincluded classificationaccuracy,precision,recall,F1-score,confusionmatrixanalysis,andReceiverOperatingCharacteristic(ROC) curveevaluation.Together,thesemetricsensuredbothworldwideandclass-wiseevaluationoftheerrordetectionand classificationtask.
Theaccuracy(Acc)wascalculatedastheproportionofcorrectlyclassifiedsamplestothetotalnumberofsamples:
whereTP,TN,FPandFNrepresenttruepositives,truenegatives,falsepositives,andfalsenegatives,respectively. Precision(P)andrecall(R)wereemployedtoevaluatethemodel’sabilitytocorrectlydetectfaultystatesandavoidfalse alarms:
International Research Journal of Engineering and Technology (IRJET) e-ISSN: 2395-0056
Volume: 13 Issue: 04 | Apr 2026 www.irjet.net p-ISSN: 2395-0072
TheF1-score,whichbalancesprecisionandrecall,wascomputedastheharmonicmeaningofthetwo:
These equations provide a full and comprehensive statistical perspective, notably in multiclass classification where specific defectkindsaremoretoughandarduoustodetect.
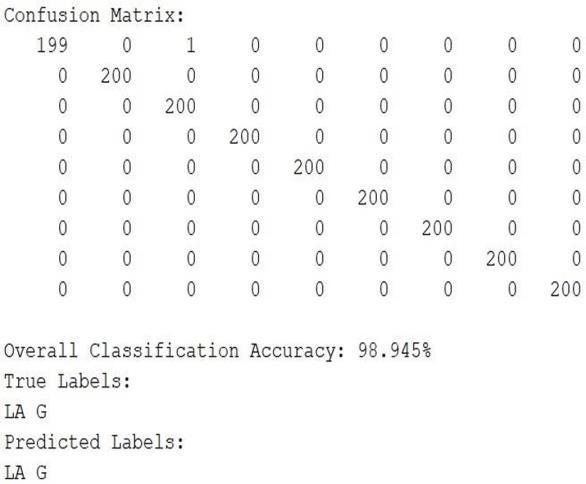
TheconfusionmatrixrevealedthattheCNNachievednearlyperfectclassificationacrossall11categories(10faulttypes +nofault), with very few misclassifications. In comparison, the SVM baseline model exhibited notable confusion among unsymmetricalfaultssuchasLGandLLG.Tofurthervalidaterobustness,ROCcurveswereplottedforeachclass,andtheoverall area under the curve (AUC) was measured at 0.94, demonstrating strong generalization and high sensitivity across fault categories.
Fromanumericalstandpoint,theCNNattainedaclassificationaccuracyof98.9%,substantiallygreaterthanthe84.9%obtained by SVM. High precision, recall, and F1-scores across all error classes verified the CNN’s dependability in differentiating symmetrical(LLL,LLLG)andunsymmetrical(LG,LL,LLG)faults.Additionally,trainingandvalidationcurveswereanalyzedto track convergence. The training accuracy increased consistently over 10 epochs, while both training and validation losses decreased,indicatingstablelearningwithoutoverfitting.ThistrendvalidatedthattheCNNsuccessfullygeneralizedtoinvisible testdatawhilemaintainingrobustness.
Overall,theevaluationdemonstratedthattheproposedCNNframeworkisasturdyandresilient,scalable,andproductiveand effective instrument for real-time defect detection and classification in modern power transmission systems, outperforming traditionalmachinelearningproceduresinbothaccuracyandconsistency.
The proposed CNN-based framework was confirmed applying MATLAB/Simulink simulations and assessed through comparative experiments with traditional classifiers. The out- comes are presented in four aspects: waveform analysis, CNN trainingresults,statisticalmetrics,andcomparativeevaluation.
1) Simulation Results: Thetransmissionlinemodelproducedthree-phasevoltageandcontemporaryandongoingsignals underbothhealthyandimperfectandmalfunctioningconditions.Eacherrortypedemonstrateduniquetransientfeatures.For instance, during a single line-to-ground (LG) defect, the faulted phase voltage collapsed to almost zero, while the corresponding current rose sharply. In the case of line-to-line (LL) faults, the two involved phase voltages were distortedwhiletheunaffectedphaseremainedalmostunaltered.Doubleline-to-ground(LLG)faultscombinedthesetraitswith
International Research Journal of Engineering and Technology (IRJET) e-ISSN: 2395-0056
Volume: 13 Issue: 04 | Apr 2026 www.irjet.net p-ISSN: 2395-0072
elevatedgroundcurrent.Three-phase(LLL)faultsproducedaconcurrentcollapseofallthreephasevoltages,withsymmetrical contemporary and ongoing rise across all stages. For three-phase-to-ground (LLLG) faults, both voltage collapse and heavy presentdistortionhappened.
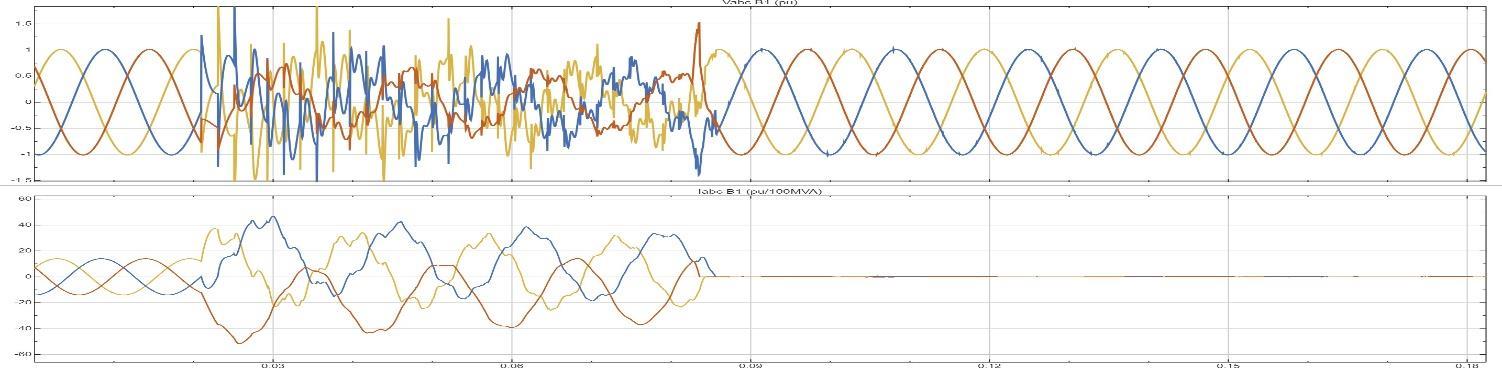
8: Voltage and current waveforms of a three-phase line fault
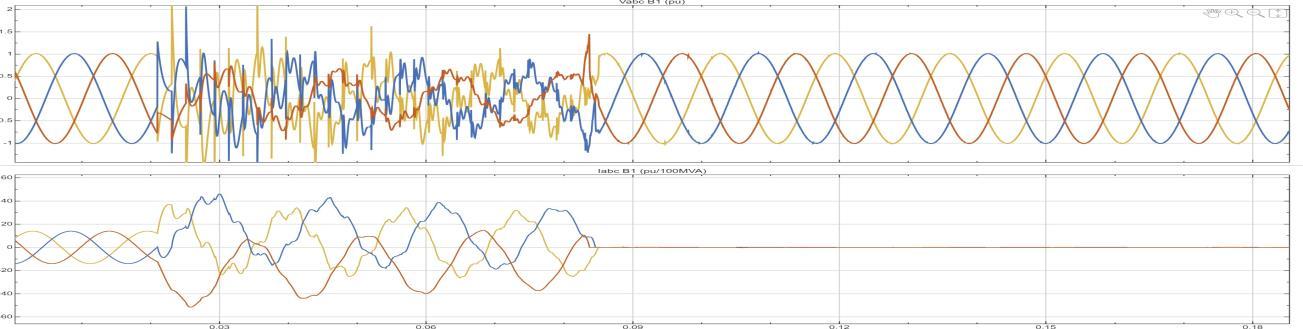
9: Voltage and current waveforms of a three-phase line-to-ground fault
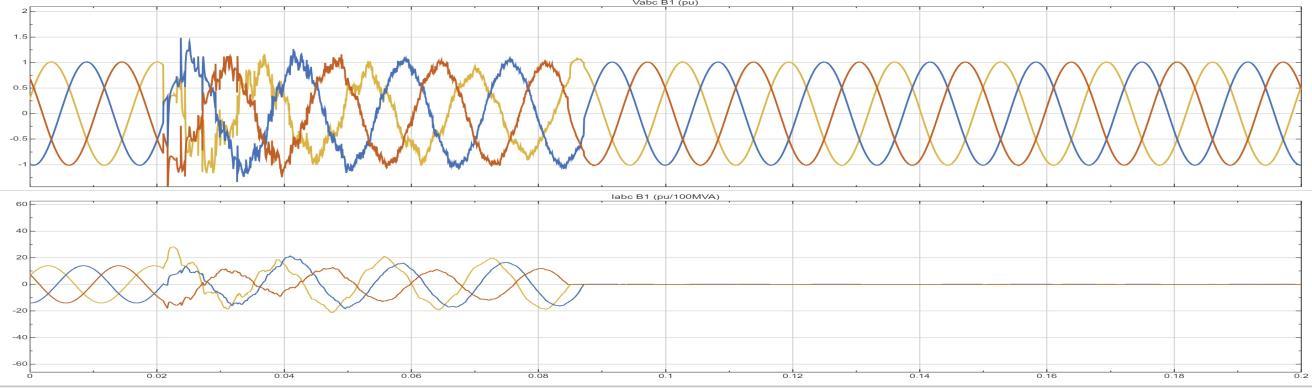
10: Voltage and current waveforms of a line-to-ground (LG) fault in a three-phase transmission line.
International Research Journal of Engineering and Technology (IRJET) e-ISSN: 2395-0056
Volume: 13 Issue: 04 | Apr 2026 www.irjet.net
p-ISSN: 2395-0072
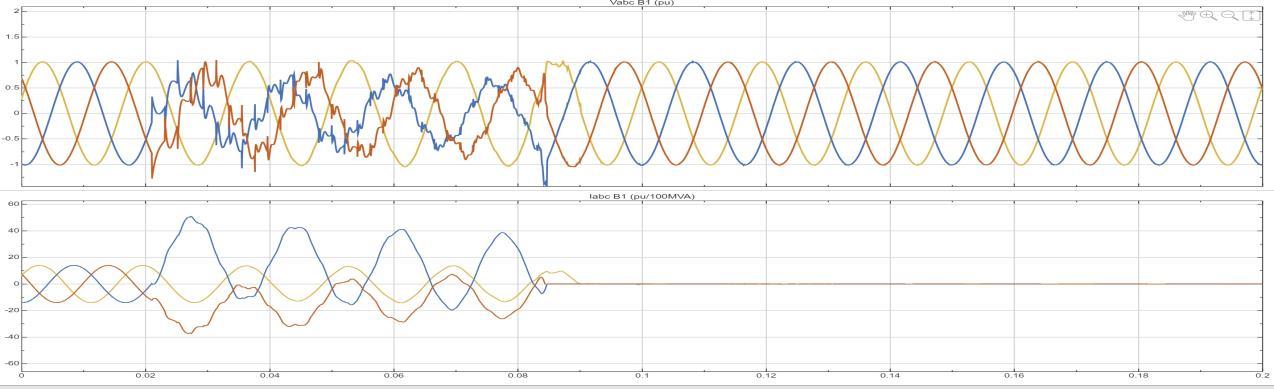
Figure 11: Voltage and current waveforms of a line-to-line (LL) fault in a three- phase transmission line.
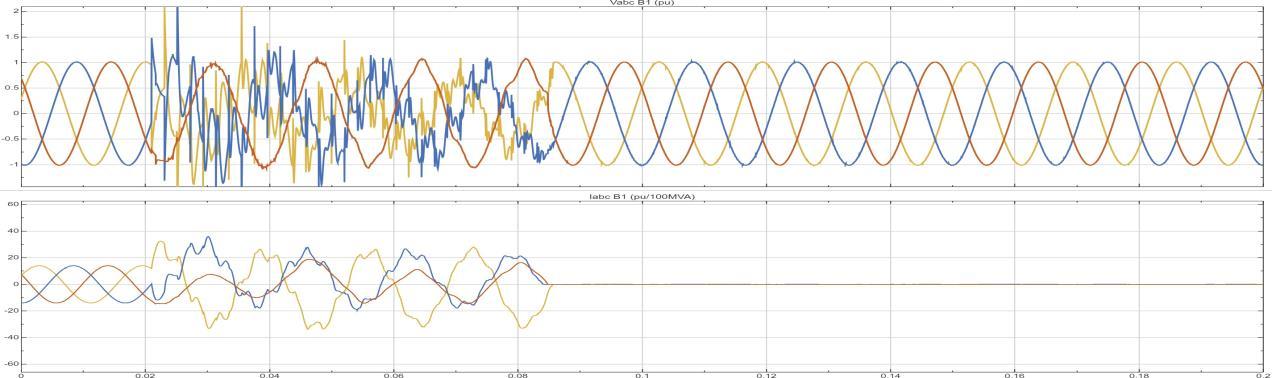
Figure 12: Voltage and current waveforms of a double line-to-ground (LLG) fault in a three-phase transmission line
2. CNN Training and Outputs:CNNwastrainedemploying 80% ofthedatasetandtestedon 20%.Trainingwas conducted with the Adam optimizer, a mini-batch size of 32, and 10 epochs. Accuracy and loss curves validated stableconvergence:trainingaccuracyroseconsistently,whiletrainingandvalidationlossesdecreasedconsistently, indicatingnooverfitting
TheconfusionmatrixvalidatedthattheCNNaccomplishednear-perfectclassificationacrossall11types(10defect categories +no defect), with sole minor confusion recorded between closely relatedunsymmetrical faults (LG vs. LLG). Per-class accuracy exceeded 95%, demonstrating robust generalization. Receiver Operating Characteristic (ROC)curvesfurthervalidatedthemodel’sperformance,generatinganareaunderthecurve(AUC)of0.94.
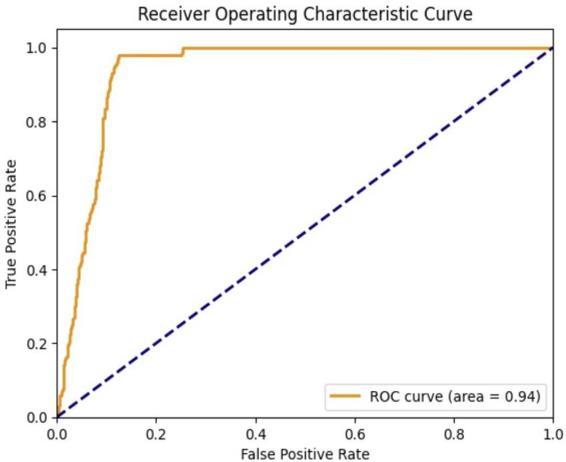
Figure 12: ROC Curve for CNN-based fault detection
International Research Journal of Engineering and Technology (IRJET) e-ISSN: 2395-0056
Volume: 13 Issue: 04 | Apr 2026 www.irjet.net
p-ISSN: 2395-0072
3. Statistical Evaluation Metrics: The performance of the CNN was quantified employing standard metrics: accuracy,precision,recall,andF1-score.CNNaccomplishedanoverallclassificationaccuracyof 98.9%,compared to 84.9% fortheSupportVectorMachine(SVM).Precisionandrecallvaluesremainedabove 95% acrossallclasses, andF1-scoresexceeded0.95,confirmingreliableandbalancedperformance.Theconfusionmatrixhighlightedthat theCNNeffectivelyclassifiedsymmetricalfaults(LLL,LLLG)withnearly 100%
4. Comparative Analysis: To benchmark performance, the CNN was compared with SVM and Extreme Learning Machine(ELM)classifiers.TheSVMachieved84.9%accuracybutfrequentlymisclassifiedLGandLLGfaultsdueto
overlappingtransientfeatures.TheELMshowedmoderateimprovementsbutrequiredsignificantmanualfeatures, extractionandpreprocessing.
Bycontrast,theCNNautomaticallyextractedhierarchicalfeaturesfromrawvoltageandpresentandexistingsignals,removing the need for handcrafted inputs. Its convolutional layers identified localized distortions, pooling layers filtered noise while maintainingprimaryandprincipalerrortraits,andfullylinkedlayerssuppliedresilientclassification.ThispermittedtheCNN tosurpassbothSVMandELMinconditionsofaccuracy,precision,recall,andF1-score,whileminimizingpreprocessingeffort.
5. Discussion and Insights: The superior performance of the CNN can be linkedto its capability to capture both spatial correlations (phase-to-phase interactions) and temporal dynamics (defect transients). Unlike conventional techniques, CNN adjusts to diverse running conditions without manual intervention. From a pragmatic perspective, the outcomes verify that the CNN-based framework is appropriate and fitting for real-time deployment in smart grid environments. Its high classification accuracy, 98.9%, dependability across all classes, and reduced preprocessing necessitiesmakeitahopefulandencouraginginstrumentforintelligentdefecttrackingsystems.Bypermittingquickand fast and precise and correct classification of symmetrical and unsymmetrical faults, the framework can contribute to improvedgridstability,minimizedoutageperiods,andenhancedresilienceofmodernpowersystems.
The Paper explores the usage of neural networks as an alternative approach for detecting and categorizing faults on transmissionlines.Theapproachesutilizedmakeapplicationofthephasevoltageandphasecurrentsasinputstotheneural
International Research Journal of Engineering and Technology (IRJET) e-ISSN: 2395-0056
Volume: 13 Issue: 04 | Apr 2026 www.irjet.net p-ISSN: 2395-0072
networks.Variousclassesof faults,comprising single line-ground, line-line,double line-ground,and three-phase faults,are assessed in this study. The developed CNN model shows a remarkable and extraordinary defect classification accuracy of 98.9%, exceeding the performance of the earlier used support vector machine (SVM) model. This notable improvement highlights the superiority of deep learning methodologies, especially CNN architectures, in precisely discerning and categorizingfaultswithinpowersystems.
The study used MATLAB-SIMULINK to simulate the whole and complete power transmission line model and generate the trainingdataset.Thedeeplearningtoolboxwasthoroughlyusedtotrainandevaluatetheperformanceofneuralnetworks. Overall,thisinquirypavesthewayforfurtherexplorationandrefinementofneuralnetworktechniques,drivingcontinuous improvementinerrordetectionsystemsandguaranteeingthestabilityandresilienceofpowernetworks.
As a possible extension to this work, future inquiries could delve into the exploration of ensemble learning techniques to amalgamatenumerousandmanifoldCNNmodelsoralternativemachinelearningalgorithmsforthepurposeofdefectdetection andclassification.Furthermore,theintegrationofanomalydetectionmethodologiesalongsidetraditionaldefectclassification techniquesmaybolsterthesystem‘scapabilitytoidentifyearlierinvisibleorinfrequentfaults.Additionally,thedevelopment ofauser-friendlyinterfaceordashboardforsystemoperatorstoimagineandinterprettheresultsoftheerrordetectionsystem inreal-timecouldstreamlinedecision-makingproceduresandupkeepmethods.Theseroutespresentconvincingprospectsfor advancingtheeffectivenessandus-abilityofdefectdetectionsystemsintransmissionlines.
[1] J. C.A. Freire,A. R.G. Castro, M. S. Homci, B. S. Meiguins,and J. M. de Morais, “Transmission line faultclassification using hiddenMarkovmodels,”IEEEAccess,vol.7,pp.113499–113510,2019.
[2]J.J.Morais,Y.Pires,C.Cardoso,andA.Klautau,“Aframeworkforevaluatingautomaticclassificationofunderlyingcausesof disturbances and its application to short circuit faults,” IEEE Transactions on Power Delivery, vol. 25, no. 4, pp. 2083–2094, 2010.
[3]M.I.Zaki,R.A.ElSehiemy,G.M.Amer,andF.M.A.ElEnin,“Sensitive/stablecomplementaryfaultidentificationschemefor overheadtransmissionlines,”IETGeneration,Transmission&Distribution,vol.13,no.15,pp.3252–3263,2019.
[4]A.Aleem,N.Shahid,andI.H.Naqvi,“Methodologiesinpowersystemsfaultdetectionanddiagnosis,”EnergySystems,vol.6, no.1,pp.85–108,2015.
[5]M. O.F.Goni,M.Nahiduzzaman,M.S.Anower,M.M.Rahman,M.R.Islam,M.Ahsan,J.Haider,andM.Shahjalal,“Fastand accurate fault detection and classification in transmission lines using extreme learning machine,” PRIME, 2023, doi: 10.1016/j.prime.2023.100107.
[6] V. Daggupati, “Power quality disturbance classification in IEEE 9-bus system using STFT and deep learning,” Doctoral dissertation,TexasTechUniversity,2025.[Online].Available:https://hdl.handle.net/2346/103168
[7]K.Chen,J.Hu,Y.Zhang,Z.Yu,andJ.He,“Faultlocationinpowerdistributionsystemsviadeepgraphconvolutionalnetworks,” IEEEJournalonSelectedAreasinCommunications,vol.38,no.1,pp.119–131,2019.
[8]A.Saber,A.Emam,andH.Elghazaly,“Abackupprotectiontechniqueforthree-terminalmultisectioncompoundtransmission lines,”IEEETransactionsonSmartGrid,vol.9,no.6,pp.5653–5663,2017.
[9]H. Tong,R.C. Qiu,D.Zhang,H. Yang, Q.Ding, and X. Shi,“Detectionandclassificationoftransmission line transient faults basedongraphconvolutionalneuralnetwork,”CSEEJournalofPowerandEnergySystems,vol.7,no.3,pp.456–471,2021.
[10] M. F. Guo, N. C. Yang, and W. F. Chen, “Deep-learning-based fault classification using Hilbert–Huang transform and convolutionalneuralnetworkinpowerdistributionsystems,”IEEESensorsJournal,vol.19,no.16,pp.6905–6913,2019.
[11] M. M. Tawfik and M. M. Morcos, “ANN-based techniques for estimating fault location on transmission lines using Prony method,”IEEETransactionsonPowerDelivery,vol.16,no.2,pp.219–224,2001.
[12] V. Daggupati and S. N. S. Jammula, “Recent advances in fault diagnosis techniques for high voltage transmission lines: A review,”InternationalJournalofRecentTrendsinMultidisciplinaryResearch,vol.2,no.6,pp.284–292,Mar.–Apr.2026,doi: 10.59256/ijrtmr.20260602040.
[13]J.Maetal.,“Anintelligentclassificationframework forcomplexPQDsusingoptimizedKS-transformandmultiplefusion
International Research Journal of Engineering and Technology (IRJET) e-ISSN: 2395-0056
Volume: 13 Issue: 04 | Apr 2026 www.irjet.net p-ISSN: 2395-0072
CNN,”IEEETransactionsonIndustrialInformatics,vol.20,pp.1776–1785,2023.
[14] H. Meena, H. K. Meena, and D. Saxena, “Classification of power quality disturbances with DWT based effective feature extraction,” in Proceedings of the 4th International Conference on Recent Trends in Computer Science and Technology (ICRTCST),IEEE,2022.
[15]S.Panetal.,“ClassificationofpowerqualitydisturbancesusingResNetwithchannelattentionmechanism,”arXivpreprint arXiv:2407.04739,2024.
[16]A.Akhileshwari,D.Venkatesh,M.NarasaBabu,G.NiksonPaul,andS.Ravindra,“SpeedcontrolofBLDCmotorusingLUO converter.”
[17]R.R.Selvarajuetal.,“Grad-CAM:Visual explanationsfromdeep networksvia gradient-basedlocalization,” International JournalofComputerVision,vol.128,pp.336–359,2020.