
International Research Journal of Engineering and Technology (IRJET) e-ISSN: 2395-0056
Volume: 13 Issue: 04 | Apr 2026 www.irjet.net p-ISSN: 2395-0072
International Research Journal of Engineering and Technology (IRJET) e-ISSN: 2395-0056
Volume: 13 Issue: 04 | Apr 2026 www.irjet.net p-ISSN: 2395-0072
Logeshkumar S1 , Ramesh C2 , NV Dhandapani S3 , Sudhakar S 4
1 Post Graduate Student, Department of Mechanical Engineering, KIT-Kalaignarkarunanidhi Institute of Technology, Coimbatore, India
2 Professor, Department of Mechanical Engineering, KIT-Kalaignarkarunanidhi Institute of Technology, Coimbatore, India
3 Professor, Department of Mechanical Engineering, Karpagam College of Engineering, Coimbatore, India
4 Professor, Department of Mechanical Engineering, KIT-Kalaignarkarunanidhi Institute of Technology, Coimbatore, India
AbstractThis researchpresents a detailed experimentalinvestigationonCopper–MoS₂ Metal Matrix Composites fabricated using powder metallurgy and machined using Wire Electrical Discharge Machining (WEDM). Copper is widely used due to its conductivity but suffers from poor wear resistance and machinability. To overcome these limitations, MoS₂ is used as reinforcement due to its solid lubricating behavior. Composites with varying reinforcement percentages (0%, 2%, 4%, and 6%) are fabricated. The machining performance is analyzed by varying pulse OzN time, pulse OFF time, and discharge current. The responses measured includeMaterialRemoval Rate(MRR) and Surface Roughness (Ra). Results show that MoS₂ significantly improves machinability and surface quality due to lubrication effect. However, excessive reinforcement reduces MRR. The study concludes that 4% MoS₂ provides optimal performance.
Keywords: MMC, Copper, MoS₂, Powder Metallurgy, WEDM, Surface Roughness, MRR
Metal MatrixComposites(MMCs)are engineeredmaterials consisting of a metal matrix combined with reinforcement particles such as ceramics or solid lubricants. The matrix provides ductility and toughness, while reinforcement enhances strength, hardness, and wear resistance. MMCs overcome limitations of conventional metals like low wear resistance and thermal instability. They are widely used in aerospace,automotive,andthermalapplicationswherehigh performance is required. The effectiveness of MMCs depends on uniform distribution of reinforcement and strong interfacial bonding. Proper fabrication techniques ensure improved load transfer and structural integrity, making MMCs suitable for advanced engineering applications.
Copper Matrix Composites (CuMMCs) are developed to improve the mechanical limitations of pure copper while retaining its excellent electrical and thermal conductivity. Pure copper has low hardness and poor wear resistance, making it unsuitable for heavy-duty applications. By
incorporating reinforcements such as MoS₂, the composite gains improved lubrication, reduced friction, and better machinability. MoS₂ acts as a solid lubricant, forming a protectivelayerthatreducestoolwearandimprovessurface finish. CuMMCs are widely used in electrical contacts, heat exchangers, and EDM electrodes where both conductivity andstrengtharerequired.
MMCs can be fabricated using liquid-state and solid-state methods. Liquid-state methods such as stir casting are economical but may lead to non-uniform distribution and reinforcementdegradation.Solid-statemethodslikepowder metallurgy are preferred for temperature-sensitive reinforcements.Thesemethodsprovidebettercontrolover composition, uniform particle distribution, and improved bonding. The choice of fabrication technique directly influencesdensity,strength,andmicrostructuralproperties of the composite. Therefore, selecting an appropriate methodiscriticalforachievingdesiredperformance.
Powder metallurgy is a solid-state fabrication technique
International Research Journal of Engineering and Technology (IRJET) e-ISSN: 2395-0056
Volume: 13 Issue: 04 | Apr 2026 www.irjet.net p-ISSN: 2395-0072
involving mixing, compaction, and sintering of powders. It allows precise control over reinforcement percentage and ensures uniform distribution within the matrix. Since the process occurs below melting temperature, it prevents degradationofreinforcementslikeMoS₂.Sinteringenhances bonding through diffusion, resulting in improved strength anddensity.Thismethodalsoreducesmaterialwastageand supportsnear-netshapemanufacturing.Powdermetallurgy is widely used for producing high-quality copper-based compositeswithenhancedproperties.
Non-conventional machining processes remove material using electrical, thermal, or chemical energy instead of mechanical cutting. These processes are essential for machining hard materials like MMCs, where conventional tools experience excessive wear. EDM and WEDM are commonly used methods that provide high precision and minimaltoolwear.Theyeliminatecuttingforcesandallow machiningofcomplexgeometries.Thesetechniquesensure bettersurfacefinishanddimensionalaccuracy,makingthem suitableforadvancedmaterials.
WireElectricalDischargeMachining(WEDM)isaprecision machining process that uses electrical sparks to remove material from conductive workpieces. A continuously moving wire electrode generates sparks that melt and vaporize material. The absence of physical contact reduces tool wear and enables machining of hard and brittle materials. WEDM is widely used for producing intricate shapes with high accuracy. It is especially effective for machiningMMCsduetoitsnon-contactnatureandsuperior surfacefinish
Studies on MMCs indicate significant improvement in mechanical and tribological properties with reinforcement addition.ResearchersfoundthatMoS₂enhanceslubrication and reduces friction, improving machinability. Powder metallurgy is widely adopted for uniform reinforcement distribution and better bonding. EDM and WEDM are effective for machining MMCs, offering high precision and reduced tool wear. However, optimization of machining parameters remains a key research area to achieve better performance.
The methodology includes selection of materials, powder blending,compaction,sintering,andmachining.Copperand MoS₂ powders are mixed to achieve uniform distribution, thencompactedandsinteredtoformcomposites.Machining isperformedusingWEDMtoevaluateperformance.Process parametersarevariedsystematicallytostudytheireffecton machiningcharacteristicssuchassurfacefinishandmaterial removalrate.
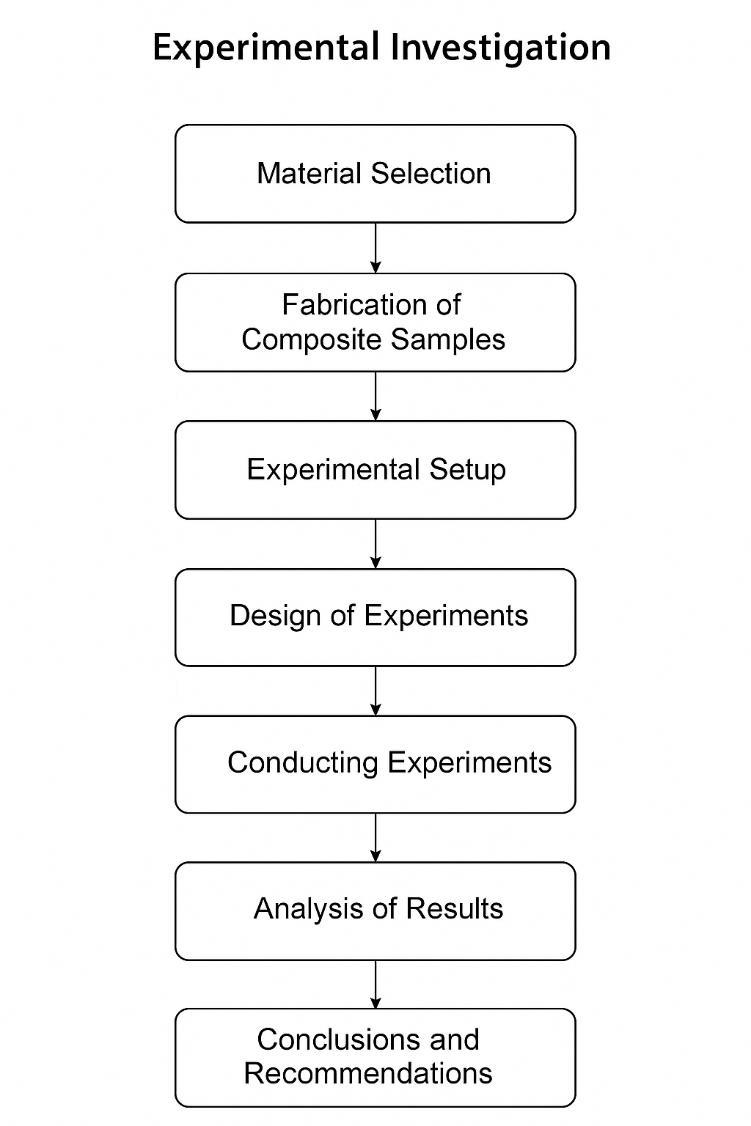
1 Methodology Flow Chart of Experimental Investigation
Copperiswidelyusedduetoitshighelectricalandthermal conductivity. It also offers good corrosion resistance and ductility. However, its low hardness and poor wear resistancelimititsapplicationinmechanicalenvironments. Reinforcing copper with suitable materials improves its strength and tribological properties while maintaining its conductivityadvantages.
International Research Journal of Engineering and Technology (IRJET) e-ISSN: 2395-0056
Volume: 13 Issue: 04 | Apr 2026 www.irjet.net p-ISSN: 2395-0072
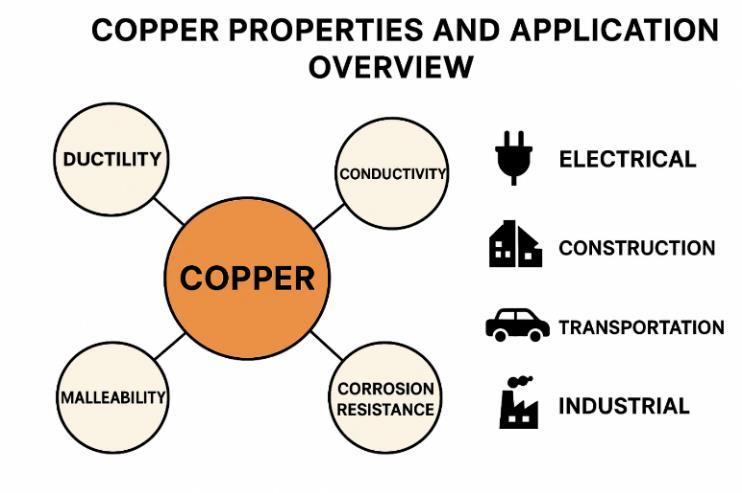
2 Copper Properties and Applications Overview Diagram
3.3 REINFORCEMENT MATERIAL PROPERTIES
Reinforcement materials play a key role in improving composite performance. MoS₂ is selected due to its solid lubricating properties, which reduce friction and enhance machinability. Proper selection of reinforcement ensures better bonding and uniform distribution, leading to improvedmechanicalandtribologicalbehavior.
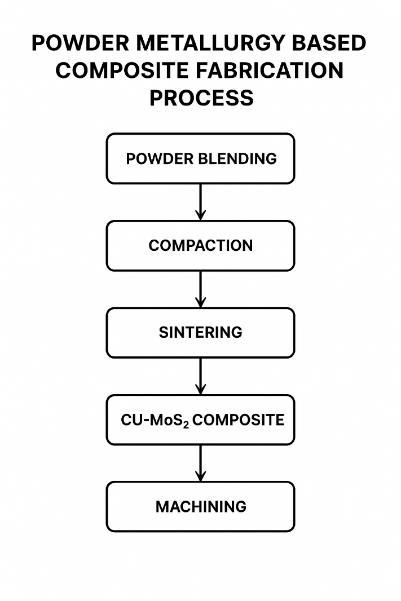
Fig. 3 Powder Metallurgy-Based Composite Fabrication Process Flow (Cu–MoS₂)
3.4 COMPOSITE FABRICATION
3.6 EXPERIMENTAL DESIGN
Experimental design is used to systematically analyze the effect of process parameters on machining performance. TechniquessuchasTaguchimethodhelpreducethenumber ofexperimentswhilemaintainingaccuracy.Parametersare
Composite fabrication is carried out using powder metallurgy to ensure uniform mixing and strong bonding. The process involves blending copper and MoS₂ powders, followed by compaction and sintering. This results in improved density, strength, and wear resistance. Proper fabrication ensures consistent performance of the compositematerial.
Table:1 - Composite Fabrication
Sl.No. Parameter Details
1 BaseMaterial Copper(Cu)
2 Reinforcement Material Molybdenum Disulfide(MoS₂)
3 Reinforcement% 0%,2%,4%,6%
4 FabricationMethod PowderMetallurgy
3.5 PROCESS PARAMETERS OF WEDM
WEDM performance is influenced by parameters such as pulse-ontime,pulse-offtime,current,wirefeed,andvoltage. These parameterscontrol spark energy and affectmaterial removalrate,surfaceroughness,anddimensionalaccuracy. Proper optimization of these parameters is essential for achievingefficientmachiningandimprovedsurfacequality.
Table:2- Factors for Analysis: Reinforcement %, Current, pulse ON time, pulse OFF time
varied at different levels, and responses such as material removal rate and surface roughness are measured to determineoptimalconditions.
International Research Journal of Engineering and Technology (IRJET) e-ISSN: 2395-0056
Volume: 13 Issue: 04 | Apr 2026 www.irjet.net p-ISSN: 2395-0072
The experimental results indicate that reinforcement percentage and machining parameters significantly influence performance. Increased MoS₂ content improves surface finish due to lubrication but may reduce material removal rate. Higher pulse-on time increases MRR but worsens surface roughness. Optimal parameter combination provides a balance between productivity and surface quality. Statistical analysis confirms the influence of key parameters on machining behavior.
The WEDM experiments were conducted according to the Taguchi L16 orthogonal array by varying Reinforcement percentage (0%, 2%, 4%, 6%), Pulse ON Time (120–135 µs), Pulse OFF Time (40–55 µs), and Wire Feed Rate (5–8 m/min). The measured responses were Surface Roughness (Ra) and Material Removal Rate (MRR). Surface Roughness ranged from 2.78 µm to 3.17 µm and MRR ranged from 8.07 mm³/min to 18.55 mm³/min.
Table 4. Results for Surface Roughness and MRR
Using the Smaller-the-better criterion, Pulse ON Time was identified as the most significant parameter influencing surface roughness, followed by reinforcement percentage, Pulse OFF Time, and Wire Feed Rate. IncreasingPulse ON Time increases spark energy and crater depth, resulting in higher surface roughness.
International Research Journal of Engineering and Technology (IRJET) e-ISSN: 2395-0056
Volume: 13 Issue: 04 | Apr 2026 www.irjet.net p-ISSN: 2395-0072
Table 4.2 S/N Ratio Response Table for Surface Roughness
Themaineffectplotshowsthatsurfaceroughnessincreases with Pulse ON Time and reinforcement percentage, decreases with Pulse OFF Time, and shows minimal variationwithWireFeedRate.
Ra = 1.3425 + 0.022R + 0.0138PON − 0.0059POFF + 0.009WFR. The positive coefficients of reinforcement and Pulse ONTimeindicate increasingroughness, while higher PulseOFFTimeimprovessurfacefinish.
Rank 2 1 3 4
Figure 4.1 Main Effect Plot for Surface Roughness
4.3 ANOVA for Surface Roughness
ANOVA results indicate that all parameters are statistically significant (P < 0.05). Pulse ON Time shows the highest Fvalue, confirming dominant influence. The statistical model exhibits high reliability with R² ≈ 99%
Table 4.3 ANOVA Results for Surface Roughness
Table 4.5 Regression Coefficients for Surface Roughness
S=0.0132288 R-Sq=99.70% R-Sq(adj)=98.52%
RegressionEquation: SurfaceRoughness=1.3425+0.022Reinforcement%+ 0.0138PON-0.0059POFF+0.009WireFeed S=0.0467197 R-Sq=86.43% R-Sq(adj)=81.50% R-Sq(pred)=71.50%
Figure 4.3 Residual Plot for Surface Roughness
Volume: 13 Issue: 04 | Apr 2026 www.irjet.net
Figure 4.4 Contour Plots of Ra vs Reinforcement% , PON
Using the Larger-the-better criterion, reinforcement percentage was identified as the most significant factor affecting MRR. Increasing reinforcement reduces electrical conductivity,therebyreducingsparkefficiencyandMRR.
Table 4.5 S/N Ratio Response Table for MRR
Figure 4.5 Contour Plots of Ra vs PON , POFF
Figure 4.7 S/N Ratio Plot for MRR
MainEffectsPlotforSNratios
Data Means
Figure 4.6 Contour Plots
Signal-to-noise: Larger is better
4.7 ANOVA for MRR
ANOVAconfirmsallparameterssignificantlyinfluenceMRR (P < 0.05). Reinforcement percentage has the highest contributionwithmodelreliabilityR²≈99%.
International Research Journal of Engineering and Technology (IRJET)
Volume: 13 Issue: 04 | Apr 2026 www.irjet.net
Table 4.6 ANOVA Results for MRR Source
Figure 4.9 Contour Plot of MRR vs PON , Reinforcement
4.8 Main Effect Plot for MRR
MRR decreases with increasing reinforcement percentage and Pulse OFF Time, while it increases with Pulse ON Time. Wire Feed Rate shows comparatively minor influence.
4.9 Regression Model for MRR
MRR = −3.47663 − 0.9336R + 0.28025PON − 0.30895POFF − 0.13075WFR. Higher Pulse ON Time increases MRR, whereas higher reinforcement and Pulse OFF Time decrease MRR.
Table 4.7 Regression Coefficients for MRR
S = 0.377897 R-Sq = 99.76% R-Sq(adj) = 98.78%
MRR = -3.47663 - 0.933625 Reinforcement % + 0.28025 PON - 0.30895 POFF - 0.13075 Wire Feed
S = 1.29853 R-Sq = 89.44% R-Sq(adj) = 85.60% R-Sq(pred) = 74.12%
Figure 4.8 Residual Plot for MRR
Figure 4.10 Contour Plot of MRR vs PON , POFF
ContourPlotofMRRvsPON,POFF
Figure 4.10 Contour Plot of MRR vs Wire feed, POFF
ContourPlotofMRRvsWireFeed,POFF
International Research Journal of Engineering and Technology (IRJET) e-ISSN: 2395-0056
Volume: 13 Issue: 04 | Apr 2026 www.irjet.net p-ISSN: 2395-0072
OptimalmachiningparameterswereselectedbasedonS/N ratio analysis. Confirmation experiments showed that predictedandexperimentalvalueswereincloseagreement, validatingtheregressionmodels.
Interactionanalysisrevealedthatreinforcementpercentage and Pulse ON Time significantly influence MRR. Proper combinationofPulseONandPulseOFFTimeensuresstable machining.
4.12 Comparative Discussion
The results align with previous copper-based EDM/WEDM studies. MoS₂ reinforcement reduces MRR but improves surfaceintegritycomparedtounreinforcedcopper.
1. H. Nautiyal, S. K. Yadav, A. K. Srivastava, “Copper matrix compositesreinforcedby rGO–MoS₂hybrid nanosheets,” Composites Part B: Engineering, vol. 171,pp.1–10,2019.
2. S.D.Kumar,“EffectofEDM processparameterson material removal rate review,” Journal/Review, 2020.
3. V.An,N.K.Sharma,“Studyoftribologicalbehavior of Cu–MoS₂ and Ag–MoS₂ composites,” SpringerPlus,2016.
4. Prasad et al., “Powder metallurgy: fabrication and characterization of copper matrix composites a review,”AIPConferenceProceedings,2018.
5. Ü.A.Usca,“Tribologiscalaspects,optimizationand analysisofCu-basedcomposites,”Materials,vol.14, 2021.
6. S.D.Kumar,“OptimizationofdiesinkEDMprocess parameters using statistical techniques,” AIP Advances,2022.
Pulse ON Time is dominant for Surface Roughness, while reinforcementpercentagedominatesMRR.IncreasingMoS₂ reducesMRRandhigherPulseONTimeincreasesbothMRR and surface roughness. Statistical models show strong predictivecapability.
The study concludes that Cu–MoS₂ composites fabricated usingpowdermetallurgyshowimprovedmachinabilityand wear resistance. WEDM is effective for machining these composites with high precision. Optimization of process parameters is essential for achieving better performance. Futureworkcanfocusonadvancedoptimizationtechniques, microstructural analysis, and application-based studies for industrialimplementation.
7. M. Mohan, et al., “Prediction of effect of MoS₂ content on wear behavior of self-lubricating Cu composites,” International Journal of Engineering andMaterialsScience,2015.
8. R. Vellaichamy et al., “MoS₂ hybrid metal matrix composites:machiningandWEDMstudy,”Scientific Reports,2025.
9. J. Rajaguru et al., “Novel CNT reinforced copper composite and EDM performance,” Journal of MaterialsProcessing,2022.
10. M. Hadi, “Effect of copper-graphite composite electrode on material removal rate in EDM,” Metallurgical&MaterialsEngineering,2022.
11. Fabricationofcopper-graphiteMMCsusingpowder metallurgytechnique,ResearchGatepreprint,2018.
12. N. Sahoo et al., “Tribomechanical and microstructural evaluation of Cu–(various) composites,”ElsevierJournal,2025.
13. A review on fabrication and characterization of copper metal matrix composites, AIP Advances, 2018.
14. Sarala Rubi et al., “A non-traditional material removal process: EDM/WEDM reviews &
International Research Journal of Engineering and Technology (IRJET) e-ISSN: 2395-0056
Volume: 13 Issue: 04 | Apr 2026 www.irjet.net p-ISSN: 2395-0072
optimization,”FrontiersinMechanicalEngineering, 2024.
15. S. Subbian, V. et al., “Dry sliding wear behavior of coppermatrixcompositesreinforcedwithTiO₂and MoS₂,”Journal/Proceedings,2024.
16. Chengetal.,“MoS₂-basedcompositesandadvanced applications,”Nanomaterials,2025.
17. Wang et al., “Molybdenum disulfide composite materials with encapsulated structures,” RSC Advances,2022.
18. PavanC.etal.,“Taguchianalysisonmachinabilityof alloys using EDM,” Materials and Manufacturing Processes,2021.
19. Optimization and modeling of EDM parameters usingTaguchi/RSM/ANN,variousauthors,2015–2023.
© 2026, IRJET | Impact Factor value: 8.315 | ISO 9001:2008 Certified Journal | Page3812