
International Research Journal of Engineering and Technology (IRJET) e-ISSN: 2395-0056
Volume: 13 Issue: 02 | Feb 2026 www.irjet.net p-ISSN: 2395-0072
International Research Journal of Engineering and Technology (IRJET) e-ISSN: 2395-0056
Volume: 13 Issue: 02 | Feb 2026 www.irjet.net p-ISSN: 2395-0072
Jadeja Krushanrajsinh
Ramsinh1 , Dr.Prachi Pandya 2, Durgesh Kumar Singh 3 , Dr.C.G.Patel 4
1 Final Year Student, Department of Civil Engineering (IoT) Ganpat University, Gujarat, India
2 Assistant Professor, IOT, Department of Civil Engineering Ganpat University, Gujarat, India
3 Assistant Professor, UVPCE, Department of Civil Engineering Ganpat University, Gujarat, India
4 Professor & Head, UVPCE, Department of Civil Engineering Ganpat University, Gujarat, India
Abstract - Pavement surface distress evaluation is a critical component of road maintenance and pavement management systems, as surface deterioration directly affects ride quality, vehicle operating costs, and road user safety. Conventional pavement condition assessment methods such as manual visual inspections, inertial profilers, and specialized pavement inspection vehicles, althougheffective,areoftenexpensive,time-consuming,and require trained personnel. These limitations restrict their frequent application, particularly for urban local roads and low-volume road networks in developing regions. With recent advancements in smartphone technology, embedded sensors and high-resolution cameras offer a promising lowcostalternativeforpavementconditionmonitoring.
This study presents a detailed evaluation of pavement surface distress using smartphone sensor data combined with image-based analysis techniques. Extensive field data werecollectedusinganiPhone16ProMaxmountedinsidea moving vehicle. Accelerometer sensor data and pavement surface images were recorded simultaneously while traversing selected urban road sections in Gandhinagar, Gujarat, India (PIN: 382421). The study area included four representative road sections, consisting of three bituminous pavements categorized as good, moderate, and poor based on surface condition, and one cement concrete pavement section exhibiting joint-related surface irregularities. To ensure consistency and reliability, all data were collected using the same smartphone, identical mounting position, and a controlled vehicle speed range of approximately 45–55km/h.
Thecollectedaccelerometer data wereanalyzed using basic statistical and graphical methods to evaluate relative variations in pavement surface condition. Acceleration magnitude was considered as an indicator of pavementinduced vehicle vibration. In parallel, a large number of pavement surface images were examined through visual inspectiontoidentifyandclassifycommonsurfacedistresses such as cracking, potholes, surface disintegration, and joint distress. The sensor-based results were validated through image-based observations to establish a qualitative correlation between vibration response and visible pavementdefects.
The results indicate that poor-condition bituminous pavements exhibit significantly higher acceleration variations compared to good-condition pavements, reflecting severe surface deterioration. Cement concrete pavements showed moderate average acceleration values with distinct sharp peaks corresponding to rigid pavement joints. The strong agreement between smartphone sensor data and image-based distress identification demonstrates the effectiveness of the proposed approach. The study concludes that smartphone-based sensing combined with image-based analysis provides a practical, low-cost, and reliable method for preliminary pavement surface distress evaluation, suitable for academic research and resourceconstrainedpavementmonitoringapplications.
Key Words: Pavement distress, Smartphone sensors, Image-based analysis, Road condition assessment, Lowcost monitoring
Road transportation infrastructure plays a vital role in economic development, social connectivity, and regional mobility. The performance and serviceability of road networkslargelydepend on pavementsurfaceconditions, which are continuously subjected to traffic loading, environmentaleffects,andmaterialaging.Overtime,these factorscausesurfacedistressessuchascracking,potholes, surface disintegration, joint distress, and increased roughness. If not identified early, these distresses accelerate deterioration, reduce ride quality, compromise safety,andincreasemaintenanceandrehabilitationcosts.
Pavementsurfaceconditionevaluationisakeycomponent of pavement management systems. Traditional assessment methods include manual visual surveys and specialized equipment such as inertial profilers, laser scanning systems, and automated inspection vehicles. Although reliable, these methods are often expensive, operationally complex, and require trained personnel, making frequent large-scale monitoring difficult, especially for urban and low-volume roads in developing regions.
In this context, the present study evaluates pavement surface distress using smartphone sensor data combined
International Research Journal of Engineering and Technology (IRJET) e-ISSN: 2395-0056
Volume: 13 Issue: 02 | Feb 2026 www.irjet.net p-ISSN: 2395-0072
with image-based analysis. The study was conducted on selected urban road sections in Gandhinagar, Gujarat, India (PIN: 382421), including both bituminous and cement concrete pavements with varying surface conditions. Field data were collected using a single smartphone mounted inside a moving vehicle to maintain consistency. Accelerometer data were analyzed using basicstatisticalandgraphicalmethods,whileimage-based visual inspection was used to identify and classify surface distresses.
Theobjectiveofthisstudyistoassesstheeffectivenessof integrating smartphone-based sensor data with imagebased inspection as a low-cost and practical approach for preliminary pavement distress evaluation. The findings aim to support academic research, enable rapid condition screening, and promote accessible pavement monitoring techniquesforurbanroadnetworks.
Pavement surface condition evaluation has been extensivelystudiedduetoitsimportancein ensuringride quality, safety, and effective pavement maintenance planning. Pavement surface distress such as cracking, potholes, raveling, and joint deterioration develops over time due to traffic loading, environmental conditions, and material aging. Early identification of such distresses is essential to prevent further deterioration and reduce rehabilitationcosts[1].
Conventional pavement condition assessment methods primarily rely on visual inspection and specialized measuring equipment. Manual visual surveys involve trained inspectors identifying and recording pavement distresses such as cracking, potholes, rutting, and surface deformation. Although visual inspections are widely used due to their simplicity, they are time-consuming, subjective,andpronetohumanerror[1].
To overcome the limitations of manual surveys, conventional pavement condition assessment techniques employ specialized equipment such as inertial profilers and laser-based measurement systems. Sayers et al. developed the International Roughness Index (IRI) as a standard measure of pavement roughness [1]. Profilingbased methods provide accurate and repeatable results and are widely used in pavement management systems [5]. However, these techniques involve high initial costs, complexoperation,andrequiretrainedpersonnel,limiting their applicability on urban local roads and low-volume roadnetworks[6].
Several researchers have investigated the relationship betweenvehiclevibrationresponseandpavementsurface condition. Pavement irregularities induce vertical vibrations in vehicles, which can be captured using accelerometers mounted on the vehicle body [7]. Studies have shown that acceleration magnitude and vibration patterns correlate with pavement roughness and surface defects [8]. Early vibration-based systems relied on dedicated sensors and data acquisition units, which increased system cost and restricted large-scale deployment[9].
With advancements in mobile technology, smartphones haveemergedaslow-costsensingplatformsforpavement condition monitoring. Modern smartphones are equipped with tri-axial accelerometers, gyroscopes, GPS receivers, and high-resolution cameras. Douangphachanh and Oneyama demonstrated that smartphone accelerometer data can be used to estimate pavement roughness with reasonable accuracy [10]. Smartphone-based approaches offeradvantagessuchaslowcost,easeofdeployment,and wide availability [11]. However, factors such as vehicle type, mounting position, and speed variation influence recorded sensor data and must be considered during analysis[12].
Image-based pavement distress detection techniques involve capturing pavement surface images and analyzing them to identify visible defects such as cracks, potholes, and surface wear. Manual interpretation of pavement imageshasbeenwidelyusedandprovidesreliableresults for small-scale studies [13]. Recent studies have explored automated image-based distress detection using image processing and machine learning techniques [14], [15]. While these automated methods improve efficiency, they requirelargedatasetsandcomputationalresources,which may not be feasible for academic or resource-constrained applications[16].
Recent research highlights the benefits of integrating sensor-baseddataandimage-basedanalysisforpavement condition assessment. Sensor data can identify locations with potential surface irregularities, while image-based inspection provides visual confirmation and classification ofpavementdistresses[17].Integratedapproachesreduce uncertainty and improve confidence in pavement
International Research Journal of Engineering and Technology (IRJET) e-ISSN: 2395-0056
Volume: 13 Issue: 02 | Feb 2026 www.irjet.net p-ISSN: 2395-0072
evaluation results [18]. However, many existing studies focus on complex automated systems, leaving limited research on simplified, analysis-based integrated methodologiessuitableforacademicstudies.
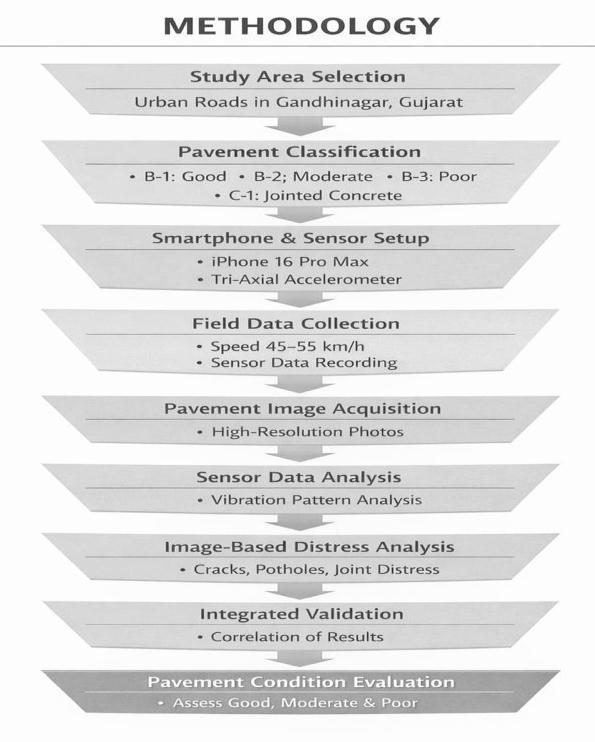
The methodology adopted in this study focuses on evaluating pavement surface distress using smartphone sensor data combined with image-based analysis techniques. The approach emphasizes real field data collection, basic statistical analysis, and visual interpretation without the use of complex signal processing or machine learning algorithms. The overall methodology consists of study area selection, pavement section classification, smartphone sensor configuration, data collection procedure, image acquisition, and data analysis.
Thestudy wasconductedonselectedurban roadsections located in Gandhinagar, Gujarat, India (PIN: 382421). The selected road sections lie within urban and semi-urban areasandaresubjectedtoregulartrafficmovement.These locations were chosen to represent commonly encountered pavement conditions in Indian urban road networks.
Four pavement sections were selected for the study, including three bituminous pavement sections with varying surface conditions and one cement concrete pavement section. The bituminous pavements were categorized as good, moderate, and poor based on visible surface condition, while the cement concrete pavement
exhibited joint-related surface irregularities. The location oftheselectedpavementsectionsisshowninFig.1.
Red-B1
Black-B2
Green-b3

Yellow-C1
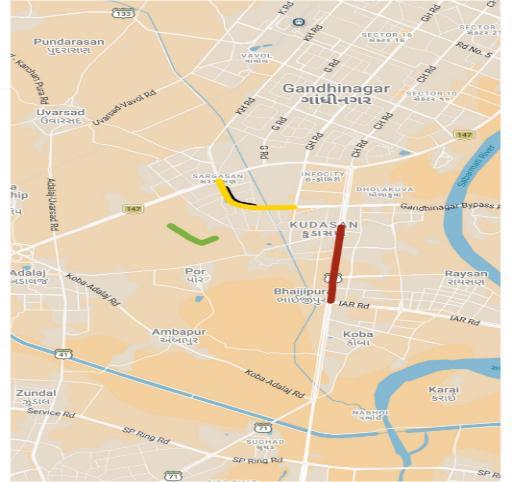
Fig. 1: Studyareamapshowingselectedpavement sections(B-1,B-2,B-3,andC-1)inGandhinagar,Gujarat
The selected pavement sections were classified based on visual inspection prior to data collection. Pavement conditionclassificationwasperformedconsideringvisible surface distresses such as cracking, potholes, surface disintegration,andjointdistress,assuggestedinstandard pavementevaluationpractices[1],[2].
The pavement sections were classified as follows:
B-1:Bituminouspavementingoodconditionwith minimalvisibledistress
B-2: Bituminous pavement in moderate condition withlocalizedsurfaceirregularities
B-3:Bituminouspavementinpoorconditionwith severesurfacedistress
C-1:Cementconcretepavementwithjoint-related surfaceirregularities
Table 1:PavementSectionDetails
Section ID Pavement Type Condition Speed Range (km/h)
B-1 Bituminous Good 45–55
B-2 Bituminous Moderate 45–55
B-3 Bituminous Poor 45–55
C-1 Cement Concrete Jointed 45–55
International Research Journal of Engineering and Technology (IRJET) e-ISSN: 2395-0056
Volume: 13 Issue: 02 | Feb 2026 www.irjet.net p-ISSN: 2395-0072
AniPhone16ProMaxwasusedforsensor datacollection andimageacquisition.Modernsmartphonesareequipped with embedded sensors capable of recording vehicle motion and vibration responses [3]. The smartphone contains a tri-axial accelerometer that records acceleration along three orthogonal axes, making it suitable for capturing pavement-induced vehicle vibrations.
The smartphone was securely mounted inside the test vehicle using a fixed holder to minimize unwanted movement. The mounting position and orientation were kept constant for all pavement sections to ensure uniformity in sensor data. The accelerometer sensor was primarily used for analysis, as vertical acceleration components are sensitive to pavement surface irregularities[4].
Sensor data were collected by driving the vehicle along each selected pavement section at a controlled speed range of approximately 45–55 km/h. Maintaining a consistent speed is important to reduce variability in vibration response caused by acceleration or braking [5]. Sudden maneuvers such as sharp turns and abrupt brakingwereavoidedduringdatacollection.
Accelerometer data were recorded continuously throughout each road section. The collected sensor data wereexportedinCSVformatforfurtheranalysis.Multiple data points were recorded for each pavement section, resulting in a large dataset exceeding several hundred megabytes,ensuringadequaterepresentationofpavement surfacebehavior.
In addition to sensor data collection, pavement surface images were captured using the smartphone’s highresolution camera. Images were taken at locations where visible pavement surface distresses were observed and at pointscorrespondingtonotablevariationsinsensordata. The captured images included common pavement distresses such as cracking, potholes, surface disintegration,andjointdistress.
Image acquisition was performed under daylight conditions to ensure adequate visibility and clarity. The large number of images collected during the study provided comprehensive visual documentation of pavement surface conditions across all selected sections, supportingdetailedimage-basedanalysis[6].
The collected accelerometer data were analyzed using basic statistical and graphical methods. Acceleration magnitudewascalculatedfromthetri-axialaccelerometer dataandusedasanindicatorofpavement-inducedvehicle vibration. Average acceleration values and variation patterns were examined to compare pavement surface conditionsacrossdifferentsections.
Image-based analysis was performed through visual inspection of the collected pavement images. The observed surface distresses were identified and classified based on standard pavement distress categories [7]. The results obtained from sensor data analysis were then compared with image-based observations to establish a qualitative correlation between vibration response and visiblepavementsurfacedefects.
This combined analysis approach improves the reliability of pavement surface distress evaluation by integrating quantitativesensordatawithqualitativevisualevidence.
The overall methodological framework adopted in this study integrates smartphone sensor-based vibration analysis with image-based pavement distress identification.Theapproachprovidesalow-cost,practical, and accessible method for preliminary pavement surface conditionassessment.
This section presents the results obtained from the analysis of smartphone accelerometer data and imagebased pavement surface observations collected from selectedbituminousandcementconcreteroadsectionsin Gandhinagar, Gujarat. All data were collected using the same smartphone, mounting position, and controlled vehiclespeedrangeof45–55km/htoensureconsistency. The results are discussed in terms of acceleration response, comparative pavement performance, and validationthroughpavementsurfaceimages.
The acceleration response recorded along the goodcondition bituminous pavement section (B-1) indicates relatively smooth vehicle motion with minimal vibration fluctuations. The acceleration signal shows small and evenly distributed peaks, suggesting a uniform pavement surface with negligible surface distress. The calculated average acceleration magnitude for this section was 2.81, which is the lowest among all studied pavement sections. This low acceleration response confirms good pavement conditionandsuperiorridequality.
International Research Journal of Engineering and Technology (IRJET) e-ISSN: 2395-0056
Volume: 13 Issue: 02 | Feb 2026 www.irjet.net p-ISSN: 2395-0072
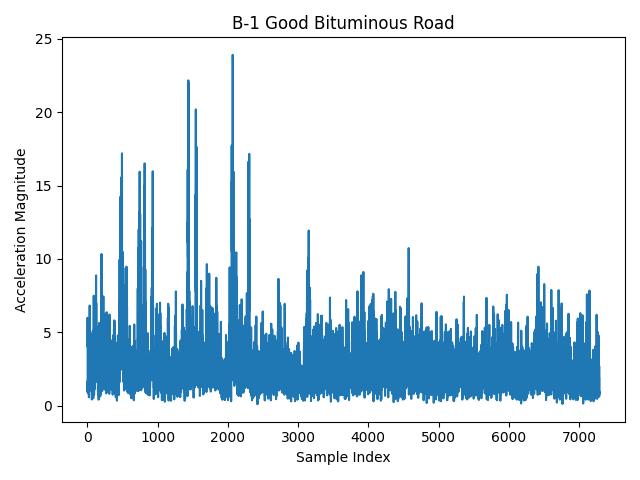
Fig. 2: Accelerationvariationalonggood-condition bituminouspavementsection(B-1)
Themoderate-conditionbituminouspavementsection(B2) exhibited noticeably higher acceleration variability compared to the good-condition pavement. The acceleration signal shows several localized peaks, which can be attributed to minor surface distresses such as shallow potholes, surface wear, patchwork, and uneven riding surface. The average acceleration magnitude recorded for this section was 4.33, indicating a clear increase in pavement-induced vibration response due to surfacedeterioration.
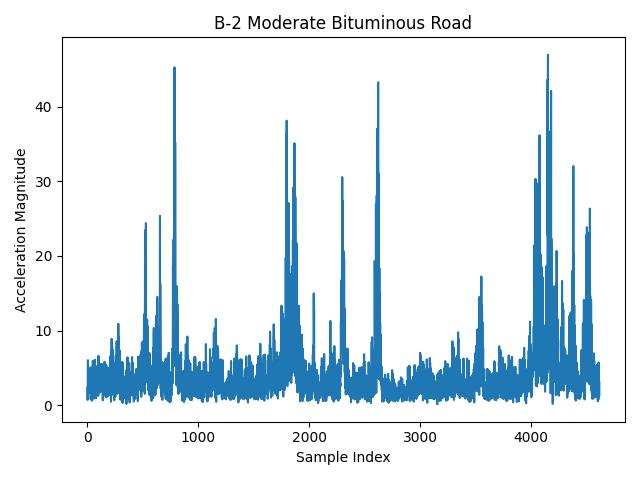
Fig. 3: Accelerationvariationalongmoderate-condition bituminouspavementsection(B-2)
The poor-condition bituminous pavement section (B-3) demonstrated the highest magnitude and frequency of acceleration peaks. The acceleration signal shows sharp, irregular,andcontinuousfluctuationsthroughouttheroad section. These high vibration responses are caused by severepavementsurfacedistressessuchasdeeppotholes, extensive cracking, surface disintegration, and uneven pavement profile. The calculated average acceleration magnitudeforthissection was6.42,whichissignificantly higher than the other bituminous sections, clearly indicating poor pavement condition and reduced ride comfort.
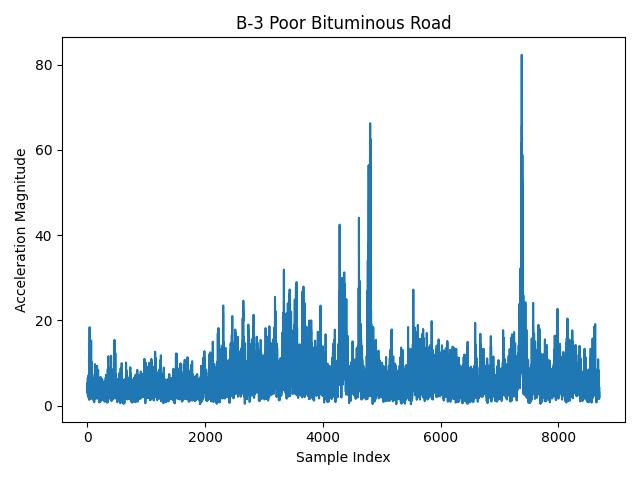
Fig. 4:Accelerationvariationalongpoor-condition bituminouspavementsection(B-3)
4.2 Acceleration Characteristics of Cement Concrete Pavement
The acceleration response of the cement concrete pavement section (C-1) showed characteristics different from those of bituminous pavements due to the rigid nature of concrete pavements and the presence of transverse joints. The acceleration signal exhibits moderate average values with distinct sharp spikes occurringatregularintervals.Thesespikescorrespond to vehicle movement over pavement joints and surface discontinuitiesinherenttorigidpavements.
The average acceleration magnitude for the cement concretepavementsectionwas4.17,whichishigherthan thatofthegood-conditionbituminouspavementbutlower thanthatoftheseverelydistressedbituminouspavement. This indicates that even in the absence of major surface damage, concrete pavements can produce noticeable vibration responses due to their structural stiffness and jointedconstruction.
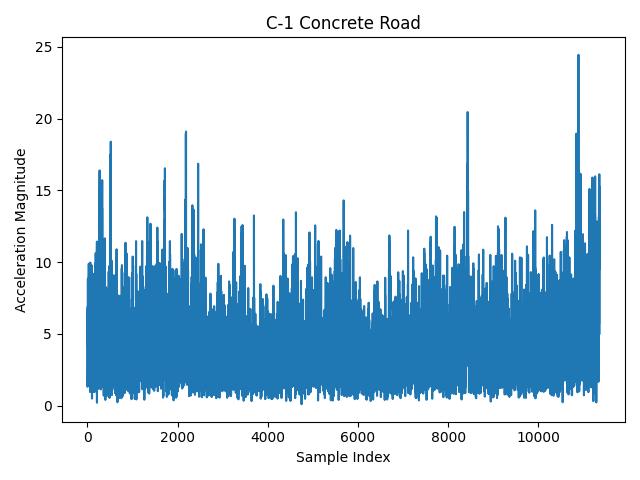
Fig. 5:Accelerationvariationalongcementconcrete pavementsection(C-1)
International Research Journal of Engineering and Technology (IRJET) e-ISSN: 2395-0056
Volume: 13 Issue: 02 | Feb 2026 www.irjet.net p-ISSN: 2395-0072
A comparative evaluation of all selected pavement sections was carried out using average acceleration magnitude as a representative indicator of pavementinduced vibration response. The comparison reveals a clear relationship between pavement surface condition andaccelerationresponse.Thegood-conditionbituminous pavement (B-1) recorded the lowest average acceleration value(2.81),reflectingsuperiorsurfaceconditionandride quality. In contrast, the poor-condition bituminous pavement(B-3)recordedthehighestaverageacceleration value(6.42),confirmingseveresurfacedistress.
The moderate-condition bituminous pavement (B-2) and thecementconcretepavement(C-1)exhibitedcomparable averageaccelerationvaluesof4.33and4.17,respectively. However, their vibration patterns differed in nature: the bituminous pavement showed irregular peaks due to localized surface defects, while the concrete pavement showedperiodicsharpspikesduetopavementjoints.This comparisondemonstratesthatsmartphoneaccelerometer data can capture both pavement condition severity and pavementtypecharacteristics.
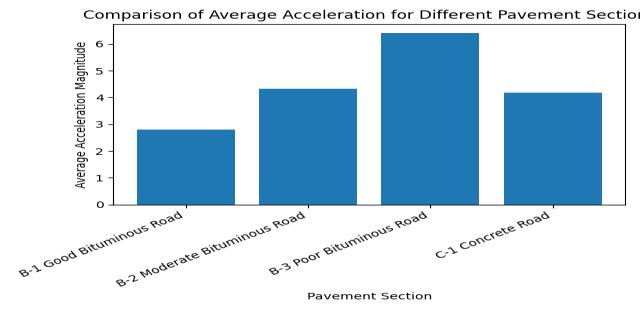
differentpavementsections
To support the graphical comparison, the numerical values of average acceleration magnitude obtained for each pavement section are summarized in tabular form. This table provides quantitative evidence of the variation in pavement surface condition across different pavement typesandconditions.
Table 2:Averageaccelerationmagnitudeforselected pavementsections
Image-basedpavementsurfaceanalysiswascarriedoutto validate the results obtained from smartphone accelerometer data. A large number of pavement surface imagescapturedduringfielddata collectionwerevisually inspectedtoidentifysurfacedistressesandrelatethemto accelerationresponsepatterns.
Images from the poor-condition bituminous pavement section (B-3) clearly showed extensive surface distresses such as potholes, cracking, raveling, and surface breakup. These visible defects corresponded closely with the high and irregular acceleration peaks observed in the sensor data, confirming the reliability of vibration-based pavementconditionassessment.
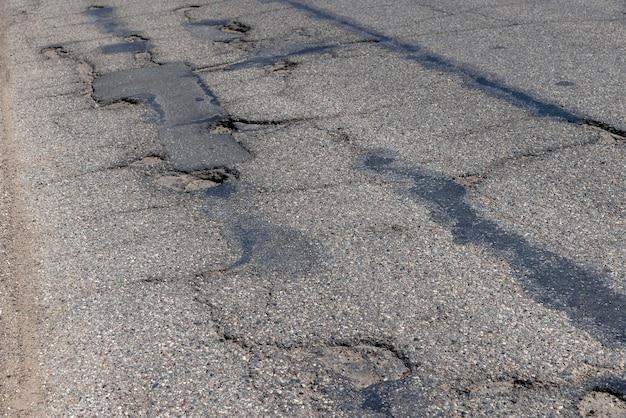
Fig. 7 Pavementsurfacedistressobservedonpoorconditionbituminouspavementsection
Similarly, images captured from the cement concrete pavement section (C-1) revealed joint-related surface irregularities and minor surface distress. The locations of these joints aligned with the sharp acceleration peaks observedintheaccelerationdata.Thisvisualconfirmation further validates the effectiveness of smartphone-based sensinginidentifyingpavementsurfaceirregularities.

Fig. 8 Joint-relatedsurfacedistressobservedoncement concretepavementsection
International Research Journal of Engineering and Technology (IRJET) e-ISSN: 2395-0056
Volume: 13 Issue: 02 | Feb 2026 www.irjet.net p-ISSN: 2395-0072
The detailed results demonstrate that smartphone-based accelerometer data, when combined with image-based pavementsurfaceanalysis,provideareliableandlow-cost method for preliminary pavement surface distress evaluation. The methodology successfully differentiated between good, moderate, and poor pavement conditions without the use of specialized equipment or complex computational techniques. Maintaining consistent data collection conditions minimized the influence of external factorssuchasspeedvariationandvehicle dynamics.The proposed approach is particularly suitable for academic research, rapid pavement condition screening, and applicationsinresource-constrainedenvironments.
This study presented a detailed evaluation of pavement surface distress using smartphone-based accelerometer data combined with image-based pavement surface analysis.Fielddata werecollectedonselectedurban road sections in Gandhinagar, Gujarat, including bituminous pavements with varying surface conditions and a cement concrete pavement section. All data were collected using the same smartphone, consistent mounting position, and controlled vehicle speed to ensure reliability and uniformityinanalysis.
The results obtained from accelerometer data analysis demonstrated a clear relationship between pavement surface condition and vehicle vibration response. The good-condition bituminous pavement section exhibited the lowest acceleration variation, indicating smooth surface characteristics and good ride quality. In contrast, thepoor-conditionbituminouspavementsectionrecorded the highest acceleration magnitudes, reflecting severe surface distresses such as potholes, cracking, and surface disintegration. The moderate-condition bituminous pavement showed intermediate vibration response, correspondingtolocalizedsurfaceirregularities.
The cement concrete pavement section exhibited distinct acceleration characteristics compared to bituminous pavements.Althoughtheconcretepavementdidnotshow severe surface damage, sharp and periodic acceleration peaks were observed due to the rigid nature of concrete and the presence of pavement joints. This highlights that pavement material type significantly influences vibration response,evenwhensurfacedistressseverityismoderate.
Comparative analysis across all pavement sections confirmed that average acceleration magnitude can serve as a useful indicator for preliminary pavement surface condition assessment. The study demonstrated that smartphone accelerometer data are capable of differentiating between good, moderate, and poor pavement conditions, as well as distinguishing between flexibleandrigidpavementbehavior.
Image-basedpavementsurfaceanalysisprovidedeffective validationofthesensor-basedresults.Visualinspectionof pavement surface images showed strong agreement with acceleration response patterns. Locations exhibiting high acceleration peaks corresponded to visible surface distresses such as potholes and joint irregularities, confirming the reliability of the integrated sensor and image-basedapproach.
Overall, the study concludes that smartphone-based sensing combined with image-based pavement inspection provides a practical, low-cost, and reliable method for preliminary pavement surface distress evaluation. The proposed methodology does not require specialized equipment or complex computational techniques, making it suitable for academic research, rapid pavement condition screening, and applications in resourceconstrainedenvironments.
Althoughthepresentstudysuccessfullydemonstratedthe feasibilityofsmartphone-basedpavementsurfacedistress evaluation, several areas for future research can be identified. Future studies may include repeated measurements under varying traffic and environmental conditions to improve robustness. Incorporation of standardized calibration procedures and vehicle suspension characteristics may further enhance accuracy. Image-basedanalysiscanbeextendedusingautomatedor semi-automated techniques for large-scale applications. Additionally, integration of crowd-sourced smartphone data from multiple users may enable continuous and large-areapavementconditionmonitoring.
[1] M. W. Sayers, T. D. Gillespie, and W. D. O. Paterson, Guidelines for Conducting and Calibrating Road RoughnessMeasurements,WorldBank,1986.
[2] R. Haas, W. R. Hudson, and J. Zaniewski, Modern Pavement Management, Krieger Publishing Company, 1994.
[3] ASTM E1926-08, Standard Practice for Computing InternationalRoughnessIndexofRoadsfromLongitudinal ProfileMeasurements,ASTMInternational,2008.
[4]W.D.O.Paterson,RoadDeteriorationandMaintenance Effects,JohnsHopkinsUniversityPress,1987.
[5] S. M. Islam and W. G. Buttlar, “Measuring pavement roughness using vehicle-mounted accelerometers,” TransportationResearchRecord,2012.
[6] A. Mednis et al., “Real-time pothole detection using Androidsmartphones,”Proc.DCOSS,2011.
International Research Journal of Engineering and Technology (IRJET) e-ISSN: 2395-0056
Volume: 13 Issue: 02 | Feb 2026 www.irjet.net p-ISSN: 2395-0072
[7] J. Eriksson et al., “The pothole patrol: Using a mobile sensor network for road surface monitoring,” Proc. MobiSys,2008.
[8] V. Douangphachanh and H. Oneyama, “Estimation of road roughness condition from smartphone acceleration data,”JournalofTransportationEngineering,2014.
[9] P. Mohan et al., “Nericell: Rich monitoring of road and traffic conditions using mobile smartphones,” Proc. SenSys,2008.
[10] J. Fox et al., “Low-cost road roughness measurement using smartphones,” Transportation Research Record, 2015.
[11] S. Jo and S. Ryu, “Pothole detection system using a black-boxcamera,”Sensors,2015.
[12] M. Cheng et al., “Road roughness evaluation using vehicle dynamic response based on smartphone sensors,” Measurement,2019.
BIOGRAPHIES

JadejaKrushanrajsinh Ramsinhisafinal-year undergraduatestudentinthe DepartmentofCivil Engineering(Instituteof Technology)atGanpat University,Gujarat,India.