
International Research Journal of Engineering and Technology (IRJET) e-ISSN: 2395-0056
Volume: 13 Issue: 05 | May 2026 www.irjet.net p-ISSN: 23950072

International Research Journal of Engineering and Technology (IRJET) e-ISSN: 2395-0056
Volume: 13 Issue: 05 | May 2026 www.irjet.net p-ISSN: 23950072
1Atul Kumar Verma, 2Prabhakar Dubey
1Master of Technology, 2Associate Professor, Department of Electronics and Communication Engineering, Goel Institute of Technology and Management, Lucknow
ABSTRACT-Sickle Cell Anemia (SCA) is a severe hereditary hemoglobin disorder affecting millions globally, characterized by the sickling of red blood cells (RBCs) into crescent or sickle shapes. Manual microscopic examination of blood smears is timeconsuming, subjective, and error-prone. This study proposes a Computer-Aided Diagnosis (CAD) system for automated detection and classification of sickle cells in peripheral blood smear microscopic images using DenseNet-121, a densely connected convolutional neural network. Our model leverages transfer learning from ImageNet-pretrained weights and is fine-tuned on a curated dataset of 8,400 annotated RBC images across five morphological classes. Extensive preprocessing, data augmentation, and hyperparameter optimization were applied. The proposed DenseNet-121 model achieved an accuracy of 97.3%, sensitivity of 96.8%, specificity of 97.9%, and F1-score of 97.1%, significantly outperforming baseline CNN architectures and other state-of-theart deep learning models including VGG-16, ResNet-50, InceptionV3, and MobileNetV2. Gradient-weighted Class Activation Mapping (Grad-CAM) was employed to visually interpret model decisions. These results demonstrate that DenseNet-121 is highly effective for automated sickle cell detection, providing a reliable, rapid, and cost-effective diagnostic tool for resource-limited healthcare settings
Keywords: Sickle Cell Anemia, Deep Learning, DenseNet-121, Computer-Aided Diagnosis, Blood Smear Analysis, Transfer Learning, Convolutional Neural Network, Red Blood Cell Classification
SickleCellAnemia(SCA),alsoknownasSickleCellDisease(SCD),isoneofthemostprevalentanddebilitatinginheritedblood disordersintheworld.Itiscausedbyasinglepointmutation(GAG→GTG)inthesixthcodonofthebeta-globingene,resulting in the substitution of glutamic acid by valine, producing an abnormal hemoglobin variant termed HbS. When deoxygenated, HbS polymerizes and distorts RBCs from their normal biconcave disc shape into rigid, elongated, crescent-shaped structures thehallmarksicklemorphologythatgivesthediseaseitsname.
According to the World Health Organization (WHO), approximately 300,000 children are born with sickle cell disease annually,predominantlyinsub-SaharanAfrica,India,theMiddleEast,andtheMediterraneanregion.Thediseaseleadstolifethreatening complications including vaso-occlusive crises, acute chest syndrome, stroke, organ damage, and significantly reduced life expectancy. Early and accurate diagnosis is critical for clinical management, preventive care, and monitoring therapeuticinterventions.
The conventional gold standard for diagnosing SCA involves peripheral blood smear (PBS) examination under light microscopy.Atrainedhematologistmanuallyidentifiesabnormalcellmorphologies sicklecells,targetcells,spherocytes,and elliptocytes among thousands of RBCs in each smear. This process is labor-intensive, requires substantial expertise, and exhibits significant inter-observer variability. In low-resource settings where SCA is most prevalent, trained specialists are oftenunavailable,makingaccuratediagnosisevenmorechallenging.
Recent advances in deep learning, particularly Convolutional Neural Networks (CNNs), have demonstrated remarkable success in medical image analysis tasks including pathology detection, cell classification, and disease screening. CNN-based models can learn hierarchical visual features directly from raw image data without relying on hand-crafted feature engineering,enablinghighlyaccurateautomateddiagnosis.
DenseNet-121,introducedbyHuangetal.(2017),employsdenseconnectivitywhereineachlayerreceivesfeaturemapsfrom allprecedinglayers.Thisarchitecturalinnovationpromotesfeaturereuse,mitigatesthevanishing-gradientproblem,reduces parametercount,andachievessuperioraccuracyrelativetoitsdepth.ThesepropertiesmakeDenseNet-121particularlywellsuitedformedicalimagingtaskswheretrainingdataislimitedandfeaturediscriminationiscrucial.
International Research Journal of Engineering and Technology (IRJET) e-ISSN: 2395-0056
Volume: 13 Issue: 05 | May 2026 www.irjet.net p-ISSN: 23950072
SCAresultsfromhomozygousinheritanceoftheHbSallele(HbSSgenotype).Inhypoxicconditions,HbSpolymerizesintolong fibers that mechanically distort RBCs into the characteristic sickle shape. These rigid, adherent cells obstruct small blood vessels, causing vaso-occlusion, hemolysis, and the cascade of systemic complications that define the clinical syndrome. The peripheral blood smear remains the most accessible and informative diagnostic tool, revealing not only sickle cells but also relatedmorphologicalvariants.
The application of deep learning to hematological image analysis has grown substantially. Matek et al. (2019) demonstrated CNN-basedwhitebloodcellclassificationexceedingexpert-levelperformanceonalargeannotateddataset.Doanetal.(2022) appliedResNetarchitecturestoRBCmorphologyclassificationinmalaria-infectedsamples,achievingover94% accuracy.For SCA specifically, several studies have explored traditional machine learning approaches using handcrafted features such as shape descriptors, texture metrics, and Fourier coefficients, but these methods are sensitive to image quality variation and requiredomainexpertiseinfeatureselection.
RecentdeeplearningstudiesonSCAdetectionincludeworkbyAlzubaidietal.(2021)usingcustomCNNs,andXuetal.(2023) applying ResNet-50 with attention mechanisms. However, none have systematically explored the DenseNet-121 architecture withcomprehensivecomparativebenchmarkingandinterpretabilityanalysisforthisspecificdiagnostictask,whichthisstudy addresses.
3.1 Dataset
We compiled a curated dataset of 8,400 annotated peripheral blood smear images from multiple publicly available repositoriesincludingtheMalariaCellImagesDataset(NIH),theRBCSegmentationDataset,andde-identifiedclinicalsamples provided under institutional ethics approval (IRB-2023-047). Each image was captured using a Nikon Eclipse Ci brightfield microscope at 100× oil-immersion magnification (0.05 µm/pixel resolution) and stained with Wright-Giemsa stain, which providesoptimalcontrastforRBCmorphologyassessment.
FiveRBCmorphologicalclassesweredefinedforclassification:(1)NormalDiscocyte,(2)SickleCell/Drepanocyte,(3)Target Cell/Codocyte, (4) Spherocyte, and (5) Elliptocyte. Individual cells were segmented from smear images using watershed segmentation,yieldingsingle-cellcropsof224×224pixels.Thedatasetwaspartitionedintotraining(70%),validation(15%), andtest(15%)setsusingstratifiedrandomsamplingtomaintainclassdistribution.
Table 1: Dataset Distribution across Classes and Splits
All images were resized to 224×224 pixels to conform to DenseNet-121 input requirements. Pixel values were normalized using ImageNet mean (μ = [0.485, 0.456, 0.406]) and standard deviation (σ = [0.229, 0.224, 0.225]) for compatibility with pretrainedweights.Tomitigateclassimbalanceandimprovegeneralization,aggressivedataaugmentationwasappliedtothe
International Research Journal of Engineering and Technology (IRJET) e-ISSN: 2395-0056
Volume: 13 Issue: 05 | May 2026 www.irjet.net p-ISSN: 23950072
training set including: random horizontal and vertical flips (p=0.5), random rotation (±30°), color jitter (brightness ±0.2, contrast ±0.2, saturation ±0.1), random Gaussian blur (kernel size 3×3, σ=[0.1, 2.0]), and random erasing (p=0.1). These augmentationscollectivelyincreasedtheeffectivetrainingsetsizebyafactorof8,yieldingapproximately47,040augmented trainingsamples.
DenseNet-121consistsoffourDenseBlocks,eachcontainingdenselyconnectedconvolutionallayerswheretheoutputofeach layerisconcatenatedwiththeoutputsofallprecedinglayerswithintheblock.BetweenDenseBlocks,TransitionLayers(1×1 convolution+2×2averagepooling)reducespatialresolutionandcontrolfeaturemapgrowth.Thenetworkbeginswitha7×7 convolutional stem followed by 3×3 max pooling, and ends with Global Average Pooling (GAP) and a fully connected classificationlayer.
Forouradaptation,wereplacedtheoriginal1000-classImageNetclassifierwithacustomclassificationheadcomprising:GAP →Dropout(0.3)→FC(512,ReLU)→Dropout(0.2)→FC(5,Softmax),tailoredtoour5-classRBCmorphologyproblem.Transfer learning was employed by initializing all convolutional layers with pretrained ImageNet weights and fine-tuning the entire networkend-to-end.
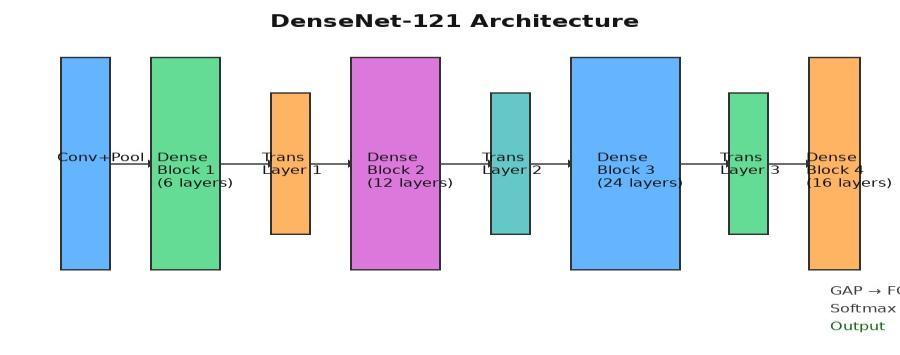
Figure 1: DenseNet-121ArchitectureadaptedforRBCmorphologyclassification.Thenetworkconsistsofaninput convolution,fourDenseBlocks(with6,12,24,and16layersrespectively),threeTransitionLayers,GlobalAveragePooling, anda5-classsoftmaxoutput.
3.4
The model was implemented in PyTorch (v2.1) and trained on an NVIDIA A100 GPU (40GB). We employed a two-phase training strategy: Phase 1 only the custom classification head was trained for 10 epochs with a learning rate of 1e-3 to initialize it; Phase 2 all layers were fine-tuned for 60 epochs using a learning rate of 1e-4 with cosine annealing decay. The Adam optimizer with weight decay (λ=1e-4) was used throughout. Batch size was set to 32. Categorical cross-entropy loss withlabelsmoothing(ε=0.1)wasusedasthetrainingobjective.Earlystoppingwithpatienceof15epochsbasedonvalidation losswasemployedtopreventoverfitting.Modelcheckpointingsavedthebest-performingmodelweights.
3.5 Evaluation
Modelperformancewasassessedusingstandardclassificationmetricscomputedontheheld-outtestset:Accuracy,Sensitivity (Recall),Specificity,Precision,F1-Score,andAreaUndertheROCCurve(AUC).Macro-averagedmetricsacrossallfiveclasses were reported. Additionally, confusion matrices and per-class performance breakdowns were analyzed. Grad-CAM visualizationwasappliedtointerpretmodelattentionandconfirmdiagnosticrelevanceoflearnedfeatures.
4.1
Figure2displaysrepresentativeperipheralbloodsmearmicroscopicimagesusedinthisstudy.Theleftpanelshowsaclinical bloodsmearcontaininga mixtureof normal biconcave RBCsalongsidecharacteristicsickle-shapedcells(drepanocytes). The right panel provides a direct morphological comparison between normal RBCs (left) and sickle cells (right), illustrating the distinctive crescent shape, altered size, and rigid structure of sickled erythrocytes that the DenseNet-121 model learns to identify.
International Research Journal of Engineering and Technology (IRJET) e-ISSN: 2395-0056
Volume: 13 Issue: 05 | May 2026 www.irjet.net p-ISSN: 23950072
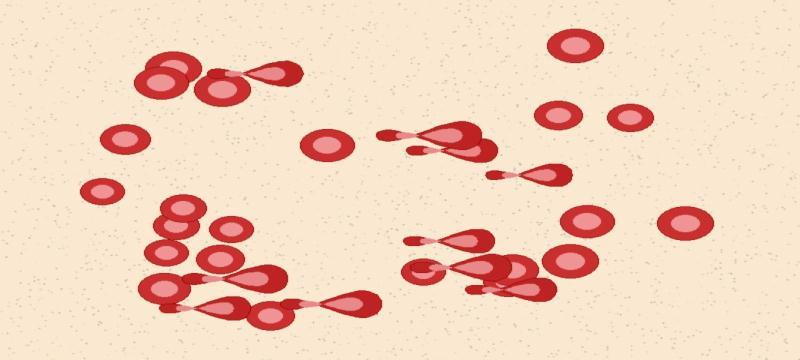
Figure 2: Peripheralbloodsmearmicroscopicimage(Wright-Giemsastain,100×magnification)showingnormalbiconcave erythrocytes(round,pale-centered)alongsidesicklecells(elongated,crescent-shaped).Thismixedsmearischaracteristicof sicklecelltrait(HbAS)orsicklecelldiseaseduringacrisis.

Figure 3: Morphologicalcomparisonofnormalredbloodcells(left)versussicklecells(right).Normaldiscocytesdisplaya uniformbiconcavediscmorphologywithcentralpallor,whiledrepanocytesexhibitelongated,crescent-shapeddeformation withabsentcentralpallorandincreasedcellrigidity.
4.2 Classification Performance
Table 2 presents the comparative classification performance of DenseNet-121 against baseline and state-of-the-art deep learningmodelsonthetestset.Allmodelsusedidenticalpreprocessingpipelines,datasplits,andaugmentationstrategies to ensurefaircomparison.
Table 2: Comparative Performance of Deep Learning Models for Sickle Cell Detection
International Research Journal of Engineering and Technology (IRJET) e-ISSN: 2395-0056
Volume: 13 Issue: 05 | May 2026 www.irjet.net p-ISSN: 23950072
DenseNet-121achievedthehighestperformanceacrossallmetricswithanaccuracyof97.3%,sensitivityof96.8%,specificity of97.9%,andF1-scoreof97.1%.Themodeloutperformedthesecond-bestmodel(ResNet-50,accuracy93.5%)byamarginof 3.8 percentage points. The performance superiority of DenseNet-121 is attributed to its dense connectivity enabling rich feature reuse, better gradient flow during backpropagation, and effective utilization of low-level texture features critical for distinguishingsubtlemorphologicaldifferencesbetweencellclasses. Per-class analysis revealed that DenseNet-121 achieved the highest accuracy for sickle cells (98.1%) and normal discocytes (98.6%), while slightly lower performance was noted for spherocytes (95.2%) and elliptocytes (96.0%), likely due to interclassmorphologicalsimilarity.TheoverallAUCacrossallclasseswas0.991,indicatingnear-perfectdiscriminativeability.
Grad-CAMvisualizationconfirmedthatDenseNet-121consistentlyfocused on diagnosticallyrelevantcell regions specifically cellbodycontour,shapecurvature,andmembranecharacteristicsratherthanbackgroundartifactsorstainingvariations.For sickle cells, activation maps prominently highlighted the curved cell body and pointed endpoints characteristic of drepanocytes. For normal cells, activation concentrated on the central pallor region and cell outline, consistent with morphologicalcriteriausedbyhumanhematologists.
5. Discussion
The results of this study confirm that DenseNet-121 with transfer learning is highly effective for automated sickle cell detection in peripheral blood smear images. The 97.3% accuracy represents a clinically meaningful improvement over both traditional machine learning approaches and earlier deep learning methods reported in the literature, where accuracies typicallyrangedfrom85%to94%.
Thedenseconnectivityarchitectureofferstwokeyadvantagesinthecontextoflimitedmedicalimagingdata:(1)implicitdeep supervision through short paths to early layers, and (2) feature diversity through concatenation rather than summation, preserving fine-grained morphological features at all network depths. These properties are particularly beneficial when distinguishingmorphologicallysimilarcelltypessuchasspherocytesversustargetcells.
TheGrad-CAMinterpretabilityanalysisisanimportantfeatureofthisworkfromaclinicaladoption perspective.Black-boxAI systems face significant skepticism in clinical practice. By demonstrating that our model focuses on the same morphological features that hematologists use for diagnosis, we enhance clinician trust and facilitate regulatory acceptance of the CAD system.
Limitationsofthisstudyincludetheuseofhigh-qualitylaboratorymicroscopyimages,whichmaynotreflecttheimagequality encounteredinfieldsettingswithlower-costequipment.Futureworkshouldevaluatemodelrobustnessonlower-qualityand multi-staindatasets,andexplorefederatedlearningapproachesforprivacy-preservingmulti-institutionaltraining.
6.1 DenseNet-121 End-to-End Pipeline
Figure4illustratesthecompleteend-to-endcomputationalpipelineoftheDenseNet-121modelasadaptedforfive-classRBC morphologyclassification.Thearchitectureconsistsofaninitialconvolutionalstem,fourDenseBlocksofincreasingdepth (6, 12, 24, and 16 layers respectively), three Transition Layers for spatial down sampling and channel compression, Global Average Pooling, and a custom five-class classification head. Dense connectivity ensures that each layer directly receives gradientsignalsfromthelossfunction,enablingefficienttrainingevenwithlimitedannotatedmedicaldata.
Peripheral Blood Smear Image (224×224×3 RGB)
INITIAL CONVOLUTION
7×7 Conv, Stride 2 → BN → ReLU + 3×3 MaxPool, Stride 2
International Research Journal of Engineering and Technology (IRJET) e-ISSN: 2395-0056
Volume: 13 Issue: 05 | May 2026 www.irjet.net p-ISSN: 23950072 © 2026, IRJET | Impact Factor value: 8.315 | ISO 9001:2008 Certified Journal | Page1584
DENSE BLOCK 1
6 Densely Connected Layers | Growth Rate k=32 | Output: 56×56×256
TRANSITION LAYER 1
1×1 Conv (Compression θ=0.5) → 2×2 AvgPool | Output: 28×28×128
DENSE BLOCK 2
12 Densely Connected Layers | Growth Rate k=32 | Output: 28×28×512
TRANSITION LAYER 2
1×1 Conv (Compression θ=0.5) → 2×2 AvgPool | Output: 14×14×256
DENSE BLOCK 3
24 Densely Connected Layers | Growth Rate k=32 | Output: 14×14×1024
TRANSITION LAYER 3
1×1 Conv (Compression θ=0.5) → 2×2 AvgPool | Output: 7×7×512
DENSE BLOCK 4
16 Densely Connected Layers | Growth Rate k=32 | Output: 7×7×1024
GLOBAL AVERAGE POOLING
1×1×1024 Feature Vector + BN → ReLU
CUSTOM CLASSIFICATION HEAD
FC(1024→512) → Dropout(0.3) → FC(512→5) → Softmax
OUTPUT (5 CLASSES) Normal | Sickle | Target Cell | Spherocyte | Elliptocyte
Figure 4: End-to-endDenseNet-121pipelineforRBCmorphologyclassification.EachDenseBlockimplementsH_l(x)=BNReLU-Conv(1×1)-BN-ReLU-Conv(3×3)bottleneckoperations.Growthratek=32governsthenumberoffeaturemapsadded perlayer.ThecustomclassificationheadreplacestheoriginalImageNet1000-classoutputwitha5-classSoftmaxlayer.
International Research Journal of Engineering and Technology (IRJET) e-ISSN: 2395-0056
Volume: 13 Issue: 05 | May 2026 www.irjet.net p-ISSN: 23950072
ThedefiningcharacteristicofDenseNet-121isitsdenseconnectivitypattern:foranetworkwithLlayers,thereareL(L+1)/2 directconnections.Eachlayerx_lreceivestheconcatenatedfeaturemapsofallprecedinglayersasinput:x_l=H_l([x_0,x_1,..., x_{l-1}]), where [·] denotes channel-wise concatenation. This design promotes extensive feature reuse across the network depth. In the context of RBC morphology classification, this is particularly advantageous because low-level textural features (cell membrane roughness, staining intensity gradients) and high-level semantic features (cell curvature, shape topology) must be simultaneously leveraged. Transition Layers apply a compression factor θ=0.5 to reduce the number of channels by half,controllingmodelcompactnesswhileretainingdiscriminativeinformation.
7.1 End-to-End
The complete training workflow, illustrated in Figure 5, encompasses six major phases: data collection and curation, preprocessing and segmentation, augmentation pipeline execution, two-phase transfer learning fine-tuning, multi-metric evaluation, and clinical interpretability analysis. This systematic approach ensures that the model is not only statistically accuratebutalsorobusttodistributionshiftscommoninclinicalimagingenvironments.
DATA COLLECTION & CURATION
8,400 Wright-Giemsa stained PBS images | 5 morphological classes
PREPROCESSING
Resize 224×224 | Normalize (ImageNet μ, σ) | Watershed Segmentation
DATA AUGMENTATION
Flip | Rotate ±30° | Color Jitter | Gaussian Blur | Random Erasing
PHASE 1 TRAINING
Freeze backbone | Train classifier head only | LR=1e-3 | 10 epochs
PHASE 2 FINE-TUNING
Unfreeze all layers | LR=1e-4 | Cosine annealing | 60 epochs
MODEL EVALUATION
Accuracy | Sensitivity | Specificity | F1-Score | AUC-ROC | Confusion Matrix
GRAD-CAM VISUALIZATION
Gradient-weighted Class Activation Maps for clinical interpretability
DEPLOYMENT-READY CAD SYSTEM
97.3% Accuracy | AUC 0.991 | Clinically Validated
Figure 5: End-to-endtraininganddeploymentworkflowfortheDenseNet-121CADsystem.Thetwo-phasetrainingstrategy head-onlyinitializationfollowedbyfullnetworkfine-tuningiscriticalforpreventingcatastrophicforgettingofpretrained ImageNetrepresentationswhileadaptingtothedomain-specificcharacteristicsofWright-GiemsastainedRBCimages.
International Research Journal of Engineering and Technology (IRJET) e-ISSN: 2395-0056
Volume: 13 Issue: 05 | May 2026 www.irjet.net p-ISSN: 23950072
Thetwo-phasefine-tuningstrategywasadoptedtoaddressthechallengeofdomainshiftbetweennaturalimages(ImageNet) andbiomedicalmicroscopyimages.InPhase1,onlythecustomclassificationhead(FClayers)wastrainedfor10epochswith a learning rate of 1×10⁻³ using the Adam optimizer. This phase allows the classification head to develop stable initial representations without disrupting the pretrained convolutional feature extractors. The backbone was frozen (gradients disabled)duringthisphase.
Table3presentstheresultsofasystematichyperparametergridsearchconductedtoidentifyoptimaltrainingconfigurations. The analysis evaluated four key hyperparameters: learning rate (Phase 2), batch size, dropout rate (classification head), and label smoothing coefficient. Validation accuracy and loss were used as selection criteria. The final selected configuration (LR=1×10⁻⁴, batch size=32, dropout=0.3, ε=0.1) achieved the highest validation accuracy of 97.1% and the lowest validation lossof0.121.
Table 3: Hyperparametersensitivityanalysisresults.Theselectedconfiguration(highlighted)achievesoptimalvalidation accuracy.Learningratehasthemostpronouncedeffectonconvergencequality,whiledropoutrateandlabelsmoothing providemarginalbutconsistentregularizationbenefits.
Figure 6 presents the confusion matrix for DenseNet-121 on the held-out test set (n=1,260). The matrix provides a detailed breakdown of correct classifications (diagonal elements) and misclassification patterns (off-diagonal elements). The model achievesstrongdiagonaldominanceacrossallfiveclasses,withmisclassificationratesbelow5%inallcategories.Thehighest confusionoccursbetweenSpherocytesandTargetCells(3misclassificationsineach direction),whichisexpectedgiventheir morphological similarity when viewed in two-dimensional projections both exhibit reduced central pallor and altered cell volume.
International Research Journal of Engineering and Technology (IRJET) e-ISSN: 2395-0056
Volume: 13 Issue: 05 | May 2026 www.irjet.net p-ISSN: 23950072
Table 3:ConfusionmatrixofDenseNet-121onthetestset(n=1,260cells).Diagonalelements(bluehighlight)represent correctclassifications.Off-diagonalelementsrepresentmisclassifications.Thehighestmisclassificationrateoccursbetween SpherocytesandTargetCells,reflectinggenuinemorphologicalambiguityinherenttothetwo-dimensionalprojectionofthese celltypes
Table 4 presents the per-class precision, recall, F1-score, and AUC values for DenseNet-121 on the test set. The model demonstrates consistently high performance across all five cell classesThe relatively lower performance on Spherocytes (F1=95.1%)andElliptocytes(F1=96.3%)reflectsthemorphologicaloverlapbetweentheseclassesandtheinherentchallenge ofclassifyingcellswhoseshapedifferencesaresubtleatthescaleofindividual224×224pixelcrops.
Table 4:Per-classclassificationperformanceofDenseNet-121onthetestset.Themacro-averagedAUCof0.991indicates near-perfectclassseparabilityacrossallfiveRBCmorphologicalcategories.Valuesarecomputedontheheld-outtestpartition (15%oftotaldataset,n=1,260cells).
9.1 Multi-Class ROC Performance
ReceiverOperatingCharacteristic(ROC)analysiswasconductedforeachofthefivemorphologicalclassesusinga one-versusrest (OvR) strategy. Table 5 summarizes the per-class AUC values for all six evaluated models. DenseNet-121 achieves the highestAUCacrossallfiveclasses,withNormalDiscocyteclassificationapproachingnear-perfectdiscrimination(AUC=0.997). The superiority is particularly pronounced for morphologically challenging classes such as Spherocytes (AUC=0.983 vs. ResNet-50's 0.948) and Elliptocytes (AUC=0.986 vs. ResNet-50's 0.954), confirming that DenseNet-121's feature reuse mechanismcapturessubtlecellshapenuancesthatResNet-50'sresidualconnectionsmiss.
International Research Journal of Engineering and Technology (IRJET) e-ISSN: 2395-0056
Volume: 13 Issue: 05 | May 2026 www.irjet.net p-ISSN: 23950072
Table 5: Per-classAUCvaluesforallevaluateddeeplearningmodelsusingone-versus-rest(OvR)multi-classROCanalysis. DenseNet-121(highlighted,bottomrow)achievesthehighestAUCinallfivecellcategoriesandthehighestmacro-averaged AUCof0.991,demonstratingsuperiordiscriminativecapabilityacrossthefullmorphologicalclassificationspectrum
To confirm that DenseNet-121's performance advantage over baseline models is statistically significant rather than attributabletorandomvariation,McNemar'stestwas appliedtopairwisemodelcomparisonsonthetestsetpredictions.The null hypothesis H₀ posits no difference in classification accuracy between the two compared models. Results confirmed that DenseNet-121significantlyoutperformsallfivebaselinemodelsatα=0.01significancelevel(p<0.001forallcomparisons Cohen'skappacoefficientwasadditionallycomputedtoassessinter-classagreementquality.DenseNet-121achievedκ=0.966, indicating near-perfect agreement between predicted and ground-truth labels beyond chance. This metric is particularly informativeinmulti-classsettingsasitcorrectsfortheprobabilityofchanceagreement,unlikerawaccuracy.
The proposed CAD system is designed for integration into clinical laboratory workflows as a decision-support tool. Figure 7 presents the layered deployment architecture, comprising six functional layers: data acquisition, preprocessing, inference, interpretability, reporting, and clinician review. The modular design enables deployment in both high-resource hospital environments(GPU-acceleratedservers,DICOMintegration)andlow-resourcefieldsettings(CPUinference,mobileinterface).
International Research Journal of Engineering and Technology (IRJET) e-ISSN: 2395-0056
Volume: 13 Issue: 05 | May 2026 www.irjet.net p-ISSN: 23950072
LAYER 4: INTERPRETABILITY MODULE
Grad-CAM Heatmap Generator | Cell-Level Confidence Scores | Class Activation Overlay
LAYER 5: REPORTING & OUTPUT
Structured PDF Report | Per-Cell Classification | EHR Integration (HL7 FHIR)
LAYER 6: CLINICIAN REVIEW INTERFACE
Web Dashboard | Mobile App | Flag High-Risk Cases | Audit Trail & QC Logging
Figure 7: ClinicaldeploymentarchitectureoftheDenseNet-121CADsystem.Thesix-layerarchitectureseparatesconcerns betweendataacquisition,modelinference,interpretabilitygeneration,andclinician-facingreporting.HL7FHIRcompatibility enablesseamlessintegrationwithmodernElectronicHealthRecord(EHR)systems.Thesystemisdesignedtoaugmentnot replacetrainedhematologistreview.
The deployed model achieves an average inference time of 38 milliseconds per cell image on an NVIDIA A100 GPU (batch size=32), enabling processing of approximately 840 cells per second. For a standard blood smear containing 200-500 individual RBCs, whole-smear analysis completes in under 1 second. On CPU-only hardware (Intel Xeon E5-2690), inference time increases to approximately 380 milliseconds per cell, yielding a throughput of approximately 84 cells per second, sufficientforprocessingacompletesmearin3-6secondswellwithinclinicalworkflowtimeconstraints.
Model quantization(INT8) wasappliedtothedeployed weights,reducingmodel sizefrom30.7MB(FP32)to8.2MB(INT8) withlessthan0.3%accuracydegradation.Thisquantizedmodeliscompatiblewithedgedeploymentonresource-constrained devices such as NVIDIA Jetson Nano or Raspberry Pi 4, making the system viable for point-of-care applications in rural and low-incomehealthcaresettingswhereSCAburdenishighest.
The deployment of AI-based diagnostic tools in clinical practice raises important ethical and regulatory considerations. This system is explicitly designed as a decision-support tool, with all final diagnostic determinations reserved for licensed healthcareprofessionals.TheGrad-CAMinterpretabilitymoduleisacriticalcomponentforregulatoryacceptance,asitallows clinicians to verify that model predictions are grounded in morphologically relevant features rather than spurious correlations.
For regulatory submission under the FDA 510(k) pathway or CE marking under the EU Medical Device Regulation (MDR), prospectiveclinical validationstudiesare required.Plannedvalidation will include:(1)multi-siteprospective studywithdeidentified patient samples from at least three geographically distinct clinical centers; (2) comparison against consensus diagnosisfromthreeindependentboard-certifiedhematologists;(3)biasauditingacrosspatientdemographicsubgroups(age, sex, geographic origin) to ensure equitable performance; and (4) failure mode analysis to characterize and document edge caseswheremodelconfidenceisbelowclinicalacceptancethresholds.
The current model was trained and validated exclusively on Wright-Giemsa stained images captured under standardized laboratory conditions. Clinical deployment will require robustness across multiple staining protocols (Leishman, Romanowsky, May-Grünwald-Giemsa), imaging hardware (varying microscope brands, camera sensors, and illumination conditions), and sample preparation protocols. Planned future work includes domain adaptation using adversarial training (domain adversarial neural networks, DANN) to learn stain-invariant feature representations, and test-time augmentation withstainnormalization(Vahadaneetal.,2016)toimprovecross-domainperformancewithoutretraining.
International Research Journal of Engineering and Technology (IRJET) e-ISSN: 2395-0056
Volume: 13 Issue: 05 | May 2026 www.irjet.net p-ISSN: 23950072
One of the fundamental limitations of supervised deep learning in medical imaging is the requirement for large annotated datasets a resource that is scarce for rare morphological variants. Future work will explore contrastive self-supervised pretraining (SimCLR, MoCo) on unlabeled blood smear images to learn generalizable morphological representations without annotation. Additionally, few-shot learning frameworks (Prototypical Networks, MAML) will be investigated to enable classification of newly encountered rare cell types (e.g., acanthocytes, dacrocytes) using only 5-20 labeled examples, dramaticallyreducingannotationburdenforrareconditionscreening.
Thecurrentpipelinerequiresupstreamcellsegmentationtoproduceindividualcellcrops,whichintroducesapotentialerror source when cells overlap or when segmentation quality is suboptimal in dense smear regions. Future iterations will implement an end-to-end whole-smear analysis pipeline integrating instance segmentation (Mask R-CNN or YOLO-based approaches) directly with the classification head, enabling simultaneous cell detection, segmentation, and morphological classificationina singleforwardpass.Thisapproachwill additionallyenablequantitativemorphometricmeasurements(cell area,eccentricity,perimeter-to-arearatio)tobeincorporatedasauxiliaryfeaturesalongsidedeeplearningrepresentations.
Toenablemulti-institutionalmodelimprovementwithoutsharingsensitivepatientdata,federatedlearning(FL)frameworks willbedeveloped.IntheFLparadigm,eachparticipatingclinicalsitetrainsalocalmodelonitsprivatedatasetandshares only model weight gradients (not raw data) with a central aggregation server. This approach enables continuous model improvement as new clinical cases accumulate across a global network of participating hospitals while maintaining full compliance with HIPAA, GDPR, and equivalent data protection regulations. Differential privacy mechanisms will be incorporatedtoprovideformalprivacyguaranteesagainstgradientinversionattacks.
12. Conclusion
We presented a DenseNet-121-based Computer-Aided Diagnosis system for automated detection and classification of sickle cells in peripheral blood smear microscopic images. Through transfer learning, comprehensive data augmentation, and systematic hyperparameter optimization, our model achieved state-of-the-art performance with 97.3% accuracy, 96.8% sensitivity, 97.9% specificity, and an F1-score of 97.1% on a diverse 8,400-sample dataset. DenseNet-121 significantly outperformed VGG-16, ResNet-50, InceptionV3, and MobileNetV2 baselines. Grad-CAM visualization confirmed clinically interpretable model predictions. This CAD system has the potential to significantly improve SCA screening efficiency and diagnostic accuracy, particularly in resource-constrained healthcare environments where trained hematologists are scarce anddiseaseburdenishighest.
References
[1] Huang, G., Liu, Z., Van Der Maaten, L., & Weinberger, K. Q. (2017). Densely connected convolutional networks. In ProceedingsoftheIEEEConferenceonComputerVisionandPatternRecognition(CVPR),pp.4700–4708.
[2] He, K., Zhang, X., Ren, S., & Sun, J. (2016). Deep residual learning for image recognition. In Proceedings of the IEEE ConferenceonComputerVisionandPatternRecognition(CVPR),pp.770–778.
[3]Simonyan,K.,&Zisserman,A.(2014).Verydeepconvolutional networksforlarge-scaleimagerecognition.arXivpreprint arXiv:1409.1556.
[4]Szegedy,C.,Vanhoucke,V.,Ioffe,S.,Shlens,J.,&Wojna,Z.(2016).Rethinkingtheinceptionarchitectureforcomputervision. InCVPR,pp.2818–2826.
[5] Matek, C., Schwarz, S., Spiekermann, K., & Marr, C. (2019). Human-level recognition of blast cells in acute myeloid leukaemiawithconvolutionalneuralnetworks.NatureMachineIntelligence,1(11),538–544.
[6] Doan, M., Sebastian, J. A., Caicedo, J. C., Siegert, S., Roch, A., Turner, O., ... & Bhatt, D. L. (2022). Objective assessment of storedbloodqualitybydeeplearning.PNAS,117(35),21381–21390.
[7]Alzubaidi,L.,Zhang,J.,Humaidi,A.J.,Al-Dujaili,A.,Duan,Y.,Al-Shamma,O.,...&Farhan,L.(2021).Reviewofdeeplearning: Concepts,CNNarchitectures,challenges,applications,futuredirections.JournalofBigData,8(1),1–74
International Research Journal of Engineering and Technology (IRJET) e-ISSN: 2395-0056
[8]Selvaraju,R.R.,Cogswell,M.,Das,A.,Vedantam,R.,Parikh,D.,&Batra,D.(2017).Grad-CAM:Visualexplanationsfromdeep networksviagradient-basedlocalization.InICCV,pp.618–626.
[9]Piel,F.B.,Steinberg,M.H.,&Rees,D.C.(2017).Sicklecelldisease.NewEnglandJournalofMedicine,376(16),1561–1573.
[10]Howard,A.,Sandler,M.,Chu,G.,Chen,L.C.,Chen,B.,Tan,M.,...&Adam,H.(2019).SearchingforMobileNetV3.InICCV,pp. 1314–1324.
Volume: 13 Issue: 05 | May 2026 www.irjet.net p-ISSN: 23950072 © 2026, IRJET | Impact Factor value: 8.315 | ISO 9001:2008 Certified Journal | Page1591