
International Research Journal of Engineering and Technology (IRJET) e-ISSN: 2395-0056
Volume: 13 Issue: 01 | Jan 2026 www.irjet.net p-ISSN: 2395-0072
International Research Journal of Engineering and Technology (IRJET) e-ISSN: 2395-0056
Volume: 13 Issue: 01 | Jan 2026 www.irjet.net p-ISSN: 2395-0072
R.
Kanmani1, C. Dhilip2, P. Dineshkumar3 , S. Dinesh4
1 , Assistant Professor, Sri Vijay Vidyalaya College of Pharmacy, Tamil Nadu, India. 2, 3, 4, B. Pharm students, Sri Vijay Vidyalaya College of Pharmacy, Tamil Nadu, India.
Abstract- Objective: To assess the effectiveness of natural indicators derived from Celosiacristata flowers and red dragon fruit peel in acid–base titrations and to compare their performance with commonly used synthetic indicators in terms of accuracy, sensitivity, and color transition.
Methodology: Petals of Celosia cristata and peels of red dragon fruit were collected and ground using a mortar and pestle. The crushed materials were subjected to maceration for 24 hours using ethanol and acetone as solvents. The extracts were then filtered using Whatman filter paper. The obtained filtrates were utilized as natural indicators for acid–base titrations and stored in amber-colored bottles to prevent degradation.
Conclusion: The natural indicators exhibited titration end points comparable to those of synthetic indicators. UV–visible spectroscopic analysis confirmed their pH-responsive behavior. Hence, these natural extracts can serve as effective, ecofriendly alternatives to conventional synthetic indicators in acid–base titrations.
Keywords: Celosia cristata, red dragon fruit peel, pH measurement, acid–base titration, UV–visible spectroscopy.
Introduction
Acid–basechemistryisacoreareaofchemistrythatprovidesthebasisforunderstandingrelatedtopicssuchasacid–base titrations,buffersolutions,andsalthydrolysis.Theconceptofacidsandbasesrequiresstudentstograspdifferentlevelsof representation,includingobservable(macroscopic),particle-level(microscopic),andsymbolicinterpretations.Acid–base titrationisaquantitativeanalyticalmethodusedtomeasuretheconcentrationofanacidicorbasicsolutionbyreactingit with a standard solution of known strength. It can also be described as a laboratory technique designed to obtain informationaboutsolutionscontainingacidicorbasicsubstances.Awiderangeofcompounds,includingbothorganicand inorganicsubstances,canbeanalysedthroughtitrationbasedontheiracidicorbasicnature.Duringthetitrationprocess, anacidreactswithabaseorviceversa,andthecompletionofthereactionisdetectedusingasuitableindicator. Acid–base titrations may involve combinations of strong and weak acids and bases and are commonly applied to determine the concentrationofunknownsolutionsandtoassesstherelativestrengthofacidsorbases. Differenttypesofindicatorsare used in acid–base titrations, with commonly employed laboratory indicators including methyl red, methyl orange, phenolphthalein, phenol red, methyl yellow, pentamethoxy red, bromophenol blue, and thymol blue. Among these, phenolphthalein and methyl orange are most widely used. Indicators are substances that undergo a visible color change withinaspecificpHrange.Mostindicatorsareorganiccompounds,andphenolphthaleinisoftenpreferredduetoitssharp andeasilynoticeablecolortransition,especiallyinstrongacid–strongbasetitrations.Methylorangeisgenerallyselected forstrongacid–weakbasetitrationsbecauseitchangescolorrapidlyneartheequivalencepoint.Inweakacid–weakbase titrations, neither phenolphthalein nor methyl orange is appropriate, as the pH change near the equivalence point is not sufficiently steep; therefore, indicators are usually not used. For titrations involving a weak acid and a strong base, phenolphthaleiniscommonlychosenbecauseitprovidesadistinctcolorchangeattheequivalencepoint.
Because acid–base titrations are based on neutralization reactions between acids and bases, they are also known as neutralizationtitrations.Indicatorsarecoloredpigmentsordyesthatcanbeobtainedfromvariousnatural sources such as plants, fungi, and algae. Nearly all red, blue, or purple-colored fruits and flowers contain a group of natural pigments calledanthocyanins,whichexhibitpH-dependentcolourchanges.
International Research Journal of Engineering and Technology (IRJET) e-ISSN: 2395-0056
Volume: 13 Issue: 01 | Jan 2026 www.irjet.net p-ISSN: 2395-0072
PLANT PROFILE:

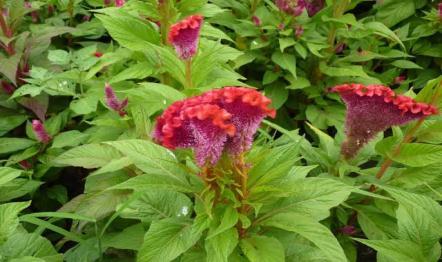
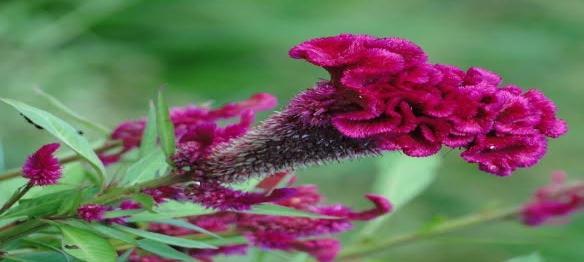

TAXONOMY CLASSIFICATION:
Kingdom:Plantae
Class: Magnoliopsida
Order: Caryophyllales
Family: Amaranthaceae
Genus: Celosia
Species: Cristata
Synonyms: Celosiaargenteavar.cristata
PLANT PROFILE:

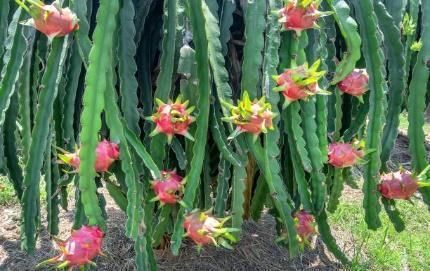
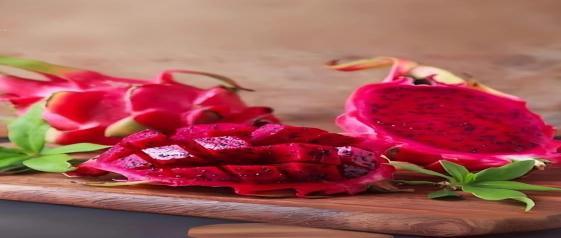

TAXONOMY CLASSIFICATION:
Domain: Eukaryota
Kingdom: Plantae
Phylum: Tracheophyta
Subphylum: Spermatophytina
Class: Magnoliopsida
Order: Caryophyllales
Family: Cactaceae
Genus: Hylocereus
Species: Hylocereuspolyrhizus
Synonym: Hylocereusmonacanthus,Selenicereusmonacanthus
METHODOLOGY:
Materials: The materials are Celosia cristata flowers, red dragon fruit peels, distilled water, ethanol, acetone, sodium hydroxide,concentratedhydrochloricacid,phenolphthalein,andmethylorange.
Apparatus: Theapparatusconsistsofamortarandpestle,weighingbalance,beakers,conicalflask,burette,pipette,retort standwithclamp,whitetile,washbottle,spatula,stirrer,andfilterpaper(Whatman40).
International Research Journal of Engineering and Technology (IRJET) e-ISSN: 2395-0056
Volume: 13 Issue: 01 | Jan 2026 www.irjet.net p-ISSN: 2395-0072
Collection of plants: Celosia cristata flowers and red dragon fruit peels were collected from the nearby villages around Dharmapuridistrict,TamilNadu,India.
Extraction Procedure
Preparation of Acetone and Ethanol Extracts:
Theflowerpetalsandfruitpeelswerethoroughlyrinsedwithdistilledwaterandcutintosmallpieces.Theplantmaterials were then ground using a mortar and pestle to obtain a fine paste. The crushed samples were transferred into separate 250 mL iodine flasks containing 50 mL of absolute ethanol and acetone, respectively. The flasks were stored in a dark cupboardfor24hourstoallowcompletemacerationandefficientextractionofpigments.Aftertheextractionperiod,the mixtures were filtered using Whatman filter paper, and the clear filtrates were collected. These extracts were used as natural indicators in titration experiments, while phenolphthalein and methyl orange served as reference synthetic indicators.
Determination of pH Range
Step 1: Calibration of the pH Meter
The pH meter was calibrated using standard buffer solutions of known pH values to ensure accurate and reliable measurements.
Step 2: Preparation of Natural Indicator Solution
Plant extracts were prepared using ethanol and acetone as solvents through the maceration method involving flower petalsandfruitpeels.
Step 3: Measurement of Ph
ThepHofeachpreparednaturalindicatorsolutionwasmeasuredcarefullyusingthecalibratedpHmeter.
Step 4: Identification of pH Range
The approximate pH range over which each natural indicator exhibited visible color changes was determined by observingitsbehaviorinacidicandbasicmedia.
Preparation of Solutions
Preparation of 0.1 M Sodium Hydroxide Solution:
Atotalof4.2gofsodiumhydroxidewasdissolvedindistilledwateranddilutedtoafinalvolumeof1000mL.
Preparation of 0.1 M Hydrochloric Acid Solution:
Approximately 8.5 mL of concentrated hydrochloric acid was diluted with distilled water to make up a final volume of 1000mL.
Titration Procedure
A volume of 20 mL of the titrant was taken in a conical flask,and 2–3 drops of a standard indicator (phenolphthalein or methylorange)wereadded.Titrationswerecarriedoutbetweentwoacid–basesystems,namelystrongacid(hydrochloric acid)versusstrongbase(sodiumhydroxide).Separately,1mLofeachethanolandacetoneextractoftheflowerpetalsand fruitpeelswasusedasa natural indicatorindifferentconical flasks.Eachtitration wasperformedintriplicate toensure precision and reproducibility. The same titrations were repeated using standard synthetic indicators, and the results obtainedusingnaturalindicatorswerecomparedwiththosefromsyntheticindicators.Allobservationsandreadingswere recordedsystematically.
International Research Journal of Engineering and Technology (IRJET) e-ISSN: 2395-0056
Volume: 13 Issue: 01 | Jan 2026 www.irjet.net p-ISSN: 2395-0072
Ultraviolet (UV) Spectroscopic Analysis
Procedure:
UV–visible spectroscopic analysis was carried out using a Genesys 180 UV–Vis spectrophotometer. Prior to analysis, the cuvetteswerethoroughlycleanedwithdistilledwater.Theinstrumentwascalibratedusingethanolandacetoneasblank solvents at a wavelength of 400 nm. For analysis, 1 mL of each plant extract was diluted with 5 mL of the respective solvent.Approximately5mLofthedilutedextractwastransferredintothecuvette,andabsorbancemeasurementswere recorded in the visible region ranging from 200 to 400 nm. The wavelength of maximum absorption (λmax) for each extractwasdeterminedfromtheobtainedabsorptionspectra.
Results:
PH range determination:
Ethanolextract: Celosiacristataflowerextract=6.60andreddragonfruitpeelextract=5.87.
Acetoneextract: Celosiacristataflowerextract=6.01andreddragonfruitpeelextract=5.84.
Table no.: 01 Titration process:
Ethanolextractsreddragonfruitpeel
Acetoneextractscelosiacristata
Acetoneextractsreddragonfruitpeel
UV Spectrum analysis:
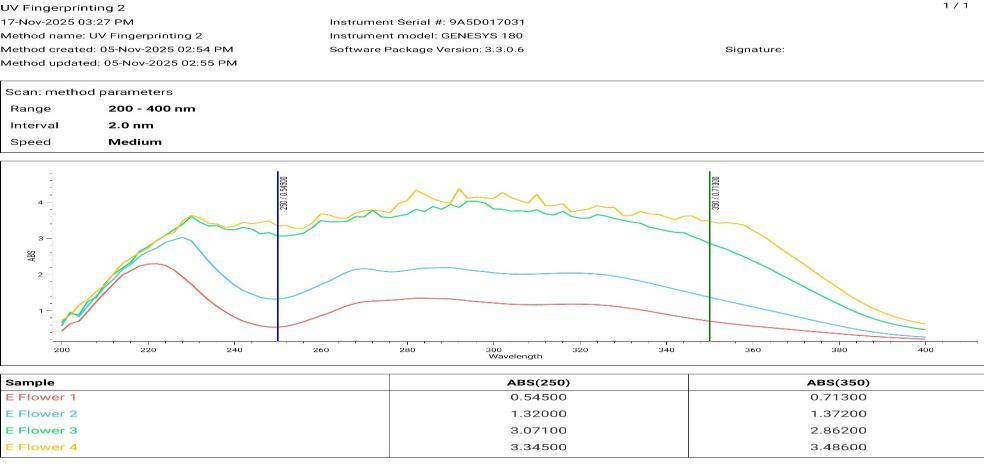
no: 03 Ethanol Extract of Celosia
International Research Journal of Engineering and Technology (IRJET) e-ISSN: 2395-0056
Volume: 13 Issue: 01 | Jan 2026 www.irjet.net p-ISSN: 2395-0072
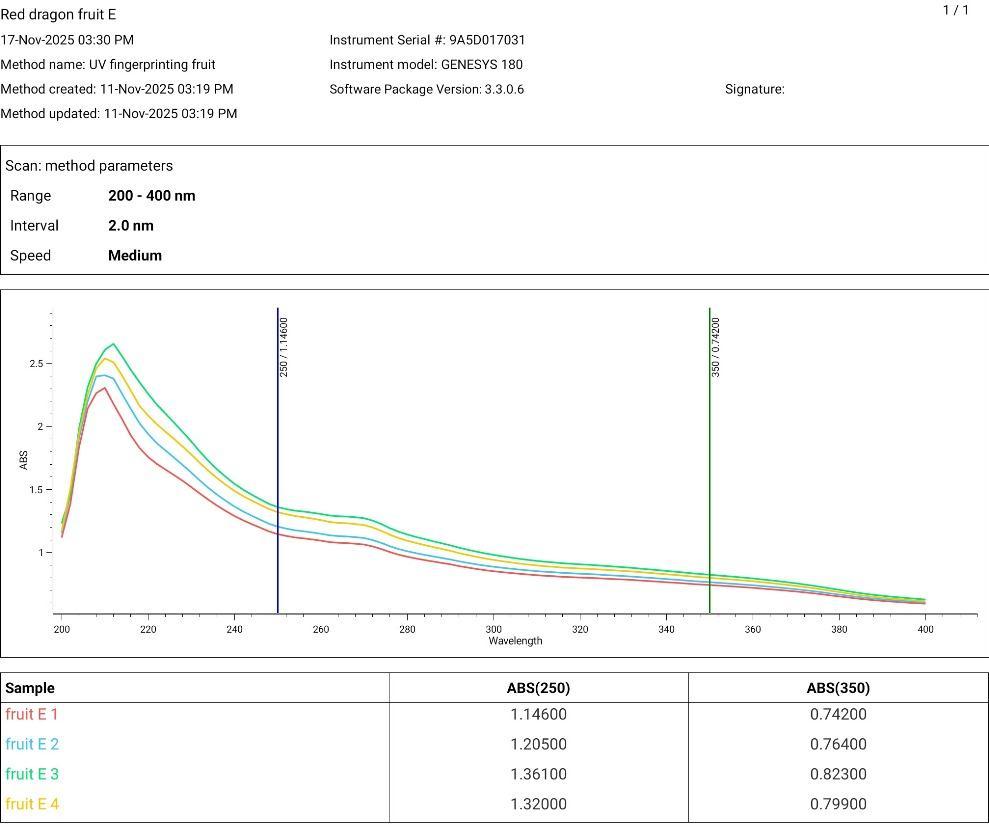
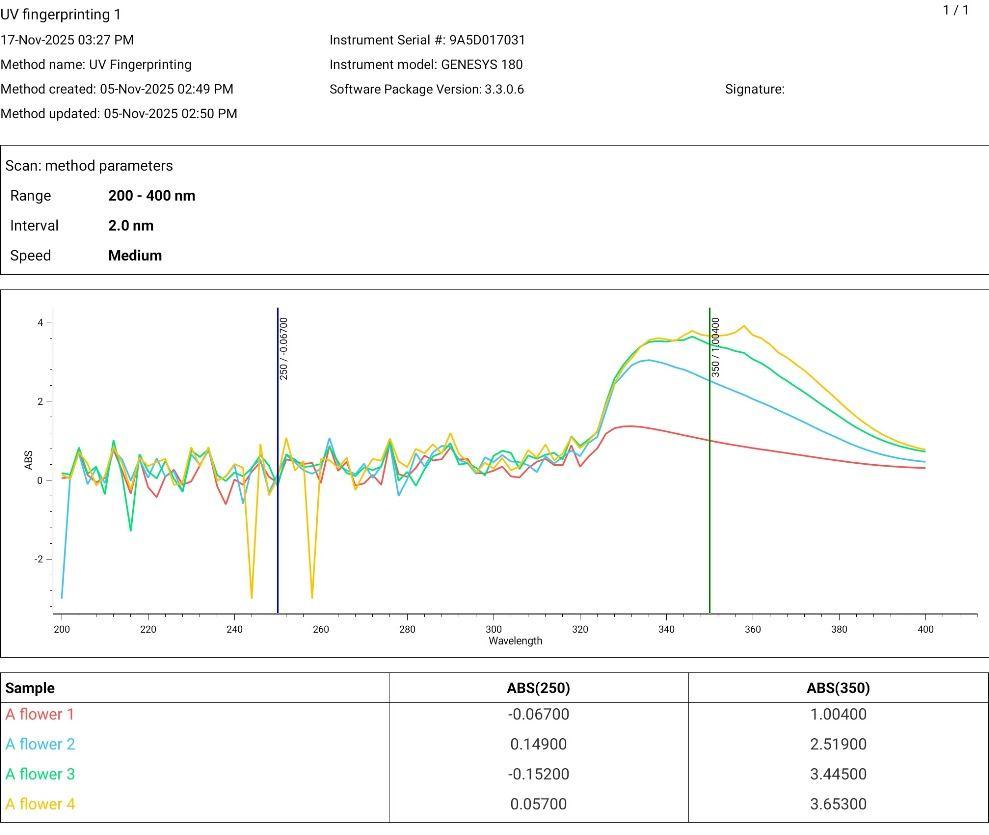
International Research Journal of Engineering and Technology (IRJET) e-ISSN: 2395-0056
Volume: 13 Issue: 01 | Jan 2026 www.irjet.net p-ISSN: 2395-0072
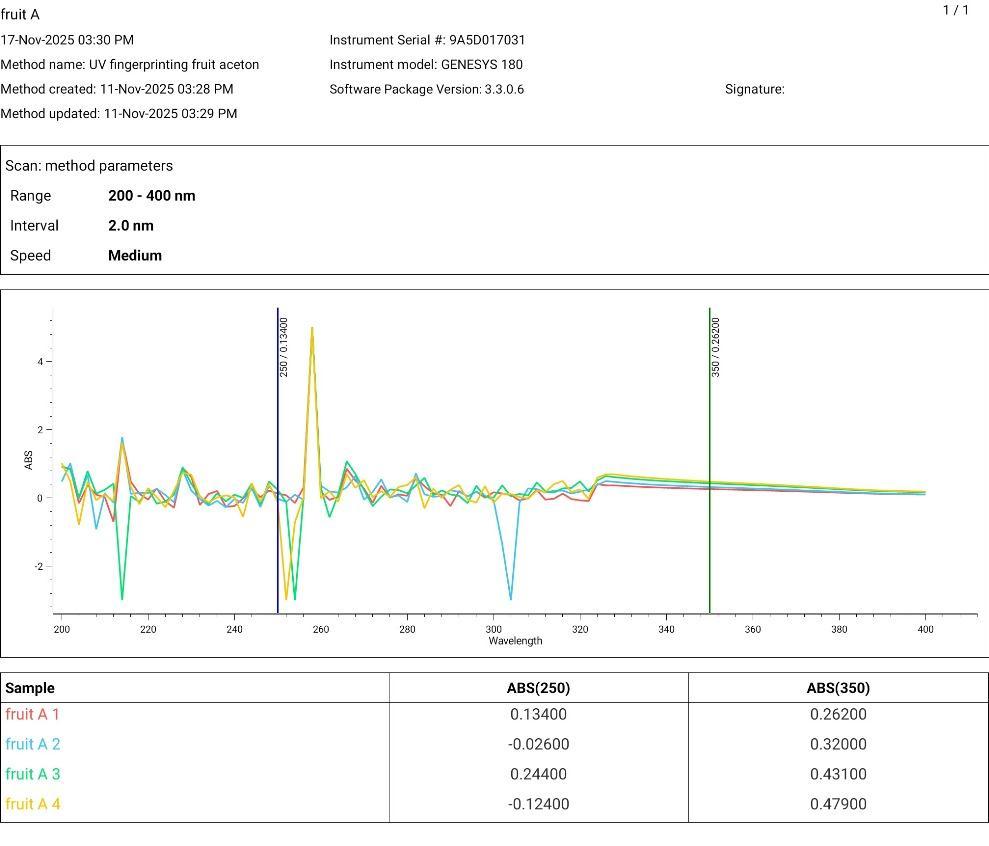
Fig. no: 06 Acetone Extract of Red Dragon Fruit Peel
Conclusion
The findings of this study indicate that extracts obtained from Celosia cristata flowers and red dragon fruit peels are effective as natural indicators in acid–base titrations. Both extracts displayed distinct and well-defined color transitions over a broad pH range, and UV–visible spectroscopic analysis confirmed the presence of stable pigment molecules responsibleforthesecolorchanges.
Thetitrationendpointsachievedusingthenaturalindicatorscloselymatchedthoseobtainedwithconventionalsynthetic indicators,demonstratingcomparableaccuracy,consistency,andreproducibility.Theseresultssuggestthatplant-derived indicators offer a reliable, economical, environmentally friendly, and non-toxic alternative to commonly used synthetic indicatorsinroutinetitrationprocedures.
In conclusion, Celosia cristata flower and red dragon fruit peel extracts show strong potential for application as natural acid–baseindicatorsinanalyticalchemistry.
References:
1. YustiadiF2016IdentifikasiPemahamanKonsepMateriAsamBasapadaSiswaKelasXIIPASMANegeri4Malang SkripsiUMMalangTidakdipublikasikan
2. Kousathana,DemeroutM,andTsaparlisG.2005.Sci.Educ.14:173–93.
3. UndergraduateJournalofMathematicalModeling,one+two10(1).
4. “AcidBaseTitration–TitrationCurves,EquivalencePoint&IndicatorsofAcidBaseTitration”
5. Standard11thNCERT,Chemistrypart2,unitnumber8,“RedoxReactionasthebasisfortitration,”pg.no.269.
6. Sing M, Sravan PK, Birendra S, Pamula BR. A comprehensive review of phytochemical and pharmacological overviewonCelosiacristataforfutureprospectiveresearch.AJPCR.2020;13:21-24.
7. ButterworthC.A.,2011.ITIS-Report:HylocereusMonacanthus(Lem.)Britton&RoseIntegr.Taxon.Inf.Syst.
© 2026, IRJET | Impact Factor value: 8.315 | ISO 9001:2008 Certified Journal | Page495