
International Research Journal of Engineering and Technology (IRJET) e-ISSN: 2395-0056
Volume: 13 Issue: 05 | May 2026 www.irjet.net p-ISSN: 2395-0072

International Research Journal of Engineering and Technology (IRJET) e-ISSN: 2395-0056
Volume: 13 Issue: 05 | May 2026 www.irjet.net p-ISSN: 2395-0072
N.Gowri Sankar 1 , Mr.S.Muni Kumar 2
1student, Mca 2nd Year Kmmips, Tirupati, Affiliated To S.V. University, Tirupati, A.P, India
2Associate Professor, Dept Of Mca, Kmmips, Tirupati, Affiliated To S.V. University, Tirupati, A.P, India
ABSTRACT - Research on the study of houses, condominiums and buildings in Taiwan’s metropolitan areas continues to be an important area of research. In real estate forecasting and analysis, methods such as statistical analysis and questionnaire data collection are widely used. However, when multidimensional data is considered, these methods are time-consuming and inadequate. This study aimed to build a real estate forecasting model that can adapt to a changing environment. Data were collected from public government databases, the collected data were standardized for accurate clustering, an appropriate data clustering algorithm was applied to the standardized data, and crossstatistical analysis was performed to verify the adopted algorithm. We used a deep learning based on autoencoder algorithm to increase the accuracy of the clustering analysis. Double-bottom map particle swarm optimization(DBM-PSO) clustering algorithm was then used to determine the optimal clustering solution. Cluster analysis and deep learning were conducted on data collected from public websites to understand the factors that led tothe sustained increase in housing prices in Taiwan over the past decade. The results of this study indicate that threekey factors the number of real estate transactions, the average unit price of real estate transactions, and the building material and construction index significantly affected real estate prices in Taiwan. Our results could help researchers and governments to focus on specific aspects of real estate development without being influenced by other related factors. In addition, the relationships between real estate trends and the aforementioned three key factors were determined to obtain valuable information that can enable the Taiwanese government to regulate the property market and prevent excessive growth. The framework proposed in this paper allows researchers and governments to focus on specific aspects of real estate development without being influenced by other related factors, and provides a new mechanism for approachingreal estate-relatedforecasting.
Key Words: Machine learning, real estate, particle swarm optimization algorithm, economy, autoencoder, deep learning.
The expression ‘‘own the land, own the wealth’’ is highly commoninTaiwaneseculture,andmostfamiliesinTaiwan
aim to buy a home. Land and permanent structures such houses, apartments, buildings, and fences are considered to be real estate . Real estate symbolizes security and stability and serves as a form of shelter. It has become a popular investment and a reliable hedge against inflation on a global scale. The state of the economy affects housing demand, with property values and rental rates rising with increases in inflation. Open databases enable researchers toaccessestablisheddataforanalysis.TheFederalReserve EconomicDatadatabase(https://fred.stlouisfed.org)ofthe United States con tains information on various housing indicators, including housing inventory, housing starts, home sales, the housing affordability index, the housing price index, housing trans actions, the mortgage-lending index, commercial property prices, interest rates, the producerpriceindex,andforeclosedproperties.Realestate data are complex and unpredictable, and most of the real estateliteraturefocusesonthetrendinhousingprices and housing price forecasting. Unit price, initial property registration, and number of rooms are essential aspects in real estate research. Unexpected uncertainties such as pandemicoutbreaks,marketvolatility,andeconomiccrises make real estate data unpredictable. In recent years, advanced machine learning algorithms have been developed to account for such uncertainties in the longterm forecasts . Voith et al. developed a model that decomposes the variation in office vacancy rates into market-specific, time specific, and random factors . An understanding of real estate trends is crucial for the prediction of future prices. Drawing on economics, sociology, psychology, and methodological and epistemological philosophy, Mooya et al. raised three fundamental questions about the measurement and magnitudeofrealestateprices.
Governmentsaimtoregulatehousingpricestopreventreal estate speculation and ensure that housing access is equip table. Governments can set appropriate interest rates on loans and implement other policy measures to stabilize housing prices. According to the website of the Taiwanese Ministry of the Interior tips: //pip.moi.gov.tw/ Eng/EP31.aspx), housing prices in Taiwan increased between 2000 and2022.Thetrend in Taiwan’s transaction index between Q1 in 2000 and Q2 in 2022 is displayed in
International Research Journal of Engineering and Technology (IRJET) e-ISSN: 2395-0056
Volume: 13 Issue: 05 | May 2026 www.irjet.net p-ISSN: 2395-0072
Figure 1. Government policies influence the behaviour of Taiwan’s real estate market. Therefore, the need for government intervention to maintain stability is evident from Taiwan’s real estate history. The development of propertypricesduringkeyeventsinTaiwanisillustratedin Figure 1. Real estate has become a crucial research area becauseofitsimportancetothepublic.
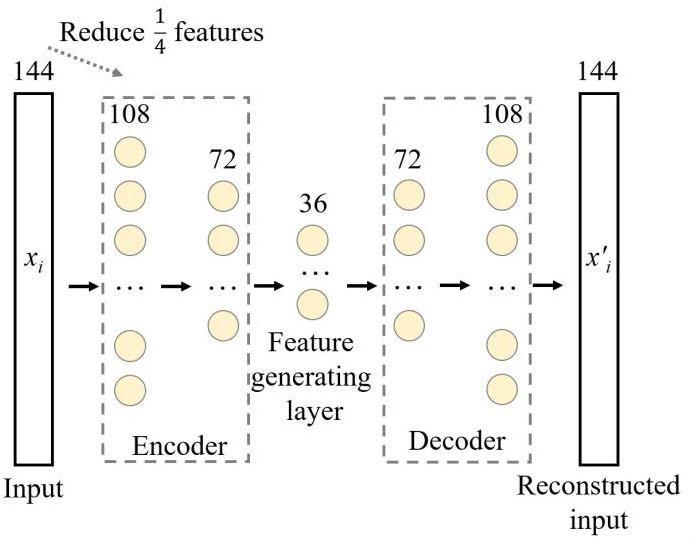
The proposed clustering model is outlined in this section. First, a four-layer autoencoder network minimizes the recon striction error and the distance between the data points and their respective clusters in the code layer. Second, the data representation in the data layer is improved through nonlinear mapping. This process consists of four main steps standardizing the data for various features and attributes, reducing the multidimensional data to a low-dimensional data through dimensionality reduction based on autoencoder approach, (performing clustering in the low-dimensional space, and analyzing the obtained clusters related to real estate markets.
3.1.
Data were obtained from various sources, included multiple types of information, and described various characteristics and attributes. Therefore, we used mean normalizationtostandardizetherangesoftheindependent variables (x). The original variable file can be found in the Supplementary Files (98index.xlsx). x′ = x −µ max(x) −min(x) where µ is the mean value of the independent variable.
An autoencoder is a type of neural network that aims to learn a hidden representation of its input to then reconstructtheinput.Considerasingle-layerautoencoder network that comprises an encoder and a decoder. The encoderusesa nonlinearmappingfunctionf(x)tomapan input xi to the input’s hidden representation hi. The activation function used in this study is the sigmoid function, which is defined as follows: hi = f (xi) = 1 1 +exp(−(W(1)xi + b(1))) (2) where W(1) is the encoding weightmatrixandb(1)isthebiasvectoroftheencoding.If the activation function is linear, the operation of the onelayer autoencoding network is equivalent to principal componentanalysis.usingthedecoderfunctiong,whichis expressed as follows: x′ i = g(hi) = 1 1 +exp(−(W(2)hi + b(2))) (3) where W(2) is the decoding weight matrix and b(2)isthebiasvectorofthedecoding.Thecondition W(2) = W(1)T can act as a regularize and reduce the number of parameterstooptimize.TheoptimalparametersofWand bhavetobedefinedduringthecodingprocess.Thegoalof
an autoencoder is to minimize the error of the reconstruction process. The cost function shown in equation(4)canbesolvedtoobtainthesetwoparameters by minimizing cost(θ), since it is directly related to the parameters W and b. cost (θ) = 1 N N i=1 xi −x′ i 2 (4) where θ = {W(1), W(2), b(1), b(2)}, x′ i is calculated as Equation (3). A deep autoencoder network can be formed by stacking several one-layer autoencoders. Here, the hiddenrepresentationofapreviousautoencoderisusedas input for the next autoencoder. However, because the gradientdescentalgorithm usedfortrainingissensitiveto initialweights,deepautoencoderscanbedifficulttotrain. Toovercomethisproblem,apre-trainingalgorithmisused, which learns more robust features than the gradient descent algorithm before fine-tuning the entire model. Restricted Boltzmann machines and denoising autoencoders are used to construct a model that can reconstructinputsfromtheirdistortedversions.Denoising autoencoders can be considered stochastic versions of autoencoders. The difference between a denoising autoencoder and a conventional autoencoder is that a denoising autoencoder performs a stochastic corruption process. This process randomly sets some inputs to 0. A denoiser autoencoder is trained to reconstruct the undistortedversionoftheinputfromthedistortedversion.
Kennedy and Eberhart introduced the particle swarm optimization (PSO) algorithm. PSO is an efficient learning algorithm based on evolutionary computation that mimics the movement Sof flock Sof birds to simulate social behavior.Eachcandidatesolutionistreatedasaparticlein a swarm, and each particle’s velocity can be adjusted in accordance with its experience and the information that it exchanges with other particles in the swarm. The PSO algorithm effectively finds optimal solutions in complex search spaces through interactions between individuals in apopulationofparticles.problemandisrepresentedasthe set of all feasible solutions. The swarm consists of M particles, which are expressed as S = (X1, X2, ..., XM). Second, each particle is initialized with a random solution and is represented as a point in a D dimensional space, where Xi = (xi1, xi2, ..., xiD) and x ∈ (Xmin, Xmax)D. A particle’s velocity is represented as vi = {1, 2, ..., vi,D}, wherev ∈ (Vin,Vmax)D.Third,eachparticlefindsitsbest position by comparing its current position’s f witness with that of its previous best position, which is rep resented as pesto={pbesti,1,pbesti,2,...,bested}.
Volume: 13 Issue: 05 | May 2026 www.irjet.net p-ISSN: 2395-0072
The terms waxy and win, which represent the upper and lower limits of w, respectively, are set to 0.9 and 0.4, respectively . The terms it elation and iterations max represent the current number of iterations and the total number of iterations, respectively. The velocity vector indicates how the particle moves to reach the global best positionatagiveninstant.However,aparticle’exploration ofthesolutionspacecan be limited byvelocityvalues that are excessively low or high. The particle’s velocity and positionarethuslimitedto within[Vin,Vmax]Dand[Xina, Xmas]D, respectively. These ranges define the maximum stepsizethattheparticlecanuse inthesearch DBMPSO is a Varian to Fops that uses a double bottom map (DBM) in its updating function. ADBM is a chaotic function that prevents the population becoming trapped in a local optimum, and it balances exploitation and exploration in PSO search by generating random values in three regions: regionswithvaluesof0.0,0.5,and1.0.InthePSOupdating function, r1 is related to updating the particle in accordance with best, and r2 is related to updating the particle in accord dance with best. In DBMPSO, the DBM function generates two sequences, namely DBMr1 and DBMr2, which replace r1 and r2, respectively, to balance global exploration and local search. The sequences DBMr1 andDBMr2areexpressedasfollows:DBMrt+1i,d=where DBMrt+1 sin 4π DB Mart i,d +1 2 (8) and is the Damra sequence in the ditch element of the ith particle in the current iteration t. The update function of DBM-PSO is expressedasfollows:vt+1id= wavei,d+c1×Debert1,i,d ×bested−xti,d+c2×Debert2,i,d×best−xti,Afterthefinetuning of the stacked autoencoder, it has learned the parametersθ.Subsequently,low-dimensionalcodescanbe extractedfromthecodelayer,andtheDBM-PSOalgorithm is used to cluster these codes. Algorithm 1 presents the pseudocode of the DBM-PSO clues tiring algorithm. The particle encoding, fitness evaluation, and best and best updatesaredefinedforaspecificcluestiringproblem.
We build a framework based clustering and deep learning to identify features of real estate. An autoencoder algorithm was employed to increase the clustering accuracy, and DBM-PSO clustering algorithm used to determinetheoptimalclusteringsolution.
2. The results of this study could serve as a reference for governments and real estate investors in developing policies, regulations, and market strategies as well as forecasting trends accurately to maintain the relationships betweenrealestatecharacteristics.
Theclusteringresultswerestatisticallyanalyzed.IBMSPSS Statistics was used to perform descriptive statistical analysis,normalitytests,analysisofvariance(ANOVA),and linearregression.Thedescriptivestatisticswerethemean, max mum, minimum, variance, standard deviation, coefficient of skewness, and coefficient of kurtosis . The skew ness and kurtosis coefficients were employed to determinethestateofdeviationfromnormaldistributions. ANOVA is appropriate when the response variables have continuous distributions and the conditions are discrete, either by nature or by design . The ANOVA results were evaluated on the basis of R2, adjusted R2, sum of squares, mean square, F value, and significance level (α) . R2 represents the proportion of variance in the dependent variablethattheindependentvariablecanexplain;ahigher R2 value thus indicates higher explanatory power. The adjustedR2valueisamodifiedversionofR2thatconsiders additional indecent dent variables that tend to bias R2 results.Themeansquareistheestimatedvarianceusedto determine the accuracy of the regression model, and the sum of squares is the sum of the squares of the distances betweeneachdatapointandthelineofbestfit.TheFvalue isusedtocomparetheamountofvarianceexplainedbythe modelwiththeamountoferrororunexplainedvarianceto determine the test’s significance. (13) The results of the linear regression included the standard Izod regression coefficient β, T value, tolerance, variance inflation factor (VIF), Pearson correlation coefficient, and P value . The Average value of characters in clustering results related to number of real estate transactions. standardized regression efficient is used to compare the explanatory power of the independent variables and calculate the slope of the regression equation. Moreover, the T value indicates whether a significant difference exists between the variables, with a higher T value indicating stronger evidence.TheVIFisusedtoassesstheindependenceofthe independentvariablesinmultiplelinearregressions,anda small VIF value indicates a high degree of independence. The Pearson correlation coefficient is employed to test the linear relationship between two variables. Regression analysis was conducted to determine which relationships in the developed model had statistically significant coefficients and Pavlus Descriptive statistical analysis,
International Research Journal of Engineering and Technology (IRJET) e-ISSN: 2395-0056
Volume: 13 Issue: 05 | May 2026 www.irjet.net p-ISSN: 2395-0072
normality tests, ANOVA, and line a regression were performed using IBMSPSS Statis tics. After data clustering, the descriptive statistics were analyzed (Table S3). The high average R2 value of the afore mentioned 13 independent variables (0.8822) in the ANOVA indicated thatthesevariableshadhighpowertoexplainthebuilding material and construction index (Table 3). The regression analysis results for the aforementioned 13 variables are shown in Figure indices were extracted using techniques such as data standardization, high-dimensional model reductionbyusingautoencoders,anddataclustering.
We attempted to identify the factors that influence home prices by analyzing indices that are strongly correlated with the average unit price of real estate transactions. The unit price of a home is a critical consideration for prospectivebuyers,andunderstandingthe
Inthisstudy,clusteranalysisanddeep-learningtechniques were used to identify the key factors influencing Taiwan’s sustained housing price increases over the past decade. Data collection, data standardization, autoencoder- based dimensionality reduction, and data clustering were performed in this study, and three data clusters were obtained.Thefirstclustercontainedindependentvariables that influence the number of real estate transactions; the second cluster contained independent variables that influencetheaverageunitpriceofreal estatetransactions; and the third cluster comprised independent variable indices that affect the building materials and construction index when controlling for relevant variables. The framework proposed in this paper provides a new mechanismforapproachingreal-estate-relatedforecasting, therebyenablingresearchersandgovernmentstofocuson specific aspects of real estate development without being influencedbyotherrelatedfactors.Futureresearchshould focus on expanding data collection efforts, exploring different clustering algorithms for subgroup analyses, and optimizing parametersettings.Ourfindingmight beuseful for governmental regulation of the relationship between the rental market and the real estate market; thus, consideringpeople’shousingequitywhenformulatingrealestate-related laws and regulations is essential. Although this study only focused on Taiwan, the proposed framework can be applied globally to analyse housing marketsindifferentregions.
[1] J. Ratcliffe,M. Stubbs, and M. Keeping, Urban Planning andReal Estate Development. New York, NY, USA: Routledge,2021.
[2]Y.Kang,F.Zhang,W.Peng,S.Gao,J.Rao,F.Duarte,and C. Ratti, ‘‘Understanding house price appreciation using multi-sourcebiggeodataandmachinelearning,’’LandUse Policy,vol.111,Dec.2021,Art.no.104919.
[3] P.-F. Pai and W.-C. Wang, ‘‘Using machine learning models and actual transaction data for predicting real estateprices,’’Appl.Sci.,vol.10,no.17,p.5832,Aug.2020.
[4]O.Tatsey andC. Tariqul, ‘‘Amachinelearning-based 10 years ahead prediction of departing foreign visitors by reasons: A case on Türkiye,’’ Appl. Sci., vol. 12, no. 21, p. 11163,Nov.202.
[5] R. Voith and T. Crone, ‘‘National vacancy rates and the persistence of shocks in U.S. office markets,’’ Real Estate Econ.,vol.16,no.4,pp.437–458,Dec.1988.
[6] X. Wang, J. Wen, Y. Zhang, and Y. Wang, ‘‘Real estate price forecasting based on SVM optimized by PSO,’’ Optik, vol.125,no.3,pp.1439–1443,Feb.2014.
[7]Mummery, Real Estate Valuation Theory: A Critical Appraisal,1sted.,Berlin,Germany:Springer,2016.
[8] H. Usman, M. Lizam, and M. U. Adekunle, ‘‘Property price modelling, market segmentation and sub market classifications: Are view, ’Real Estate Manage. Valuation, vol.28,no.3,pp.24–35,Sep.2020.
[9]J.Sun,X.Yang,andX.Zhao,‘‘Understandingcommercial realestateindices,’’J.RealEstatePortfolioManage.,vol.18, no.3,pp.289–303,Jan.2012.