2 minute read
Property Profile Taxes Deed


This week the median list price for Terrebonne, OR 97760 is $649,900 with the market action index hovering around 27. This is less than last month's market action index of 30 Inventory has decreased to 19
Market Action Index
This answers “How’s the Market?” by comparing rate of sales versus inventory
Terrebonne, OR 97760
Real-Time Market Profile
Slight Buyer's Advantage
The market has been consistently cool for several weeks. Demand level are low relative to the available inventory. It's a Buyer's market and prices continue to fall Look for a persistent shift in Market Action before prices plateau or begin to rise again.
Market Segments
Each segment below represents approximately 25% of the market ordered by price
Median List Price
Again this week in this zip code we see a downward notch for prices. Pricing has been weak in recent weeks and versus their absolute-high level. At this point, we will be looking for a persistent upward shift in the Market Action Index as a leading indicator for a trough in prices.
Segments
In the quartile market segments, we see prices across the quartiles of this zip code not tightly correlated recently. Prices in Quartile 1 and 4 have been mixed recently, while the rest of the market is trending downward. Look to a strong, persistent up shift in the Market Action Index as a leading indicator of the trough in the market.
Price Per Square Foot
Despite recently falling prices, the price per square foot has stayed reasonably flat. This implies that there’s a portion of the market being priced at a premium. You can investigate this condition in the quartile details.
Inventory has been falling in recent weeks. Note that declining inventory alone does not signal a strengthening market. Look to the Market Action Index and Days on Market trends to gauge whether buyer interest is changing with the available supply.
Market Action Index
The market has been consistently cool for several weeks. Demand level are low relative to the available inventory. It's a Buyer's market and prices continue to fall. Look for a persistent shift in Market Action before prices plateau or begin to rise again.
Market Action Segments
The lowest-end of this zip code (Quartile 4) is the only segment in the Buyer's Market zone with several months of inventory given the current levels of demand. The rest of the market is showing demand strength in the Seller's Market zone.
Median Days on Market (DOM)
The properties have been on the market for an average of 161 days. Half of the listings have come newly on the market in the past 138 or so days. Watch the 90-day DOM trend for signals of a changing market.
Segments
It is not uncommon for the higher priced homes in an area to take longer to sell than those in the lower quartiles.
AreaProfiled:AngusAcresPhase2

ReportDate: 01/30/2023
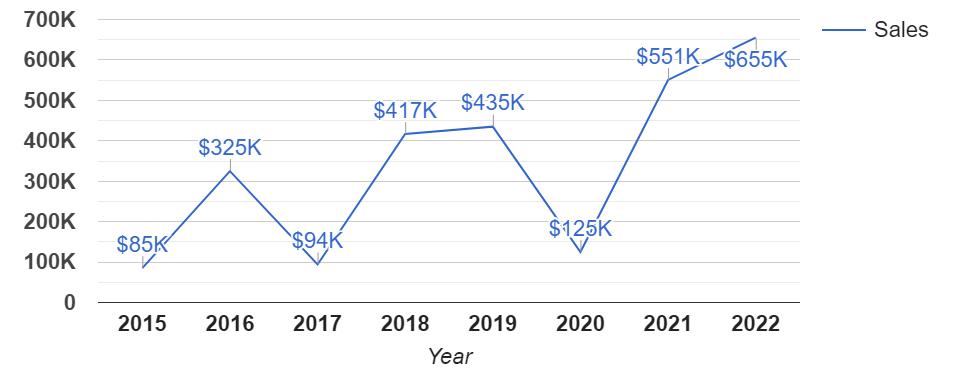
SalesDates: 08/07/2007-06/22/2022
AverageSalePricebyYear:01/01/2015-01/30/2023
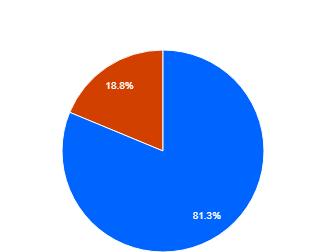
LengthofResidence
*12sale(s)areincludedinthegraph **3sale(s)withnosalepriceareexcludedfromthegraph
SalesStatisticsbyYear:01/01/2015-01/30/2023
AgeofHomes
*12sale(s)areincludedinthetable
AssessedValues