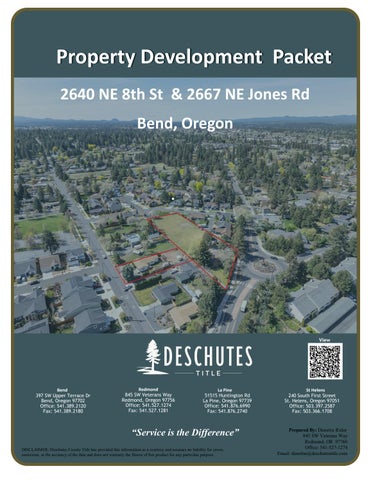
Property Development Packet 2640 NE 8th St & 2667 NE Jones Rd Bend, Oregon
View
Bend 397 SW Upper Terrace Dr Bend, Oregon 97702 Office: 541.389.2120 Fax: 541.389.2180
Redmond 845 SW Veterans Way Redmond, Oregon 97756 Office: 541.527.1274 Fax: 541.527.1281
La Pine 51515 Huntington Rd La Pine, Oregon 97739 Office: 541.876.6990 Fax: 541.876.2740
“Service is the Difference” DISCLAIMER: Deschutes County Title has provided this information as a courtesy and assumes no liability for errors, omissions, or the accuracy of the data and does not warranty the fitness of this product for any particular purpose.
St Helens 240 South First Street St. Helens, Oregon 97051 Office: 503.397.2587 Fax: 503.366.1708
Prepared By: Danetta Rider 845 SW Veterans Way Redmond, OR 97760 Office: 541-527-1274 Email: danettar@deschutestitle.com
For more information please contact:
HEATHER OSGOOD Real Estate Broker, GRI, ABR WINDERMERE REALTY TRUST Bend, Oregon heatherosgood@windermere.com 206-419-3459 CELL 541-388-0404 OFFICE heatherosgoodre.com
Residential MLS#220201390 2640 NE 8th Street Bend, OR 97701 County: Deschutes
Main House SqFt: 1,359 Total Living SqFt: 1,359
Lot Size Acres 1.13
$1,250,000
Bedrooms 3
Bathrooms Total: 2 (Full: 2 Half: 0)
Active DOM: 108 CDOM: 108 Parcel Number:
118719
Property Sub Type:
Single Family Residence
Subdivision Name:
N/A
Lot Size SqFt
49,223
Year Built:
1965
Zoning:
RS
Additional Parcels:
No
Tax Lot:
00400
Tax Block: Tax Map Number:
171228AC
Tax Year:
2024
Tax Annual Amount:
$3,357.91
Public Remarks: Development opportunity in an established neighborhood, near Hollinshead Park, medical, commute access and Bend amenities. 1.13 acres offers many options and a preliminary plan is available. Adjacent properties are available including 2667 NE Jones Rd (MLS 220201590) Please contact listing agent for a complete packet of information and more details. Private Remarks: Shown by appointment only. Please do not disturb residents. Additional properties ARE available. Owner is using OR Forms. Directions: NE 8th to NE Bennington Lane offers easiest view of the parcel. The residential driveway is on the SE quadrant of the round-about at NE 8th and NE Butler Market. Showing Information and Requirements Owner Name: Carder, Farber, Audio Surveillance on Prop: No Sign On Property YN: No Scherzinger-Carder Trust Video Surveillance on Prop: No Occupant Type: Owner Showing Requirements: 24 Hour Notice; Appointment Only; Call Listing Agent Showing Instructions: Please call Listing Agent. Do Not Disturb Residents.
Phone to Show: Listing Agent Phone to Show Number: 206-4193459
General Property Information
Interior Information
Exterior Information
Rented: No CC&R's: No FIRPTA: No Association: No Short Term Rental Permit Issued: No Elementary School: Juniper Elem Middle Or Junior School: Pilot Butte Middle High School: Bend Sr High Flood: N/A Senior Community: No Total Living Area SqFt: 1,359 Main House SqFt: 1,359 Source: Assessor
Cooling: None Flooring: Carpet Heating: Electric Rooms: Eating Area; Enclosed Porch/Patio; Kitchen; Laundry; Living Room; Primary Bedroom
Structure Type: House Architectural Style: Bungalow Pool Features: None Lot Size Acres: 1.13 Garage: Yes- 2 Spaces Parking Features: Attached; Driveway Exclusions: Personal Property Horse Property: No
Construction
Listing/Contract Information
Listing Office Information
New Construction: No ADU: No Levels: One Common Walls: No Common Walls Foundation Details: Stemwall Power Production: None Utilities: Electricity Connected Roof: Composition Sewer: Public Sewer Water Source: Public
Original List Price: $1,250,000 List Price per SqFt: $919.79 Listing Contract Date: 05/09/2025 Expiration Date: 10/24/2025 Agency Represent: Yes Comp Sale YN: No Listing Agreement: Exclusive Right To Sell Listing Terms: Cash; Conventional Preferred Escrow Company & Officer: Deschutes Title, Brittani Ford Special Listing Conditions: Standard
Listing Member: Heather Osgood License #200109045 Phone: 206-419-3459 Mobile: 206-419-3459 Email: heatherosgood@windermere.com Listing Office: Windermere Realty Trust License #991000091 Phone: 541-388-0404
Information is deemed to be reliable, but is not guaranteed. © 2025 MLS and FBS. Prepared by Oregon Datashare, LLC on Monday, August 25, 2025 10:04 AM The information on this sheet has been made available by the MLS and may not be the listing of the provider.
ET E R
NE
8T
H
URIETA, LUCIANO DOMINGUEZ ET AL 2669 NE JONES RD TL 171228AC00303
ST
LOT 7 21,483 SF
MID-1
MID-3
MID-2
DONOHOE,ROBERT H 2667 NE JONES RD TL 171228AC00304
MID-4
DAVIDSON, JAMES KENNEDY ET AL 2600 NE 8TH ST TL 171228AC00705
S
S
S
POTENTIAL FUTURE ALLEY TO NE JONES ROAD
ALLEY TRACT 2,824 SF
BL PR IC IV AC AT C EA ES L S LEY EA SE M
EN
T
LOT 6 3,545 SF
20 'P
U
LOT 5 2,238 SF
GIESKING FAMILY TRUST 1020 NE BENNINGTON WAY TL 171228AC00704
NE SERENAC WAY
LOT 4 2,236 SF
LOT 3 2,233 SF
LOT 2 2,230 SF
HARRINGTON-AYDIN TRUST 2595 NE JONES RD TL 171228AC00300
LOT 1 2,639 SF
NE
BE NN
IN
G
TO
N
W
AY
2640 NE' 8TH ST. CONCEPTUAL LAYOUT #1
549 SW MILL VIEW WAY #100 BEND, OREGON 97702 (541) 633-3140 www.beconeng.com DATE: 12-17-2024
SCALE: 1" = 30'
FOR: CLAIRE CARDER
DRAWN BY: EJH
LEGEND: PROJECT BOUNDARY SETBACK LINE PROPOSED BUILDING
LANDSCAPED AREA
DESIGNED BY: EJH
PROPOSED CONCRETE
5/6/25, 3:13 PM
Planning Application Status | City of Bend - CityView Portal
Planning Application Status PLPRE20250035
You will only be able to view fees or view conditions if you are a contact on the planning application.
Summary Project Number: PLPRE20250035 Project Name: 2640 NE 8th Project Type: Pre-Application Application Types: Pre-Application Application Status: File Closed Date Entered: 01/21/2025 Property Owner's CARDER, CAMI SUE ET AL Full Name: Public Notice Concept: 7-lot subdivision followed by 4-lot Summary: Middle Housing Land Division Planner: Elizabeth LaFleur Planner Email: elafleur@bendoregon.gov
Locations Locations: Property 171228AC00400 Address 2640 NE 8TH ST, BEND, OR 97701
Contacts Property Owner: CARDER, CAMI SUE ET AL, Address:2640 NE 8TH ST, BEND OR, 97701 Applicant: https://cityview.ci.bend.or.us/Portal/Planning/Status?planningId=28734
1/2
5/6/25, 3:13 PM
Planning Application Status | City of Bend - CityView Portal
Erik Huffman, Address:549 SW Mill View Way, Suite 100, Bend OR, 97702, Phone: (541) 633-3140 Email:ehuffman@beconeng.com
Application Types Pre-Application Approval Track: Administrative Application Status: Complete Application
Hearings Title
Location
Date Time
Documents & Images Date File Type Uploaded
Name
01/21/2025
Plans
Concept Plan-1
01/21/2025
Submittal Document
2640 NE 8TH ST, BEND, OR 97701 Narrative
01/30/2025
Agency Comment
Pre-Application Meeting Summary
02/04/2025
Agency Comment
PLPRE20250035 - 2640 NE 8th Street 7-lot subdivision ENG Notes
02/05/2025 Letter
Review Comment Summary
https://cityview.ci.bend.or.us/Portal/Planning/Status?planningId=28734
2/2
2640 NE 8TH ST, BEND, OR 97701 Phase 1 includes subdividing the property to create 6 additional townhome lots. Phase 2 includes a middle housing land division to create 4 more residential units.
PROJECT #: PLPRE20250035 – 7-LOT SUBDIVISION ADDRESS: 2640 NE 8TH STREET, 171228AC00400 SUBJECT: PRE- APPLICATION MEETING FROM: ALEX PELAYO DATE: JANUARY 30, 2025
General Comments This project is proposing a 7-lot subdivision. Transportation/Traffic 1. Transportation Facilities Report (TFR) will be required. If the development will produce over 700 ADT and impact neighboring intersection with over 50 PM peak trips, a Traffic Impact Analysis (TIA) will be required. Refer to Chapter 4.7 of the Bend Development Code. 2. Serenac Way will need to extend and be constructed to local street standards ending in a cul-desac. A “knuckle” or eybrow cul-de-sac would be allowed to attain a future connection to NE Jones Road instead of the standard cul-de-sac. Grading, Erosion Control and Stormwater/Drainage 1. All stormwater shall be retained on site. 2. A drainage plan will need to be provided prior to completeness check. 3. All drainage facilities shall be designed, tested and certified for compliance with approved plans by a licensed engineer. Water 1. A Water Analysis (SWA) memo, provided by the Private Development Engineering Department, is required prior to land use application submittal. 2. The existing water service will need to be determined whether it is located along the 8th street frontage or from NE Jones Road. From City GIS, it appears that the service comes from NE Jones Road, through the adjacent property to serve this lot. If that is the case, the service will most likely need to be removed. 3. Water main extension will be required. 4. One water service is permitted per lot. Sewer 1. A Sewer Analysis (SWA) memo, provided by the Private Development Engineering Department, is required prior to land use application submittal. 2. A sewer lateral is shown in the utility map, but of unknown size. The service will most likely be allowed to remain, unless out of conformance with City of Bend standards and specifications. 3. Sewer main extension will be required. 4. One sewer service is permitted per lot.
The information provided during this pre-application meeting is based on the limited information provided by the applicant. The City attempts to provide the best information based on current code and construction standards, however these requirements may change as additional information is provided and determined with the results of the water/sewer analysis and transportation review.
Page 1
CITY OF BEND PLANNING DIVISION PRE-APPLICATION MEETING SUMMARY PROJECT NUMBER:
PLPRE20250035
MEETING DATE:
January 30, 2025
OWNER:
CARDER, CAMI SUE ET AL 2640 NE 8TH ST BEND, OR 97701
APPLICANT:
Erik Huffman 549 SW Mill View Way, Suite 100 Bend, OR 97702
LOCATION:
2640 NE 8TH ST, BEND, OR 97701; 171228AC00400.
ZONE:
Residential Urban Standard Density
COMP PLAN:
RS
PROPOSAL:
Concept: 7-lot subdivision followed by 4-lot Middle Housing Land Division
STAFF REVIEWERS: Elizabeth LaFleur, Senior Planner, (541) 330-4019, elafleur@bendoregon.gov
ATTENDING VIA MS TEAMS: Alex Pelayo-PDE, Nate Stahley-Development Services, Jason Bolen-Fire, Kerry Bell-Housing, Berry-PDE; Fielder Fitzsimmons-Building Safety Division, Ian Berg, Cami Carder, Erik Huffman-Becon, Clair Suzanne Carder, Jim.
DISCLAIMER: The information provided at the Pre-Application Meeting is intended to aid in the design of the development and is not considered a final decision. Issues discussed at the meeting may not be a comprehensive list of all standards that will be applied during the application review and construction process because it is recognized that the plan may change based on the discussion at the Pre-Application Meeting. *Staff feedback is based on the codes, standards, and specifications in place during the PreApplication Meeting. The application will ultimately be reviewed for compliance with codes, standards, and specifications in effect at the time of formal application submittal.* The comments presented at the meeting are intended to address the project's potential planning, fire, building, and engineering.
Accommodation Information for People with Disabilities To obtain this information in an alternate format such as Braille, large print, electronic formats, etc. please contact the Staff Reviewer listed above; Relay Users Dial 7-1-1.
Planning
Concept Plan:
• • •
• • • • •
Phase 1 is 7-lot subdivision. Phase 2 is Middle Housing Land Division. Concept plan shows lot 7 as the MHLD but as proposed, would have 5 units on parent lot. Resolution: Phase 1 be an 8-lot subdivision, with concept unit layout on lot 8, though lot 8 would need to have frontage on a street, which could be obtained by having a dedicated “knuckle” of NE Saranac Pl, and meet RS lot area and dimensions within BDC 2.1.500. Or, leave as 7 lot subdivision and do 3 units on lot 7 (so total of 4 on lot 7). Process: Type II Tentative Plat Subdivision Land Division, construct required infrastructure under a Right-of-Way permit, then Type I Final Plat application and record the plat. Then, Type II Tentative Plat Middle Housing Land Division (MHLD). MHLD do not need concurrent building permits on the parent property (BDC 4.3.700). Frontage improvements on NE Saranac Pl extension will be required, including street trees and landscape strip. Dedication along NE 8 th Street. City of Bend Legal Division would need to weigh in as to how to deal with encroaching existing home. Fire Dept access/turnaround will need to be addressed. Fire Dept does not use private alleys to access fire emergencies. Please work with Bend Fire and Private Development Engineering (PDE) for agreeable solution.
BEND DEVELOPMENT CODE APPLICABLE STANDARDS & CRITERIA BDC Criteria Chapter 4.3, Land Divisions and Property Line Adjustments BDC Standards Chapter 2.1, Residential Districts (RS) Chapter 3.1, Lot, Parcel and Block Design, Access and Circulation Chapter 3.2, Landscaping, Street Trees, Fences and Walls Chapter 3.4, Public Improvement Standards Chapter 3.5, Other Design Standards (Townhomes) Chapter 4.7, Transportation Analysis BDC Procedures Chapter 4.1, Development Review and Procedures
Planning Division City of Bend P.O. Box 431 Bend, OR 97709
Mailed on February 05, 2025
REVIEW COMMENT SUMMARY
Erik Huffman 549 SW Mill View Way, Suite 100 Bend, OR 97702 PROJECT NUMBER:
PLPRE20250035
APPLICANT:
ERIK HUFFMAN
LOCATION:
2640 NE 8TH ST, BEND, OR 97701, 171228AC00400
REQUEST:
Concept: 7-lot subdivision followed by 4-lot Middle Housing Land Division
STAFF REVIEWER:
Elizabeth LaFleur, Senior Planner, (541) 330-4019, elafleur@bendoregon.gov Alex Pelayo, Project Engineer, (541) 323-8556, apelayo@bendoregon.gov
The following are comments received from various review groups for the above referenced project. Please contact the staff reviewer if you have questions about these comments. Community Development Division Comments: Planning Review (Reviewed By: Elizabeth LaFleur) • Please see Pre-app meeting summary memo in Documents & Images. [Elizabeth LaFleur @ 01/24/2025 9:22 AM] Dev Services Review (Reviewed By: Nathan Stahley) • Hello,
Accommodation Information for People with Disabilities To obtain this information in an alternate format such as Braille, large print, electronic formats, etc. please contact Elizabeth LaFleur at (541) 330-4019 or elafleur@bendoregon.gov; Relay Users Dial 71-1. FAX: (541) 388-6676.
System Development Charges (SDCs) are assessed at the time of new development or redevelopment of a property to account for the increased demands placed on the sewer, water, and transportation systems. The City also collects Parks SDCs on behalf of the Bend Park and Recreation District. SDCs could be assessed for the following: • New residential or non-residential development occurs • There is a change of use in an existing development • Additional dwelling unit is created • Increase of floor space or living area • New connection(s) to the public water or wastewater systems For current SDC rates, please see the SDC Fee Schedule: https://www.bendoregon.gov/home/showpublisheddocument/59439 If you would like SDCs and any potential credits for previous use estimated for you, please visit the Online Permit Center Portal at https://cityview.ci.bend.or.us/Portal/ and click Apply under the section titled Building, Permanent Signs & SDC Estimates. Please include a completed SDC Supplemental Application (https://www.bendoregon.gov/home/showpublisheddocument/43971/63860602376 5770000) with your application and as much information as possible about the proposed use. Currently, there is no charge for an SDC estimate (*subject to change) and the process takes up to 15-30 business days to complete. Multi-family developments have the option to defer payment of SDCs until Certificate of Occupancy. To apply, submit an SDC Deferral Application with your building permit(s). For more information about SDC deferrals and the associated fees, please visit www.bendoregon.gov/sdc. Licensed Childcare Facility. Applies to daycare facilities serving infants through pre-k only. Businesses such as gyms, retail establishments, etc. with drop-in childcare intended for patrons do not qualify. Residential SDC calculations: https://www.bendoregon.gov/government/departments/community-and-economicdevelopment/development-services/system-development-charges/sdccalculations-and-estimates#Residential If you have questions about SDCs, please visit www.bendoregon.gov/sdc or contact us at development@bendoregon.gov. Thank you, The Development Services Division Private Development Engineering Review (Reviewed By: Alex Pelayo) See Engineering Notes in Documents & Images
If I can provide any further information to you, please feel free to contact me at (541) 3304019 or by email at elafleur@bendoregon.gov.
Sincerely,
Elizabeth LaFleur Senior Planner
Left blank intentionally
Residential MLS#220201590 2667 NE Jones Road Bend, OR 97701 County: Deschutes Section: NE Cross Street: NE Butler Market Rd
Main House SqFt: 960 Total Living SqFt: 960
Lot Size Acres 0.25
$600,000
Bedrooms 2
Bathrooms Total: 1 (Full: 1 Half: 0)
Active DOM: 105 CDOM: 105 Parcel Number:
162648
Property Sub Type:
Single Family Residence
Subdivision N/A Name: Lot Size SqFt
10,890
Year Built:
1981
Zoning:
RS
Additional Parcels:
No
Tax Lot:
00304
Tax Block: Tax Map Number:
171228AC
Tax Year:
2024
Tax Annual Amount:
$2,262.12
Public Remarks: Attn Developers - this .25ac property is located adjacent to 2640 NE 8th (MLS 220201390) making this a superb development opportunity. Established NE neighborhood, near Hollinshead Park, medical, commute access and Bend amenities. Please contact listing agent for a complete packet of information and more details. Private Remarks: Shown by appointment only. Please do not disturb residents. Additional properties ARE available. Owner is using OR Forms. Directions: NE Butler Market Rd to NE Jones Rd. Property is on the Right. Showing Information and Requirements Owner Name: Donohoe Occupant Type: Owner
Audio Surveillance on Prop: No Video Surveillance on Prop: No
Sign On Property YN: No
Phone to Show: Listing Agent Phone to Show Number: 206-4193459
Showing Requirements: 24 Hour Notice; Appointment Only; Call Listing Agent; See Showing Instructions Showing Instructions: Please contact Listing Agent. Do Not Disturb Residents. General Property Information
Interior Information
Exterior Information
Rented: No CC&R's: No FIRPTA: No Association: No Short Term Rental Permit Issued: No Elementary School: Juniper Elem Middle Or Junior School: Pilot Butte Middle High School: Bend Sr High Potential Tax Liability: No Assessment: No Senior Community: No Total Living Area SqFt: 960 Main House SqFt: 960 Source: Assessor
Appliances: Dishwasher; Oven; Refrigerator Cooling: Wall/Window Unit(s) Fireplace Features: Family Room; Wood Burning Flooring: Carpet; Vinyl Heating: Baseboard; Electric; Natural Gas; Wood Interior Features: Ceiling Fan(s); Laminate Counters; Shower/Tub Combo Rooms: Eating Area; Family Room; Kitchen; Primary Bedroom Security Features: Carbon Monoxide Detector(s); Smoke Detector(s)
Structure Type: House Architectural Style: Bungalow Patio and Porch Features: Deck Lot Features: Level Lot Size Acres: 0.25 Garage: Yes- 1 Spaces Parking Features: Attached; Driveway Road Surface Type: Paved View: Territorial Exclusions: personal property
Construction
Listing/Contract Information
Listing Office Information
New Construction: No ADU: No Levels: One Common Walls: No Common Walls; No One Above; No One Below Construction Materials: Frame Foundation Details: Stemwall Power Production: None Utilities: Cable Available; Electricity Connected Roof: Composition Sewer: Public Sewer Water Source: Public; Water Meter Green Building Verification Type: Green Verification Metric: 8 Green Verification URL: https://rpt.greenbuildingregistry.com/hes/OR10238338.pdf Green Verification Year: 2025
Original List Price: $600,000 List Price per SqFt: $625 Listing Contract Date: 05/12/2025 Expiration Date: 12/30/2025 Agency Represent: Yes Comp Sale YN: No Listing Agreement: Exclusive Right To Sell Listing Terms: Cash; Conventional Preferred Escrow Company & Officer: Deschutes/ Brittani Ford Special Listing Conditions: Standard
Listing Member: Heather Osgood License #200109045 Phone: 206-419-3459 Mobile: 206-419-3459 Email: heatherosgood@windermere.com Listing Office: Windermere Realty Trust License #991000091 Phone: 541-388-0404
Information is deemed to be reliable, but is not guaranteed. © 2025 MLS and FBS. Prepared by Oregon Datashare, LLC on Monday, August 25, 2025 10:08 AM The information on this sheet has been made available by the MLS and may not be the listing of the provider. Broker Attribution: natalkapalmer@gmail.com
Additional properties available contact listing agent for more details 206-419-3459
Left blank intentionally
Property Overview
DESCHUTES COUNTY PROPERTY PROFILE INFORMATION Parcel #: 118719 Tax Lot: 171228AC00400 Owner: Carder, Cami Sue Et Al CoOwner: Site: 2640 NE 8th St Bend OR 97701 Mail: 2640 NE 8th St Bend OR 97701 Land Use: 191 - Residential - Potential development - Improved (typical of class) Std Land Use: 1001 - Single Family Residential Legal: Twn/Rng/Sec: T:17S R:12E S:28 Q:NE QQ:SW
ASSESSMENT & TAX INFORMATION Market Total: $769,310.00 Market Land: $403,460.00 Market Impr: $365,850.00 Assessment Year: 2024 Assessed Total: $200,550.00 Exemption: Taxes: $3,357.91 Levy Code: 1-001 Levy Rate: 16.7435
SALE & LOAN INFORMATION Sale Date: 05/06/2024 Sale Amount: Document #: 2024-11225 Deed Type: Loan Amount: Lender: Loan Type: Interest Type: Title Co:
PROPERTY CHARACTERISTICS Year Built: 1965 Eff Year Built: Bedrooms: 3 Bathrooms: 2 # of Stories: 1 Total SqFt: 1,359 SqFt Floor 1 SqFt: 1,359 SqFt Floor 2 SqFt: Basement SqFt: Lot size: 1.13 Acres (49,223 SqFt) Garage SqFt: 480 SqFt Garage Type: AC: Pool: Heat Source: Forced air unit Fireplace: 1 Bldg Condition: Average Neighborhood: 8 Lot: Block: Plat/Subdiv: N/A Zoning: City Of Bend-RS - Standard Density Residential School Dist: 1 - Bend-La Pine Administrative Census: 2017 - 001601 Recreation:
Sentry Dynamics, Inc. and its customers make no representations, warranties or conditions, express or implied, as to the accuracy or completeness of information contained in this report.
Aerial Map
Parcel ID: 118719 Tax Account #: 171228AC00400 2640 NE 8th St, Bend OR 97701 This map/plat is being furnished as an aid in locating the herein described land in relation to adjoining streets, natural boundaries and other land, and is not a survey of the land depicted. Except to the extent a policy of title insurance is expressly modified by endorsement, if any, the company does not insure dimensions, distances, location of easements, acreage or other matters shown thereon.
Assessor Map
Parcel ID: 118719 Tax Account #: 171228AC00400 2640 NE 8th St, Bend OR 97701 This map/plat is being furnished as an aid in locating the herein described land in relation to adjoining streets, natural boundaries and other land, and is not a survey of the land depicted. Except to the extent a policy of title insurance is expressly modified by endorsement, if any, the company does not insure dimensions, distances, location of easements, acreage or other matters shown thereon.
Contour Map
Parcel ID: 118719 Tax Account #: 171228AC00400 2640 NE 8th St, Bend OR 97701 This map/plat is being furnished as an aid in locating the herein described land in relation to adjoining streets, natural boundaries and other land, and is not a survey of the land depicted. Except to the extent a policy of title insurance is expressly modified by endorsement, if any, the company does not insure dimensions, distances, location of easements, acreage or other matters shown thereon.
Flood Map
Parcel ID: 118719 Tax Account #: 171228AC00400 2640 NE 8th St, Bend OR 97701 This map/plat is being furnished as an aid in locating the herein described land in relation to adjoining streets, natural boundaries and other land, and is not a survey of the land depicted. Except to the extent a policy of title insurance is expressly modified by endorsement, if any, the company does not insure dimensions, distances, location of easements, acreage or other matters shown thereon.
Soil Map
Parcel ID: 118719 Tax Account #: 171228AC00400 2640 NE 8th St, Bend OR 97701 This map/plat is being furnished as an aid in locating the herein described land in relation to adjoining streets, natural boundaries and other land, and is not a survey of the land depicted. Except to the extent a policy of title insurance is expressly modified by endorsement, if any, the company does not insure dimensions, distances, location of easements, acreage or other matters shown thereon.
Subdivision Map
Parcel ID: 118719 Tax Account #: 171228AC00400 2640 NE 8th St, Bend OR 97701 This map/plat is being furnished as an aid in locating the herein described land in relation to adjoining streets, natural boundaries and other land, and is not a survey of the land depicted. Except to the extent a policy of title insurance is expressly modified by endorsement, if any, the company does not insure dimensions, distances, location of easements, acreage or other matters shown thereon.
Transportation Map
Parcel ID: 118719 Tax Account #: 171228AC00400 2640 NE 8th St, Bend OR 97701 This map/plat is being furnished as an aid in locating the herein described land in relation to adjoining streets, natural boundaries and other land, and is not a survey of the land depicted. Except to the extent a policy of title insurance is expressly modified by endorsement, if any, the company does not insure dimensions, distances, location of easements, acreage or other matters shown thereon.
Zoning Map
Parcel ID: 118719 Tax Account #: 171228AC00400 2640 NE 8th St, Bend OR 97701 This map/plat is being furnished as an aid in locating the herein described land in relation to adjoining streets, natural boundaries and other land, and is not a survey of the land depicted. Except to the extent a policy of title insurance is expressly modified by endorsement, if any, the company does not insure dimensions, distances, location of easements, acreage or other matters shown thereon.
DESCHUTES COUNTY PROPERTY PROFILE INFORMATION Parcel #: 162648 Tax Lot: 171228AC00304 Owner: Donohoe, Robert H CoOwner: Site: 2667 NE Jones Rd Bend OR 97701 Mail: PO Box 7394 Bend OR 97708 Land Use: 191 - Residential - Potential development - Improved (typical of class) Std Land Use: 1001 - Single Family Residential Legal: Twn/Rng/Sec: T:17S R:12E S:28 Q:NE QQ:SW
ASSESSMENT & TAX INFORMATION Market Total: $558,370.00 Market Land: $354,290.00 Market Impr: $204,080.00 Assessment Year: 2024 Assessed Total: $145,740.00 Exemption: Taxes: $2,440.19
PROPERTY CHARACTERISTICS Year Built: 1981 Eff Year Built: Bedrooms: 2 Bathrooms: 1 # of Stories: 1 Total SqFt: 960 SqFt Floor 1 SqFt: 960 SqFt
Levy Code: 1-001
Floor 2 SqFt:
Levy Rate: 16.7435
Basement SqFt: Lot size: 0.25 Acres (10,890 SqFt) Garage SqFt: 315 SqFt Garage Type: AC:
SALE & LOAN INFORMATION
Pool: Heat Source: Electric Fireplace: 1
Sale Date: 03/10/2000 Sale Amount: $85,000.00 Document #: 2000-9671 Deed Type: Deed Loan Amount: Lender: Loan Type: Interest Type: Title Co:
Bldg Condition: Average Neighborhood: 8 Lot: Block: Plat/Subdiv: Zoning: Deschutes-RS - Standard Density Residential School Dist: 1 - Bend-La Pine Administrative Census: 2017 - 001601 Recreation:
Sentry Dynamics, Inc. and its customers make no representations, warranties or conditions, express or implied, as to the accuracy or completeness of information contained in this report.
Aerial Map
Parcel ID: 162648 Tax Account #: 171228AC00304 2667 NE Jones Rd, Bend OR 97701 This map/plat is being furnished as an aid in locating the herein described land in relation to adjoining streets, natural boundaries and other land, and is not a survey of the land depicted. Except to the extent a policy of title insurance is expressly modified by endorsement, if any, the company does not insure dimensions, distances, location of easements, acreage or other matters shown thereon.
Assessor Map
Parcel ID: 162648 Tax Account #: 171228AC00304 2667 NE Jones Rd, Bend OR 97701 This map/plat is being furnished as an aid in locating the herein described land in relation to adjoining streets, natural boundaries and other land, and is not a survey of the land depicted. Except to the extent a policy of title insurance is expressly modified by endorsement, if any, the company does not insure dimensions, distances, location of easements, acreage or other matters shown thereon.
Left blank intentionally
City of Bend Utilities & Services
Left blank intentionally
ESRI Data
Site Map 2640 NE 8th St, Bend, Oregon, 97701 Ring bands: 0-1, 1-3, 3-5 mile radii
0
0.8
Prepared by Esri Latitude: 44.07560 Longitude: -121.28971
1.6
mi
April 11, 2025 ©2025 Esri
Page 1 of 1
ACS Population Summary 2640 NE 8th St, Bend, Oregon, 97701 Ring band: 0 - 1 mile radius
Prepared by Esri Latitude: 44.07560 Longitude: -121.28971 2018-2022 ACS Estimate
Percent
MOE(±)
Reliability
TOTALS Total Population
11,242
879
Total Households
4,778
335
Total Housing Units
5,000
329
POPULATION AGE 3+ YEARS BY SCHOOL ENROLLMENT Total Enrolled in school Enrolled in nursery school, preschool Public school Private school Enrolled in kindergarten
10,902
100.0%
814
2,580
23.7%
437
92
0.8%
41
31 61
0.3% 0.6%
26 47
170
1.6%
122
Public school
119
1.1%
108
Private school
51
0.5%
61
523
4.8%
154
Public school
390
3.6%
142
Private school
133
1.2%
81
564
5.2%
195
Public school
550
5.0%
195
Private school
14
0.1%
20
659
6.0%
200
Public school
657
6.0%
200
Private school
2
0.0%
36
425
3.9%
187
Public school
401
3.7%
187
Private school
24
0.2%
141
146
1.3%
119
Public school
138
1.3%
119
Private school
7
0.1%
12
8,323
76.3%
532
1,528
100.0%
192
1,487
97.3%
190
914
59.8%
188
Householder
473
31.0%
96
Spouse
328
21.5%
77
Parent
113
7.4%
111
Parent-in-law
0
0.0%
0
Other Relative
0
0.0%
0
Nonrelative
0
0.0%
0
573
37.5%
114
Householder
562
36.8%
114
Nonrelative
11
0.7%
19
41
2.7%
31
Enrolled in grade 1 to grade 4
Enrolled in grade 5 to grade 8
Enrolled in grade 9 to grade 12
Enrolled in college undergraduate years
Enrolled in graduate or professional school
Not enrolled in school POPULATION AGE 65+ BY RELATIONSHIP AND HOUSEHOLD TYPE Total Living in Households Living in Family Households
Living in Nonfamily Households
Living in Group Quarters
Source: U.S. Census Bureau, 2018-2022 American Community Survey
Reliability:
high
medium
low
April 11, 2025 ©2025 Esri
Page 1 of 24
ACS Population Summary 2640 NE 8th St, Bend, Oregon, 97701 Ring band: 0 - 1 mile radius
Prepared by Esri Latitude: 44.07560 Longitude: -121.28971 2018-2022 ACS Estimate
Percent
MOE(±)
Reliability
HOUSEHOLDS BY TYPE AND SIZE Family Households
2,710
56.7%
291
2-Person
1,102
23.1%
180
3-Person
987
20.7%
228
4-Person
479
10.0%
116
5-Person
95
2.0%
69
6-Person
7
0.1%
18
7+ Person
41
0.9%
155
Nonfamily Households
2,068
43.3%
306
1-Person
1,534
32.1%
262
2-Person
381
8.0%
132
3-Person
93
1.9%
65
4-Person
61
1.3%
64
5-Person
0
0.0%
0
6-Person
0 0
0.0% 0.0%
0 0
1,514
31.7%
223
1,463 845 132 486
30.6% 17.7% 2.8% 10.2%
215 142 61 195
51 3,265 928 320
1.1% 68.3% 19.4% 6.7%
64 298 139 135
2,017
42.2%
314
Households with Pop 65+ 1-Person
1,144 534
23.9% 11.2%
149 114
2+ Person Family 2+ Person Nonfamily Households with No Pop 65+ 1-Person 2+ Person Family 2+ Person Nonfamily
597 13 3,635 1,000 2,113 521
12.5% 0.3% 76.1% 20.9% 44.2% 10.9%
130 17 338 253 273 153
11,135
100.0%
877
8,262
74.2%
875
5,352
48.1%
700
5,324
47.8%
699
28
0.3%
42
856
7.7%
357
Relatives
693
6.2%
258
Nonrelatives
163
1.5%
115
2,054
18.4%
606
1,891
17.0%
561
Nonrelatives
164
1.5%
97
In Nonfamily Households
2,873
25.8%
486
7+ Person HOUSEHOLDS BY PRESENCE OF PEOPLE UNDER 18 YEARS BY HOUSEHOLD TYPE
Households with one or more people under 18 years Family households Married-couple family Male householder, no wife present Female householder, no husband present Nonfamily households Households with no people under 18 years Married-couple family Other family Nonfamily households HOUSEHOLDS BY PRESENCE OF PEOPLE 65 YEARS AND OVER, HOUSEHOLD SIZE AND HOUSEHOLD TYPE
HOUSEHOLD TYPE BY RELATIVES AND NONRELATIVES FOR POPULATION IN HOUSEHOLDS Total In Family Households In Married-Couple Family Relatives Nonrelatives In Male Householder-No Spouse Present-Family
In Female Householder-No Spouse Present-Family Relatives
Source: U.S. Census Bureau, 2018-2022 American Community Survey
Reliability:
high
medium
low
April 11, 2025 ©2025 Esri
Page 2 of 24
ACS Population Summary 2640 NE 8th St, Bend, Oregon, 97701 Ring band: 0 - 1 mile radius
Prepared by Esri Latitude: 44.07560 Longitude: -121.28971 2018-2022 ACS Estimate
Percent
MOE(±)
10,713
100.0%
835
1,857
17.3%
343
135 135
1.3% 1.3%
127 127
0 0
0.0% 0.0%
0 0
0 0
0.0% 0.0%
0 0
Speak English "not well"
0
0.0%
0
Speak English "not at all"
0
0.0%
0
Speak Asian and Pacific Island languages
23
0.2%
46
Speak English "very well" or "well"
23
0.2%
46
Speak English "not well"
0
0.0%
0
Speak English "not at all"
0
0.0%
0
0
0.0%
0
0 0
0.0% 0.0%
0 0
0
0.0%
0
6,627 381
61.9% 3.6%
623 174
375 6
3.5% 0.1%
135 11
Reliability
POPULATION AGE 5+ YEARS BY LANGUAGE SPOKEN AT HOME AND ABILITY TO SPEAK ENGLISH Total 5 to 17 years Speak only English Speak Spanish Speak English "very well" or "well" Speak English "not well" Speak English "not at all" Speak other Indo-European languages Speak English "very well" or "well"
Speak other languages Speak English "very well" or "well" Speak English "not well" Speak English "not at all" 18 to 64 years Speak only English Speak Spanish Speak English "very well" or "well" Speak English "not well"
0
0.0%
0
Speak other Indo-European languages
Speak English "not at all"
72
0.7%
57
Speak English "very well" or "well"
72
0.7%
57
Speak English "not well" Speak English "not at all"
0 0
0.0% 0.0%
0 0
Speak Asian and Pacific Island languages
76
0.7%
85
Speak English "very well" or "well"
76
0.7%
85
Speak English "not well"
0
0.0%
0
Speak English "not at all"
0
0.0%
0
13
0.1%
37
Speak English "very well" or "well"
13
0.1%
37
Speak English "not well"
0
0.0%
0
Speak English "not at all" 65 years and over
0
0.0%
0
1,485 17
13.9% 0.2%
190 33
Speak English "very well" or "well" Speak English "not well"
17 0
0.2% 0.0%
33 0
Speak English "not at all" Speak other Indo-European languages
0 26
0.0% 0.2%
0 26
Speak English "very well" or "well" Speak English "not well"
21 5
0.2% 0.0%
25 25
Speak English "not at all"
0
0.0%
0
0 0
0.0% 0.0%
0 0
0 0
0.0% 0.0%
0 0
0 0
0.0% 0.0%
0 0
0 0
0.0% 0.0%
0 0
Speak other languages
Speak only English Speak Spanish
Speak Asian and Pacific Island languages Speak English "very well" or "well" Speak English "not well" Speak English "not at all" Speak other languages Speak English "very well" or "well" Speak English "not well" Speak English "not at all"
Source: U.S. Census Bureau, 2018-2022 American Community Survey
Reliability:
high
medium
low
April 11, 2025 ©2025 Esri
Page 3 of 24
ACS Population Summary 2640 NE 8th St, Bend, Oregon, 97701 Ring band: 0 - 1 mile radius
Prepared by Esri Latitude: 44.07560 Longitude: -121.28971 2018-2022 ACS Estimate
Percent
MOE(±)
6,092
100.0%
619
5,859
96.2%
583
Worked in state and outside county of residence
82
1.3%
57
Worked outside state of residence
152
2.5%
140
6,106
100.0%
600
3,147
51.5%
392
2,364
38.7%
368
Self-employed in own incorporated business
41
0.7%
34
Private not-for-profit wage and salary workers
181
3.0%
57
Local government workers
153
2.5%
86
State government workers
105
1.7%
63
Federal government workers
47
0.8%
55
Self-employed in own not incorporated business workers
255
4.2%
80
0
0.0%
0
2,959
48.5%
336
Reliability
WORKERS AGE 16+ YEARS BY PLACE OF WORK Total Worked in state and in county of residence
SEX BY CLASS OF WORKER FOR THE CIVILIAN EMPLOYED POPULATION 16 YEARS AND OVER Total: Male: Employee of private company workers
Unpaid family workers Female: Employee of private company workers
1,746
28.6%
302
Self-employed in own incorporated business
78
1.3%
59
Private not-for-profit wage and salary workers
255
4.2%
89
Local government workers
398
6.5%
180
State government workers
204
3.3%
113
Federal government workers
26
0.4%
25
Self-employed in own not incorporated business workers
252
4.1%
123
0
0.0%
0
11,135
100.0%
877
2,542
22.8%
392
2,542
22.8%
394
0
0.0%
0
7,105
63.8%
622
7,032
63.2%
619
73
0.7%
73
1,487
13.4%
190
Have a Computer
1,377
12.4%
189
Have NO Computer
110
1.0%
56
4,778
100.0%
335
4,228
88.5%
314
0
0.0%
0
3,690
77.2%
297
Satellite Service
197
4.1%
111
Other Service
6
0.1%
94
Internet Access with no Subscription
188
3.9%
143
With No Internet Access
363
7.6%
151
Unpaid family workers POPULATION IN HOUSEHOLDS AND PRESENCE OF A COMPUTER Total Population <18 in Households Have a Computer Have NO Computer Population 18-64 in Households Have a Computer Have NO Computer Population 65+ in Households
HOUSEHOLDS AND INTERNET SUBSCRIPTIONS Total With an Internet Subscription Dial-Up Alone Broadband
Source: U.S. Census Bureau, 2018-2022 American Community Survey
Reliability:
high
medium
low
April 11, 2025 ©2025 Esri
Page 4 of 24
ACS Population Summary 2640 NE 8th St, Bend, Oregon, 97701 Ring band: 0 - 1 mile radius
Prepared by Esri Latitude: 44.07560 Longitude: -121.28971 2018-2022 ACS Estimate
Percent
MOE(±)
Reliability
WORKERS AGE 16+ YEARS BY MEANS OF TRANSPORTATION TO WORK Total
6,092
100.0%
619
Drove alone
3,972
65.2%
490
Carpooled
762
12.5%
265
2
0.0%
23
Bus or trolley bus
2
0.0%
23
Light rail, streetcar or trolley
0
0.0%
0
Subway or elevated
0
0.0%
0
Long-distance/Commuter Train
0
0.0%
0
Ferryboat
0
0.0%
0
7
0.1%
41
Public transportation (excluding taxicab)
Taxicab Motorcycle
2
0.0%
21
Bicycle
176
2.9%
98
Walked
72
1.2%
45
Other means
57
0.9%
84
1,043
17.1%
253
5,050
100.0%
624
225
4.5%
112
5 to 9 minutes
1,166
23.1%
266
10 to 14 minutes
1,180
23.4%
244
15 to 19 minutes
1,334
26.4%
337
20 to 24 minutes
476
9.4%
138
25 to 29 minutes
182
3.6%
97
30 to 34 minutes
166
3.3%
89
35 to 39 minutes
67
1.3%
59
40 to 44 minutes 45 to 59 minutes
94 151
1.9% 3.0%
97 83
60 to 89 minutes
2
0.0%
23
90 or more minutes
7
0.1%
26
Worked at home WORKERS AGE 16+ YEARS (WHO DID NOT WORK FROM HOME) BY TRAVEL TIME TO WORK Total Less than 5 minutes
Average Travel Time to Work (in minutes)
N/A
FEMALES AGE 20-64 YEARS BY AGE OF OWN CHILDREN AND EMPLOYMENT STATUS Total 3,462 Own children under 6 years only 357 In labor force 273 Not in labor force 84 Own children under 6 years and 6 to 17 years 53 In labor force 24 Not in labor force 29 Own children 6 to 17 years only 1,052 In labor force 892 Not in labor force 161 No own children under 18 years 2,000 In labor force 1,651 Not in labor force 348
Source: U.S. Census Bureau, 2018-2022 American Community Survey
N/A
100.0% 10.3% 7.9% 2.4% 1.5% 0.7% 0.8% 30.4% 25.8% 4.7% 57.8% 47.7% 10.1%
Reliability:
high
328 196 178 81 39 26 30 204 195 104 249 244 126
medium
low
April 11, 2025 ©2025 Esri
Page 5 of 24
ACS Population Summary 2640 NE 8th St, Bend, Oregon, 97701 Ring band: 0 - 1 mile radius
Prepared by Esri Latitude: 44.07560 Longitude: -121.28971 2018-2022 ACS Estimate
Percent
MOE(±)
11,165
100.0%
858
2,578
23.1%
400
2,354
21.1%
396
Employer-Based Health Ins Only
1,212
10.9%
214
Direct-Purchase Health Ins Only
133
1.2%
90
Medicare Coverage Only
0
0.0%
0
Medicaid Coverage Only
960
8.6%
376
TRICARE/Military Hlth Cov Only
48
0.4%
76
VA Health Care Only
0
0.0%
0
201
1.8%
91
Reliability
CIVILIAN NONINSTITUTIONALIZED POPULATION BY AGE & TYPES OF HEALTH INSURANCE COVERAGE Total Under 19 years: One Type of Health Insurance:
2+ Types of Health Insurance No Health Insurance Coverage 19 to 34 years: One Type of Health Insurance:
23
0.2%
86
3,025
27.1%
538
2,502
22.4%
445
Employer-Based Health Ins Only
1,820
16.3%
383
Direct-Purchase Health Ins Only
205
1.8%
108
Medicare Coverage Only
0
0.0%
0
Medicaid Coverage Only
425
3.8%
233
TRICARE/Military Hlth Cov Only
0
0.0%
0
VA Health Care Only
52
0.5%
69
2+ Types of Health Insurance
105
0.9%
79
No Health Insurance Coverage
418
3.7%
222
4,053
36.3%
393
3,538
31.7%
388
Employer-Based Health Ins Only
2,439
21.8%
326
Direct-Purchase Health Ins Only
408
3.7%
197
Medicare Coverage Only
72
0.6%
72
Medicaid Coverage Only
571
5.1%
164
TRICARE/Military Hlth Cov Only
12
0.1%
138
VA Health Care Only
36
0.3%
62
2+ Types of Health Insurance
427
3.8%
203
35 to 64 years: One Type of Health Insurance:
No Health Insurance Coverage 65+ years: One Type of Health Insurance:
88
0.8%
38
1,509
13.5%
192
434
3.9%
99
Employer-Based Health Ins Only
27
0.2%
29
Direct-Purchase Health Ins Only
0
0.0%
0
406
3.6%
96
TRICARE/Military Hlth Cov Only
0
0.0%
0
VA Health Care Only
0
0.0%
0
1,075
9.6%
187
Medicare Coverage Only
2+ Types of Health Insurance: Employer-Based & Direct-Purchase Health Insurance
0
0.0%
0
Employer-Based Health & Medicare Insurance
331
3.0%
133
Direct-Purchase Health & Medicare Insurance
262
2.3%
83
Medicare & Medicaid Coverage
112
1.0%
54
Other Private Health Insurance Combos
0
0.0%
0
Other Public Health Insurance Combos
14
0.1%
31
Other Health Insurance Combinations
356
3.2%
147
0
0.0%
36
No Health Insurance Coverage
Source: U.S. Census Bureau, 2018-2022 American Community Survey
Reliability:
high
medium
low
April 11, 2025 ©2025 Esri
Page 6 of 24
ACS Population Summary 2640 NE 8th St, Bend, Oregon, 97701 Ring band: 0 - 1 mile radius
Prepared by Esri Latitude: 44.07560 Longitude: -121.28971 2018-2022 ACS Estimate
Percent
MOE(±)
Reliability
POPULATION BY RATIO OF INCOME TO POVERTY LEVEL Total
11,214
100.0%
878
Under .50
503
4.5%
187
.50 to .99
599
5.3%
186
1.00 to 1.24
458
4.1%
316
1.25 to 1.49
369
3.3%
193
1.50 to 1.84
710
6.3%
394
1.85 to 1.99
197 8,379
1.8%
121
74.7%
720
8,642
100.0%
606
519
6.0%
155
8,123
94.0%
561
4,269
49.4%
424
519
6.0%
155
3,750
43.4%
375
4,373
50.6%
343
0
0.0%
9
4,373
50.6%
343
2.00 and over CIVILIAN POPULATION AGE 18 OR OLDER BY VETERAN STATUS Total Veteran Nonveteran Male Veteran Nonveteran Female Veteran Nonveteran CIVILIAN VETERANS AGE 18 OR OLDER BY PERIOD OF MILITARY SERVICE Total
520
100.0%
155
Gulf War (9/01 or later), no Gulf War (8/90 to 8/01), no Vietnam Era
175
33.7%
123
Gulf War (9/01 or later) and Gulf War (8/90 to 8/01), no Vietnam Era
6
1.2%
18
Gulf War (9/01 or later), and Gulf War (8/90 to 8/01), and Vietnam Era
0
0.0%
0
Gulf War (8/90 to 8/01), no Vietnam Era
68
13.1%
45
Gulf War (8/90 to 8/01) and Vietnam Era
0
0.0%
0
Vietnam Era, no Korean War, no World War II
205
39.4%
84
Vietnam Era and Korean War, no World War II
0
0.0%
0
Vietnam Era and Korean War and World War II
0
0.0%
0
Korean War, no Vietnam Era, no World War II
8
1.5%
21
Korean War and World War II, no Vietnam Era
0
0.0%
0
World War II, no Korean War, no Vietnam Era
28
5.4%
29
Between Gulf War and Vietnam Era only
17
3.3%
32
Between Vietnam Era and Korean War only
13
2.5%
55
Between Korean War and World War II only
0
0.0%
0
Pre-World War II only
0
0.0%
0
4,778
100.0%
335
520
10.9%
147
Married-couple family
41
0.9%
35
Other family - male householder (no wife present)
11
0.2%
19
Other family - female householder (no husband present)
139
2.9%
89
Nonfamily household - male householder
100
2.1%
71
Nonfamily household - female householder
229
4.8%
113
4,258
89.1%
327
1,732
36.2%
191
Other family - male householder (no wife present)
254
5.3%
107
Other family - female householder (no husband present)
533
11.2%
197
Nonfamily household - male householder
1,031
21.6%
251
Nonfamily household - female householder
708
14.8%
173
HOUSEHOLDS BY POVERTY STATUS Total Income in the past 12 months below poverty level
Income in the past 12 months at or above poverty level Married-couple family
Poverty Index Source: U.S. Census Bureau, 2018-2022 American Community Survey
88
Reliability:
high
medium
low
April 11, 2025 ©2025 Esri
Page 7 of 24
ACS Population Summary 2640 NE 8th St, Bend, Oregon, 97701 Ring band: 0 - 1 mile radius
Prepared by Esri Latitude: 44.07560 Longitude: -121.28971 2018-2022 ACS Estimate
Percent
MOE(±)
Social Security Income
1,245
26.1%
186
No Social Security Income
3,533
73.9%
325
Reliability
HOUSEHOLDS BY OTHER INCOME
Retirement Income No Retirement Income
832
17.4%
135
3,947
82.6%
341
GROSS RENT AS A PERCENTAGE OF HOUSEHOLD INCOME IN THE PAST 12 MONTHS <10% of Income
165
6.7%
100
10-14.9% of Income
87
3.5%
52
15-19.9% of Income
226
9.1%
78
20-24.9% of Income
280
11.3%
165
25-29.9% of Income
249
10.1%
120
30-34.9% of Income
132
5.3%
80
35-39.9% of Income
191
7.7%
119
40-49.9% of Income
479
19.3%
193
50+% of Income
480
19.4%
172
Gross Rent % Inc Not Computed
188
7.6%
143
4,778
HOUSEHOLDS BY PUBLIC ASSISTANCE INCOME IN THE PAST 12 MONTHS Total With public assistance income No public assistance income
108 4,670
100.0% 2.3% 97.7%
335 48 339
HOUSEHOLDS BY FOOD STAMPS/SNAP STATUS Total With Food Stamps/SNAP With No Food Stamps/SNAP
4,778 587 4,192
100.0% 12.3% 87.7%
335 193 332
HOUSEHOLDS BY DISABILITY STATUS Total With 1+ Persons w/Disability With No Person w/Disability
4,778 997 3,781
100.0% 20.9% 79.1%
335 209 367
Data Note: N/A means not available. Population by Ratio of Income to Poverty Level represents persons for whom poverty status is determined. Household income represents income in 2022, adjusted for inflation. 2018-2022 ACS Estimate: The American Community Survey (ACS) replaces census sample data. Esri is releasing the 2018-2022 ACS estimates, five-year period data collected monthly from January 1, 2018 through December 31, 2022. Although the ACS includes many of the subjects previously covered by the decennial census sample, there are significant differences between the two surveys including fundamental differences in survey design and residency rules. Margin of error (MOE): The MOE is a measure of the variability of the estimate due to sampling error. MOEs enable the data user to measure the range of uncertainty for each estimate with 90 percent confidence. The range of uncertainty is called the confidence interval, and it is calculated by taking the estimate +/- the MOE. For example, if the ACS reports an estimate of 100 with an MOE of +/- 20, then you can be 90 percent certain the value for the whole population falls between 80 and 120. Reliability: These symbols represent threshold values that Esri has established from the Coefficients of Variation (CV) to designate the usability of the estimates. The CV measures the amount of sampling error relative to the size of the estimate, expressed as a percentage. High Reliability: Small CVs (less than or equal to 12 percent) are flagged green to indicate that the sampling error is small relative to the estimate and the estimate is reasonably reliable. Medium Reliability: Estimates with CVs between 12 and 40 are flagged yellow-use with caution. Low Reliability: Large CVs (over 40 percent) are flagged red to indicate that the sampling error is large relative to the estimate. The estimate is considered very unreliable. Source: U.S. Census Bureau, 2018-2022 American Community Survey
Reliability:
high
medium
low
April 11, 2025 ©2025 Esri
Page 8 of 24
ACS Population Summary 2640 NE 8th St, Bend, Oregon, 97701 Ring band: 1 - 3 mile radius
Prepared by Esri Latitude: 44.07560 Longitude: -121.28971 2018-2022 ACS Estimate
Percent
MOE(±)
Reliability
TOTALS Total Population
54,216
2,175
Total Households
23,272
861
Total Housing Units
25,223
856
POPULATION AGE 3+ YEARS BY SCHOOL ENROLLMENT Total Enrolled in school Enrolled in nursery school, preschool Public school Private school Enrolled in kindergarten
52,556
100.0%
2,006
10,960
20.9%
693
873
1.7%
208
445 428
0.8% 0.8%
188 94
540
1.0%
178
Public school
485
0.9%
172
Private school
56
0.1%
45
2,088
4.0%
232
Public school
1,673
3.2%
218
Private school
415
0.8%
94
2,261
4.3%
297
Public school
2,158
4.1%
293
Private school
103
0.2%
51
2,482
4.7%
269
Public school
2,283
4.3%
262
Private school
200
0.4%
53
2,458
4.7%
335
Public school
2,137
4.1%
317
Private school
320
0.6%
114
257
0.5%
55
Public school
210
0.4%
58
Private school
47
0.1%
44
41,596
79.1%
1,358
Enrolled in grade 1 to grade 4
Enrolled in grade 5 to grade 8
Enrolled in grade 9 to grade 12
Enrolled in college undergraduate years
Enrolled in graduate or professional school
Not enrolled in school POPULATION AGE 65+ BY RELATIONSHIP AND HOUSEHOLD TYPE Total
8,587
100.0%
525
Living in Households
8,260
96.2%
516
Living in Family Households
5,081
59.2%
388
Householder
2,584
30.1%
207
Spouse
2,135
24.9%
177
Parent
240
2.8%
83
Parent-in-law
90
1.0%
60
Other Relative
0
0.0%
4
Nonrelative
32
0.4%
53
Living in Nonfamily Households
3,179
37.0%
395
Householder
3,039
35.4%
380
Nonrelative
140
1.6%
64
327
3.8%
93
Living in Group Quarters
Source: U.S. Census Bureau, 2018-2022 American Community Survey
Reliability:
high
medium
low
April 11, 2025 ©2025 Esri
Page 9 of 24
ACS Population Summary 2640 NE 8th St, Bend, Oregon, 97701 Ring band: 1 - 3 mile radius
Prepared by Esri Latitude: 44.07560 Longitude: -121.28971 2018-2022 ACS Estimate
Percent
MOE(±)
Reliability
HOUSEHOLDS BY TYPE AND SIZE Family Households
12,959
55.7%
570
2-Person
6,089
26.2%
388
3-Person
2,748
11.8%
300
4-Person
2,877
12.4%
315
5-Person
747
3.2%
160
6-Person
81
0.3%
73
7+ Person
416
1.8%
232
Nonfamily Households
10,312
44.3%
725
1-Person
7,370
31.7%
605
2-Person
2,293
9.9%
355
3-Person
493
2.1%
185
4-Person
103
0.4%
42
5-Person
53
0.2%
57
6-Person
0 0
0.0% 0.0%
0 0
6,086
26.2%
486
6,006 3,914 942 1,150
25.8% 16.8% 4.0% 4.9%
475 352 201 281
79 17,186 5,958 995
0.3% 73.8% 25.6% 4.3%
79 773 372 154
10,233
44.0%
720
Households with Pop 65+ 1-Person
6,247 2,858
26.8% 12.3%
427 375
2+ Person Family 2+ Person Nonfamily Households with No Pop 65+ 1-Person 2+ Person Family 2+ Person Nonfamily
3,167 222 17,024 4,512 9,792 2,720
13.6% 1.0% 73.2% 19.4% 42.1% 11.7%
231 78 790 486 555 417
53,389
100.0%
2,176
39,161
73.4%
2,003
29,023
54.4%
1,408
28,433
53.3%
1,350
589
1.1%
278
4,225
7.9%
864
3,497
6.6%
709
728
1.4%
314
5,913
11.1%
1,285
5,548
10.4%
1,249
366
0.7%
150
14,228
26.6%
1,087
7+ Person HOUSEHOLDS BY PRESENCE OF PEOPLE UNDER 18 YEARS BY HOUSEHOLD TYPE
Households with one or more people under 18 years Family households Married-couple family Male householder, no wife present Female householder, no husband present Nonfamily households Households with no people under 18 years Married-couple family Other family Nonfamily households HOUSEHOLDS BY PRESENCE OF PEOPLE 65 YEARS AND OVER, HOUSEHOLD SIZE AND HOUSEHOLD TYPE
HOUSEHOLD TYPE BY RELATIVES AND NONRELATIVES FOR POPULATION IN HOUSEHOLDS Total In Family Households In Married-Couple Family Relatives Nonrelatives In Male Householder-No Spouse Present-Family Relatives Nonrelatives In Female Householder-No Spouse Present-Family Relatives Nonrelatives In Nonfamily Households Source: U.S. Census Bureau, 2018-2022 American Community Survey
Reliability:
high
medium
low
April 11, 2025 ©2025 Esri
Page 10 of 24
ACS Population Summary 2640 NE 8th St, Bend, Oregon, 97701 Ring band: 1 - 3 mile radius
Prepared by Esri Latitude: 44.07560 Longitude: -121.28971 2018-2022 ACS Estimate
Percent
MOE(±)
51,447
100.0%
1,964
6,993
13.6%
599
804 782
1.6% 1.5%
300 295
22 0
0.0% 0.0%
36 0
74 74
0.1% 0.1%
91 91
Speak English "not well"
0
0.0%
0
Speak English "not at all"
0
0.0%
0
Speak Asian and Pacific Island languages
36
0.1%
67
Speak English "very well" or "well"
36
0.1%
67
Speak English "not well"
0
0.0%
0
Speak English "not at all"
0
0.0%
0
0
0.0%
0
0 0
0.0% 0.0%
0 0
0
0.0%
0
32,295 1,871
62.8% 3.6%
1,578 352
1,719 98
3.3% 0.2%
311 90
Reliability
POPULATION AGE 5+ YEARS BY LANGUAGE SPOKEN AT HOME AND ABILITY TO SPEAK ENGLISH Total 5 to 17 years Speak only English Speak Spanish Speak English "very well" or "well" Speak English "not well" Speak English "not at all" Speak other Indo-European languages Speak English "very well" or "well"
Speak other languages Speak English "very well" or "well" Speak English "not well" Speak English "not at all" 18 to 64 years Speak only English Speak Spanish Speak English "very well" or "well" Speak English "not well"
54
0.1%
66
Speak other Indo-European languages
Speak English "not at all"
374
0.7%
130
Speak English "very well" or "well"
374
0.7%
132
0 0
0.0% 0.0%
0 0
Speak Asian and Pacific Island languages
287
0.6%
56
Speak English "very well" or "well"
286
0.6%
55
Speak English "not well"
1
0.0%
11
Speak English "not at all"
0
0.0%
0
126
0.2%
143
Speak English "not well" Speak English "not at all"
Speak other languages Speak English "very well" or "well"
126
0.2%
143
Speak English "not well"
0
0.0%
0
Speak English "not at all" 65 years and over
0
0.0%
0
7,997 242
15.5% 0.5%
495 70
Speak English "very well" or "well" Speak English "not well"
239 1
0.5% 0.0%
65 10
Speak English "not at all" Speak other Indo-European languages
2 285
0.0% 0.6%
8 162
Speak English "very well" or "well" Speak English "not well"
275 11
0.5% 0.0%
161 26
Speak only English Speak Spanish
Speak English "not at all" Speak Asian and Pacific Island languages Speak English "very well" or "well" Speak English "not well" Speak English "not at all" Speak other languages Speak English "very well" or "well" Speak English "not well" Speak English "not at all"
Source: U.S. Census Bureau, 2018-2022 American Community Survey
0
0.0%
0
63 63
0.1% 0.1%
59 59
0 0
0.0% 0.0%
0 0
1 1
0.0% 0.0%
18 18
0 0
0.0% 0.0%
0 0
Reliability:
high
medium
low
April 11, 2025 ©2025 Esri
Page 11 of 24
ACS Population Summary 2640 NE 8th St, Bend, Oregon, 97701 Ring band: 1 - 3 mile radius
Prepared by Esri Latitude: 44.07560 Longitude: -121.28971 2018-2022 ACS Estimate
Percent
MOE(±)
28,594
100.0%
1,347
27,635
96.6%
1,282
Worked in state and outside county of residence
729
2.5%
258
Worked outside state of residence
230
0.8%
80
29,196
100.0%
1,351
15,679
53.7%
815
Employee of private company workers
10,534
36.1%
734
Self-employed in own incorporated business
1,472
5.0%
306
Private not-for-profit wage and salary workers
802
2.7%
126
Local government workers
860
2.9%
161
State government workers
527
1.8%
131
Federal government workers
252
0.9%
74
1,209
4.1%
200
Reliability
WORKERS AGE 16+ YEARS BY PLACE OF WORK Total Worked in state and in county of residence
SEX BY CLASS OF WORKER FOR THE CIVILIAN EMPLOYED POPULATION 16 YEARS AND OVER Total: Male:
Self-employed in own not incorporated business workers Unpaid family workers Female: Employee of private company workers
22
0.1%
66
13,516
46.3%
770
7,888
27.0%
637
Self-employed in own incorporated business
686
2.3%
136
Private not-for-profit wage and salary workers
1,389
4.8%
155
Local government workers
1,180
4.0%
211
State government workers
602
2.1%
128
Federal government workers
132
0.5%
61
1,618
5.5%
276
21
0.1%
28
53,389
100.0%
2,176
10,656
20.0%
856
10,656
20.0%
858
0
0.0%
0
34,473
64.6%
1,625
34,251
64.2%
1,614
222
0.4%
200
8,260
15.5%
516
Have a Computer
7,555
14.2%
477
Have NO Computer
705
1.3%
224
23,272
100.0%
861
21,492
92.4%
853
17
0.1%
28
Broadband
19,326
83.0%
843
Satellite Service
1,012
4.3%
267
Other Service
163
0.7%
83
562
2.4%
200
1,217
5.2%
202
Self-employed in own not incorporated business workers Unpaid family workers POPULATION IN HOUSEHOLDS AND PRESENCE OF A COMPUTER Total Population <18 in Households Have a Computer Have NO Computer Population 18-64 in Households Have a Computer Have NO Computer Population 65+ in Households
HOUSEHOLDS AND INTERNET SUBSCRIPTIONS Total With an Internet Subscription Dial-Up Alone
Internet Access with no Subscription With No Internet Access
Source: U.S. Census Bureau, 2018-2022 American Community Survey
Reliability:
high
medium
low
April 11, 2025 ©2025 Esri
Page 12 of 24
ACS Population Summary 2640 NE 8th St, Bend, Oregon, 97701 Ring band: 1 - 3 mile radius
Prepared by Esri Latitude: 44.07560 Longitude: -121.28971 2018-2022 ACS Estimate
Percent
MOE(±)
Reliability
WORKERS AGE 16+ YEARS BY MEANS OF TRANSPORTATION TO WORK Total
28,594
100.0%
1,347
Drove alone
19,172
67.0%
972
Carpooled
1,665
5.8%
267
73
0.3%
30
Bus or trolley bus
67
0.2%
31
Light rail, streetcar or trolley
0
0.0%
0
Subway or elevated
0
0.0%
0
Long-distance/Commuter Train
6
0.0%
24
Public transportation (excluding taxicab)
Ferryboat Taxicab Motorcycle
0
0.0%
0
30
0.1%
69
16
0.1%
30
Bicycle
1,192
4.2%
448
Walked
1,166
4.1%
409
193
0.7%
97
5,086
17.8%
513
Other means Worked at home WORKERS AGE 16+ YEARS (WHO DID NOT WORK FROM HOME) BY TRAVEL TIME TO WORK Total
23,508
100.0%
1,256
Less than 5 minutes
1,234
5.2%
272
5 to 9 minutes
4,720
20.1%
643
10 to 14 minutes
5,803
24.7%
520
15 to 19 minutes
5,674
24.1%
475
20 to 24 minutes
2,694
11.5%
334
25 to 29 minutes
900
3.8%
165
30 to 34 minutes
1,217
5.2%
197
35 to 39 minutes
213
0.9%
123
40 to 44 minutes 45 to 59 minutes
112 338
0.5% 1.4%
41 73
60 to 89 minutes
153
0.7%
103
90 or more minutes
450
1.9%
210
Average Travel Time to Work (in minutes)
N/A
FEMALES AGE 20-64 YEARS BY AGE OF OWN CHILDREN AND EMPLOYMENT STATUS Total 16,286 Own children under 6 years only 1,424 In labor force 731 Not in labor force 693 Own children under 6 years and 6 to 17 years 781 In labor force 566 Not in labor force 216 Own children 6 to 17 years only 2,908 In labor force 2,045 Not in labor force 863 No own children under 18 years 11,173 In labor force 9,356 Not in labor force 1,817
Source: U.S. Census Bureau, 2018-2022 American Community Survey
N/A
100.0% 8.7% 4.5% 4.3% 4.8% 3.5% 1.3% 17.9% 12.6% 5.3% 68.6% 57.4% 11.2%
Reliability:
high
860 199 113 173 198 178 87 338 226 264 731 694 260
medium
low
April 11, 2025 ©2025 Esri
Page 13 of 24
ACS Population Summary 2640 NE 8th St, Bend, Oregon, 97701 Ring band: 1 - 3 mile radius
Prepared by Esri Latitude: 44.07560 Longitude: -121.28971 2018-2022 ACS Estimate
Percent
MOE(±)
53,759
100.0%
2,174
11,386
21.2%
952
9,779
18.2%
898
Employer-Based Health Ins Only
5,207
9.7%
499
Direct-Purchase Health Ins Only
964
1.8%
232
Medicare Coverage Only
54
0.1%
63
Medicaid Coverage Only
3,443
6.4%
705
111
0.2%
75
0
0.0%
0
898
1.7%
235
Reliability
CIVILIAN NONINSTITUTIONALIZED POPULATION BY AGE & TYPES OF HEALTH INSURANCE COVERAGE Total Under 19 years: One Type of Health Insurance:
TRICARE/Military Hlth Cov Only VA Health Care Only 2+ Types of Health Insurance No Health Insurance Coverage 19 to 34 years: One Type of Health Insurance:
709
1.3%
227
13,356
24.8%
1,174
10,811
20.1%
952
Employer-Based Health Ins Only
7,588
14.1%
709
Direct-Purchase Health Ins Only
1,416
2.6%
255
Medicare Coverage Only
46
0.1%
30
Medicaid Coverage Only
1,662
3.1%
498
TRICARE/Military Hlth Cov Only
84
0.2%
49
VA Health Care Only
15
0.0%
28
2+ Types of Health Insurance
634
1.2%
240
No Health Insurance Coverage
1,911
3.6%
554
35 to 64 years:
20,596
38.3%
955
17,172
31.9%
828
Employer-Based Health Ins Only
10,806
20.1%
615
Direct-Purchase Health Ins Only
3,842
7.1%
465
Medicare Coverage Only
272
0.5%
124
Medicaid Coverage Only
1,917
3.6%
306
TRICARE/Military Hlth Cov Only
238
0.4%
82
VA Health Care Only
98
0.2%
57
2+ Types of Health Insurance
2,027
3.8%
329
No Health Insurance Coverage
1,397
2.6%
297
65+ years:
8,421
15.7%
521
2,780
5.2%
272
Employer-Based Health Ins Only
108
0.2%
31
Direct-Purchase Health Ins Only
29
0.1%
34
2,630
4.9%
271
TRICARE/Military Hlth Cov Only
0
0.0%
0
VA Health Care Only
12
0.0%
23
5,566
10.4%
472
11
0.0%
35
Employer-Based Health & Medicare Insurance
1,012
1.9%
142
Direct-Purchase Health & Medicare Insurance
2,211
4.1%
305
456
0.8%
130
Other Private Health Insurance Combos
0
0.0%
0
Other Public Health Insurance Combos
259
0.5%
107
Other Health Insurance Combinations
1,617
3.0%
279
76
0.1%
104
One Type of Health Insurance:
One Type of Health Insurance:
Medicare Coverage Only
2+ Types of Health Insurance: Employer-Based & Direct-Purchase Health Insurance
Medicare & Medicaid Coverage
No Health Insurance Coverage
Source: U.S. Census Bureau, 2018-2022 American Community Survey
Reliability:
high
medium
low
April 11, 2025 ©2025 Esri
Page 14 of 24
ACS Population Summary 2640 NE 8th St, Bend, Oregon, 97701 Ring band: 1 - 3 mile radius
Prepared by Esri Latitude: 44.07560 Longitude: -121.28971 2018-2022 ACS Estimate
Percent
MOE(±) 2,155
Reliability
POPULATION BY RATIO OF INCOME TO POVERTY LEVEL Total
53,577
100.0%
Under .50
2,824
5.3%
469
.50 to .99
3,322
6.2%
1,176
1.00 to 1.24
1,828
3.4%
386
1.25 to 1.49
2,008
3.7%
557
1.50 to 1.84
2,868
5.4%
528
1.85 to 1.99
1,468 39,258
2.7%
293
73.3%
1,473
1,662
2.00 and over CIVILIAN POPULATION AGE 18 OR OLDER BY VETERAN STATUS Total
43,526
100.0%
Veteran
2,596
6.0%
266
Nonveteran
40,930
94.0%
1,642
Male
21,680
49.8%
920
Veteran
2,399
5.5%
249
Nonveteran
19,281
44.3%
906
21,846
50.2%
996
197
0.5%
79
21,649
49.7%
989
Female Veteran Nonveteran CIVILIAN VETERANS AGE 18 OR OLDER BY PERIOD OF MILITARY SERVICE Total
2,595
100.0%
266
Gulf War (9/01 or later), no Gulf War (8/90 to 8/01), no Vietnam Era
266
10.3%
96
Gulf War (9/01 or later) and Gulf War (8/90 to 8/01), no Vietnam Era
179
6.9%
63
Gulf War (9/01 or later), and Gulf War (8/90 to 8/01), and Vietnam Era
0
0.0%
0
268
10.3%
104
Gulf War (8/90 to 8/01), no Vietnam Era Gulf War (8/90 to 8/01) and Vietnam Era
12
0.5%
19
Vietnam Era, no Korean War, no World War II
898
34.6%
186
Vietnam Era and Korean War, no World War II
14
0.5%
23
Vietnam Era and Korean War and World War II
16
0.6%
25
Korean War, no Vietnam Era, no World War II
52
2.0%
33
Korean War and World War II, no Vietnam Era
16
0.6%
25
World War II, no Korean War, no Vietnam Era
168
6.5%
57
Between Gulf War and Vietnam Era only
502
19.3%
99
Between Vietnam Era and Korean War only
191
7.4%
53
Between Korean War and World War II only
15
0.6%
26
Pre-World War II only
0
0.0%
0
23,272
100.0%
861
2,561
11.0%
424
Married-couple family
289
1.2%
100
Other family - male householder (no wife present)
176
0.8%
104
Other family - female householder (no husband present)
508
2.2%
238
Nonfamily household - male householder
667
2.9%
171
Nonfamily household - female householder
922
4.0%
273
20,710
89.0%
775
Married-couple family
9,584
41.2%
475
Other family - male householder (no wife present)
1,068
4.6%
190
Other family - female householder (no husband present)
1,335
5.7%
202
Nonfamily household - male householder
4,409
18.9%
502
Nonfamily household - female householder
4,315
18.5%
432
HOUSEHOLDS BY POVERTY STATUS Total Income in the past 12 months below poverty level
Income in the past 12 months at or above poverty level
Poverty Index Source: U.S. Census Bureau, 2018-2022 American Community Survey
89
Reliability:
high
medium
low
April 11, 2025 ©2025 Esri
Page 15 of 24
ACS Population Summary 2640 NE 8th St, Bend, Oregon, 97701 Ring band: 1 - 3 mile radius
Prepared by Esri Latitude: 44.07560 Longitude: -121.28971 2018-2022 ACS Estimate
Percent
MOE(±)
Social Security Income
5,929
25.5%
450
No Social Security Income
17,343
74.5%
792
Retirement Income
4,846
20.8%
355
No Retirement Income
18,425
79.2%
832
Reliability
HOUSEHOLDS BY OTHER INCOME
GROSS RENT AS A PERCENTAGE OF HOUSEHOLD INCOME IN THE PAST 12 MONTHS <10% of Income
277
2.8%
135
10-14.9% of Income
615
6.2%
170
15-19.9% of Income
1,186
12.0%
231
20-24.9% of Income
1,308
13.2%
281
25-29.9% of Income
1,089
11.0%
193
30-34.9% of Income
1,071
10.8%
263
35-39.9% of Income
679
6.9%
277
40-49.9% of Income
744
7.5%
205
2,427
24.5%
374
501
5.1%
111
23,272
50+% of Income Gross Rent % Inc Not Computed HOUSEHOLDS BY PUBLIC ASSISTANCE INCOME IN THE PAST 12 MONTHS Total With public assistance income No public assistance income
548 22,723
100.0% 2.4% 97.6%
861 115 859
HOUSEHOLDS BY FOOD STAMPS/SNAP STATUS Total With Food Stamps/SNAP With No Food Stamps/SNAP
23,272 1,780 21,491
100.0% 7.6% 92.3%
861 335 797
HOUSEHOLDS BY DISABILITY STATUS Total With 1+ Persons w/Disability With No Person w/Disability
23,272 4,558 18,714
100.0% 19.6% 80.4%
861 507 746
Data Note: N/A means not available. Population by Ratio of Income to Poverty Level represents persons for whom poverty status is determined. Household income represents income in 2022, adjusted for inflation. 2018-2022 ACS Estimate: The American Community Survey (ACS) replaces census sample data. Esri is releasing the 2018-2022 ACS estimates, five-year period data collected monthly from January 1, 2018 through December 31, 2022. Although the ACS includes many of the subjects previously covered by the decennial census sample, there are significant differences between the two surveys including fundamental differences in survey design and residency rules. Margin of error (MOE): The MOE is a measure of the variability of the estimate due to sampling error. MOEs enable the data user to measure the range of uncertainty for each estimate with 90 percent confidence. The range of uncertainty is called the confidence interval, and it is calculated by taking the estimate +/- the MOE. For example, if the ACS reports an estimate of 100 with an MOE of +/- 20, then you can be 90 percent certain the value for the whole population falls between 80 and 120. Reliability: These symbols represent threshold values that Esri has established from the Coefficients of Variation (CV) to designate the usability of the estimates. The CV measures the amount of sampling error relative to the size of the estimate, expressed as a percentage. High Reliability: Small CVs (less than or equal to 12 percent) are flagged green to indicate that the sampling error is small relative to the estimate and the estimate is reasonably reliable. Medium Reliability: Estimates with CVs between 12 and 40 are flagged yellow-use with caution. Low Reliability: Large CVs (over 40 percent) are flagged red to indicate that the sampling error is large relative to the estimate. The estimate is considered very unreliable. Source: U.S. Census Bureau, 2018-2022 American Community Survey
Reliability:
high
medium
low
April 11, 2025 ©2025 Esri
Page 16 of 24
ACS Population Summary 2640 NE 8th St, Bend, Oregon, 97701 Ring band: 3 - 5 mile radius
Prepared by Esri Latitude: 44.07560 Longitude: -121.28971 2018-2022 ACS Estimate
Percent
MOE(±)
Reliability
TOTALS Total Population
38,165
1,424
Total Households
15,338
575
Total Housing Units
16,621
592
POPULATION AGE 3+ YEARS BY SCHOOL ENROLLMENT Total Enrolled in school Enrolled in nursery school, preschool Public school Private school Enrolled in kindergarten
37,076
100.0%
1,389
8,174
22.0%
601
662
1.8%
149
258 404
0.7% 1.1%
118 92
400
1.1%
109
Public school
333
0.9%
112
Private school
67
0.2%
34
2,027
5.5%
294
Public school
1,736
4.7%
295
Private school
291
0.8%
47
1,692
4.6%
284
Public school
1,542
4.2%
277
Private school
150
0.4%
63
1,771
4.8%
178
Public school
1,666
4.5%
175
Private school
105
0.3%
43
1,397
3.8%
151
Public school
1,115
3.0%
145
Private school
282
0.8%
68
226
0.6%
125
Public school
185
0.5%
122
Private school
41
0.1%
30
28,902
78.0%
809
Enrolled in grade 1 to grade 4
Enrolled in grade 5 to grade 8
Enrolled in grade 9 to grade 12
Enrolled in college undergraduate years
Enrolled in graduate or professional school
Not enrolled in school POPULATION AGE 65+ BY RELATIONSHIP AND HOUSEHOLD TYPE Total
7,305
100.0%
475
Living in Households
7,270
99.5%
475
Living in Family Households
5,592
76.6%
468
Householder
2,999
41.1%
264
Spouse
2,406
32.9%
220
Parent
126
1.7%
16
Parent-in-law
12
0.2%
21
Other Relative
37
0.5%
35
Nonrelative
12
0.2%
15
1,677
23.0%
142
Householder
1,508
20.6%
139
Nonrelative
169
2.3%
35
35
0.5%
4
Living in Nonfamily Households
Living in Group Quarters
Source: U.S. Census Bureau, 2018-2022 American Community Survey
Reliability:
high
medium
low
April 11, 2025 ©2025 Esri
Page 17 of 24
ACS Population Summary 2640 NE 8th St, Bend, Oregon, 97701 Ring band: 3 - 5 mile radius
Prepared by Esri Latitude: 44.07560 Longitude: -121.28971 2018-2022 ACS Estimate
Percent
MOE(±)
Reliability
HOUSEHOLDS BY TYPE AND SIZE Family Households
10,695
69.7%
523
2-Person
5,275
34.4%
313
3-Person
2,384
15.5%
453
4-Person
2,141
14.0%
201
5-Person
683
4.5%
179
6-Person
134
0.9%
49
7+ Person
79
0.5%
24
4,643
30.3%
348
1-Person
3,310
21.6%
310
2-Person
1,085
7.1%
185
3-Person
196
1.3%
84
4-Person
52
0.3%
35
5-Person
0
0.0%
0
6-Person
0 0
0.0% 0.0%
0 0
4,812
31.4%
444
4,786 3,626 588 572
31.2% 23.6% 3.8% 3.7%
444 268 333 113
26 10,526 5,259 650
0.2% 68.6% 34.3% 4.2%
52 447 306 123
4,617
30.1%
348
Households with Pop 65+ 1-Person
4,920 1,351
32.1% 8.8%
294 139
2+ Person Family 2+ Person Nonfamily Households with No Pop 65+ 1-Person 2+ Person Family 2+ Person Nonfamily
3,362 207 10,418 1,959 7,333 1,126
21.9% 1.3% 67.9% 12.8% 47.8% 7.3%
274 35 543 287 490 193
38,076
100.0%
1,424
31,642
83.1%
1,441
26,093
68.5%
1,105
25,754
67.6%
1,091
339
0.9%
89
2,318
6.1%
839
2,124
5.6%
837
194
0.5%
42
3,231
8.5%
615
Nonfamily Households
7+ Person HOUSEHOLDS BY PRESENCE OF PEOPLE UNDER 18 YEARS BY HOUSEHOLD TYPE
Households with one or more people under 18 years Family households Married-couple family Male householder, no wife present Female householder, no husband present Nonfamily households Households with no people under 18 years Married-couple family Other family Nonfamily households HOUSEHOLDS BY PRESENCE OF PEOPLE 65 YEARS AND OVER, HOUSEHOLD SIZE AND HOUSEHOLD TYPE
HOUSEHOLD TYPE BY RELATIVES AND NONRELATIVES FOR POPULATION IN HOUSEHOLDS Total In Family Households In Married-Couple Family Relatives Nonrelatives In Male Householder-No Spouse Present-Family Relatives Nonrelatives In Female Householder-No Spouse Present-Family Relatives
2,746
7.2%
513
Nonrelatives
485
1.3%
136
In Nonfamily Households
6,434
16.9%
472
Source: U.S. Census Bureau, 2018-2022 American Community Survey
Reliability:
high
medium
low
April 11, 2025 ©2025 Esri
Page 18 of 24
ACS Population Summary 2640 NE 8th St, Bend, Oregon, 97701 Ring band: 3 - 5 mile radius
Prepared by Esri Latitude: 44.07560 Longitude: -121.28971 2018-2022 ACS Estimate
Percent
MOE(±)
36,203
100.0%
1,349
5,714
15.8%
558
454 427
1.3% 1.2%
114 121
27 0
0.1% 0.0%
25 0
0 0
0.0% 0.0%
0 0
Speak English "not well"
0
0.0%
0
Speak English "not at all"
0
0.0%
0
Speak Asian and Pacific Island languages
113
0.3%
95
Speak English "very well" or "well"
Reliability
POPULATION AGE 5+ YEARS BY LANGUAGE SPOKEN AT HOME AND ABILITY TO SPEAK ENGLISH Total 5 to 17 years Speak only English Speak Spanish Speak English "very well" or "well" Speak English "not well" Speak English "not at all" Speak other Indo-European languages Speak English "very well" or "well"
113
0.3%
95
Speak English "not well"
0
0.0%
0
Speak English "not at all"
0
0.0%
0
0
0.0%
0
0 0
0.0% 0.0%
0 0
0
0.0%
0
20,401 1,194
56.4% 3.3%
920 163
1,114 80
3.1% 0.2%
159 56
Speak other languages Speak English "very well" or "well" Speak English "not well" Speak English "not at all" 18 to 64 years Speak only English Speak Spanish Speak English "very well" or "well" Speak English "not well"
1
0.0%
8
Speak other Indo-European languages
Speak English "not at all"
554
1.5%
265
Speak English "very well" or "well"
554
1.5%
265
0 0
0.0% 0.0%
0 0
Speak Asian and Pacific Island languages
464
1.3%
166
Speak English "very well" or "well"
389
1.1%
116
Speak English "not well"
75
0.2%
97
Speak English "not at all"
0
0.0%
0
4
0.0%
16
Speak English "very well" or "well"
4
0.0%
16
Speak English "not well"
0
0.0%
0
Speak English "not at all" 65 years and over
0
0.0%
0
6,921 175
19.1% 0.5%
467 48
Speak English "very well" or "well" Speak English "not well"
158 17
0.4% 0.0%
48 10
Speak English "not at all" Speak other Indo-European languages
0 150
0.0% 0.4%
0 48
Speak English "very well" or "well" Speak English "not well"
150 0
0.4% 0.0%
48 0
Speak English "not well" Speak English "not at all"
Speak other languages
Speak only English Speak Spanish
Speak English "not at all" Speak Asian and Pacific Island languages Speak English "very well" or "well" Speak English "not well" Speak English "not at all" Speak other languages Speak English "very well" or "well" Speak English "not well" Speak English "not at all"
Source: U.S. Census Bureau, 2018-2022 American Community Survey
0
0.0%
0
22 2
0.1% 0.0%
29 4
20 0
0.1% 0.0%
32 0
38 38
0.1% 0.1%
23 23
0 0
0.0% 0.0%
0 0
Reliability:
high
medium
low
April 11, 2025 ©2025 Esri
Page 19 of 24
ACS Population Summary 2640 NE 8th St, Bend, Oregon, 97701 Ring band: 3 - 5 mile radius
Prepared by Esri Latitude: 44.07560 Longitude: -121.28971 2018-2022 ACS Estimate
Percent
MOE(±)
18,696
100.0%
821
18,048
96.5%
809
Worked in state and outside county of residence
516
2.8%
141
Worked outside state of residence
133
0.7%
82
19,203
100.0%
849
9,946
51.8%
588
Employee of private company workers
6,620
34.5%
467
Self-employed in own incorporated business
1,017
5.3%
92
Private not-for-profit wage and salary workers
631
3.3%
344
Local government workers
636
3.3%
135
State government workers
67
0.3%
14
Federal government workers
117
0.6%
23
Self-employed in own not incorporated business workers
836
4.4%
133
Reliability
WORKERS AGE 16+ YEARS BY PLACE OF WORK Total Worked in state and in county of residence
SEX BY CLASS OF WORKER FOR THE CIVILIAN EMPLOYED POPULATION 16 YEARS AND OVER Total: Male:
Unpaid family workers Female: Employee of private company workers
22
0.1%
56
9,257
48.2%
431 354
5,131
26.7%
Self-employed in own incorporated business
693
3.6%
72
Private not-for-profit wage and salary workers
1,224
6.4%
202
Local government workers
847
4.4%
174
State government workers
314
1.6%
87
Federal government workers
47
0.2%
58
Self-employed in own not incorporated business workers
960
5.0%
114
Unpaid family workers
43
0.2%
56
38,076
100.0%
1,424
8,239
21.6%
617
8,239
21.6%
618
0
0.0%
0
22,567
59.3%
943
22,495
59.1%
943
72
0.2%
39
7,270
19.1%
475
Have a Computer
6,949
18.3%
479
Have NO Computer
321
0.8%
93
15,338
100.0%
575
14,631
95.4%
571
4
0.0%
8
13,337
87.0%
565
Satellite Service
676
4.4%
93
Other Service
126
0.8%
106
Internet Access with no Subscription
149
1.0%
60
With No Internet Access
558
3.6%
94
POPULATION IN HOUSEHOLDS AND PRESENCE OF A COMPUTER Total Population <18 in Households Have a Computer Have NO Computer Population 18-64 in Households Have a Computer Have NO Computer Population 65+ in Households
HOUSEHOLDS AND INTERNET SUBSCRIPTIONS Total With an Internet Subscription Dial-Up Alone Broadband
Source: U.S. Census Bureau, 2018-2022 American Community Survey
Reliability:
high
medium
low
April 11, 2025 ©2025 Esri
Page 20 of 24
ACS Population Summary 2640 NE 8th St, Bend, Oregon, 97701 Ring band: 3 - 5 mile radius
Prepared by Esri Latitude: 44.07560 Longitude: -121.28971 2018-2022 ACS Estimate
Percent
MOE(±)
Reliability
WORKERS AGE 16+ YEARS BY MEANS OF TRANSPORTATION TO WORK Total
18,696
100.0%
821
Drove alone
12,535
67.0%
742
Carpooled
1,587
8.5%
268
54
0.3%
65
Bus or trolley bus
44
0.2%
65
Light rail, streetcar or trolley
0
0.0%
0
Subway or elevated
0
0.0%
0
Long-distance/Commuter Train
11
0.1%
28
Ferryboat
0
Public transportation (excluding taxicab)
0
0.0%
Taxicab
0
0.0%
0
Motorcycle
12
0.1%
29
Bicycle
238
1.3%
51
Walked
215
1.1%
59
Other means
185
1.0%
47
3,871
20.7%
388
14,826
100.0%
732
523
3.5%
111
5 to 9 minutes
2,141
14.4%
200
10 to 14 minutes
3,263
22.0%
317
15 to 19 minutes
4,118
27.8%
475
20 to 24 minutes
1,640
11.1%
166
25 to 29 minutes
855
5.8%
127
30 to 34 minutes
1,245
8.4%
184
35 to 39 minutes
144
1.0%
88
40 to 44 minutes 45 to 59 minutes
222 330
1.5% 2.2%
103 101
60 to 89 minutes
148
1.0%
65
90 or more minutes
198
1.3%
105
Average Travel Time to Work (in minutes)
N/A
Worked at home WORKERS AGE 16+ YEARS (WHO DID NOT WORK FROM HOME) BY TRAVEL TIME TO WORK Total Less than 5 minutes
FEMALES AGE 20-64 YEARS BY AGE OF OWN CHILDREN AND EMPLOYMENT STATUS Total 11,051 Own children under 6 years only 894 In labor force 731 Not in labor force 163 Own children under 6 years and 6 to 17 years 842 In labor force 681 Not in labor force 161 Own children 6 to 17 years only 2,472 In labor force 2,073 Not in labor force 398 No own children under 18 years 6,842 In labor force 5,083 Not in labor force 1,759
Source: U.S. Census Bureau, 2018-2022 American Community Survey
N/A
100.0% 8.1% 6.6% 1.5% 7.6% 6.2% 1.5% 22.4% 18.8% 3.6% 61.9% 46.0% 15.9%
Reliability:
high
487 163 139 89 246 234 79 231 208 126 385 311 241
medium
low
April 11, 2025 ©2025 Esri
Page 21 of 24
ACS Population Summary 2640 NE 8th St, Bend, Oregon, 97701 Ring band: 3 - 5 mile radius
Prepared by Esri Latitude: 44.07560 Longitude: -121.28971 2018-2022 ACS Estimate
Percent
MOE(±)
38,127
100.0%
1,424
8,588
22.5%
624
7,655
20.1%
619
Employer-Based Health Ins Only
4,956
13.0%
578
Direct-Purchase Health Ins Only
872
2.3%
222
Medicare Coverage Only
122
0.3%
95
Medicaid Coverage Only
1,689
4.4%
230
TRICARE/Military Hlth Cov Only
15
0.0%
26
VA Health Care Only
0
0.0%
0
648
1.7%
137
Reliability
CIVILIAN NONINSTITUTIONALIZED POPULATION BY AGE & TYPES OF HEALTH INSURANCE COVERAGE Total Under 19 years: One Type of Health Insurance:
2+ Types of Health Insurance No Health Insurance Coverage 19 to 34 years: One Type of Health Insurance:
285
0.7%
70
5,994
15.7%
508
4,828
12.7%
441
Employer-Based Health Ins Only
3,123
8.2%
389
Direct-Purchase Health Ins Only
905
2.4%
106
Medicare Coverage Only
28
0.1%
27
Medicaid Coverage Only
733
1.9%
146
TRICARE/Military Hlth Cov Only
17
0.0%
29
VA Health Care Only
21
0.1%
38
2+ Types of Health Insurance
279
0.7%
97
No Health Insurance Coverage
888
2.3%
229
16,249
42.6%
773
13,722
36.0%
724
Employer-Based Health Ins Only
9,238
24.2%
647
Direct-Purchase Health Ins Only
2,658
7.0%
271
Medicare Coverage Only
273
0.7%
98
Medicaid Coverage Only
1,389
3.6%
294
TRICARE/Military Hlth Cov Only
59
0.2%
33
VA Health Care Only
106
0.3%
67
2+ Types of Health Insurance
1,243
3.3%
200
No Health Insurance Coverage
1,284
3.4%
142
65+ years:
7,296
19.1%
475
2,613
6.9%
194
Employer-Based Health Ins Only
66
0.2%
23
Direct-Purchase Health Ins Only
27
0.1%
36
2,519
6.6%
193
TRICARE/Military Hlth Cov Only
0
0.0%
0
VA Health Care Only
2
0.0%
19
4,679
12.3%
457
9
0.0%
36
Employer-Based Health & Medicare Insurance
912
2.4%
120
Direct-Purchase Health & Medicare Insurance
1,766
4.6%
313
301
0.8%
61
Other Private Health Insurance Combos
0
0.0%
0
Other Public Health Insurance Combos
94
0.2%
23
Other Health Insurance Combinations
1,598
4.2%
283
4
0.0%
15
35 to 64 years: One Type of Health Insurance:
One Type of Health Insurance:
Medicare Coverage Only
2+ Types of Health Insurance: Employer-Based & Direct-Purchase Health Insurance
Medicare & Medicaid Coverage
No Health Insurance Coverage
Source: U.S. Census Bureau, 2018-2022 American Community Survey
Reliability:
high
medium
low
April 11, 2025 ©2025 Esri
Page 22 of 24
ACS Population Summary 2640 NE 8th St, Bend, Oregon, 97701 Ring band: 3 - 5 mile radius
Prepared by Esri Latitude: 44.07560 Longitude: -121.28971 2018-2022 ACS Estimate
Percent
MOE(±)
Reliability
POPULATION BY RATIO OF INCOME TO POVERTY LEVEL Total
38,101
100.0%
1,424
Under .50
1,324
3.5%
249
.50 to .99
1,470
3.9%
320
1.00 to 1.24
840
2.2%
140
1.25 to 1.49
876
2.3%
271
1.50 to 1.84
1,351
3.5%
193
1.85 to 1.99
761 31,479
2.0%
189
82.6%
1,384
2.00 and over CIVILIAN POPULATION AGE 18 OR OLDER BY VETERAN STATUS Total
29,922
100.0%
1,002
Veteran
2,122
7.1%
213
Nonveteran
27,800
92.9%
982
15,007
50.2%
617
Veteran
2,029
6.8%
207
Nonveteran
12,978
43.4%
607
14,915
49.8%
544
93
0.3%
38
14,822
49.5%
541
Male
Female Veteran Nonveteran CIVILIAN VETERANS AGE 18 OR OLDER BY PERIOD OF MILITARY SERVICE Total
2,122
100.0%
213
Gulf War (9/01 or later), no Gulf War (8/90 to 8/01), no Vietnam Era
220
10.4%
105
Gulf War (9/01 or later) and Gulf War (8/90 to 8/01), no Vietnam Era
126
5.9%
45
Gulf War (9/01 or later), and Gulf War (8/90 to 8/01), and Vietnam Era
0
0.0%
0
219
10.3%
58
Gulf War (8/90 to 8/01), no Vietnam Era Gulf War (8/90 to 8/01) and Vietnam Era
30
1.4%
31
Vietnam Era, no Korean War, no World War II
895
42.2%
168
Vietnam Era and Korean War, no World War II
0
0.0%
0
Vietnam Era and Korean War and World War II
0
0.0%
0
Korean War, no Vietnam Era, no World War II
125
5.9%
57
Korean War and World War II, no Vietnam Era
0
0.0%
0
World War II, no Korean War, no Vietnam Era
24
1.1%
18
Between Gulf War and Vietnam Era only
297
14.0%
52
Between Vietnam Era and Korean War only
187
8.8%
37
Between Korean War and World War II only
0
0.0%
0
Pre-World War II only
0
0.0%
0
15,338
100.0%
575
1,161
7.6%
158
Married-couple family
252
1.6%
132
Other family - male householder (no wife present)
38
0.2%
53
Other family - female householder (no husband present)
148
1.0%
61
Nonfamily household - male householder
466
3.0%
89
Nonfamily household - female householder
257
1.7%
43
14,177
92.4%
581
HOUSEHOLDS BY POVERTY STATUS Total Income in the past 12 months below poverty level
Income in the past 12 months at or above poverty level Married-couple family
8,633
56.3%
379
Other family - male householder (no wife present)
793
5.2%
333
Other family - female householder (no husband present)
831
5.4%
150
Nonfamily household - male householder
1,891
12.3%
284
Nonfamily household - female householder
2,029
13.2%
203
Poverty Index Source: U.S. Census Bureau, 2018-2022 American Community Survey
61
Reliability:
high
medium
low
April 11, 2025 ©2025 Esri
Page 23 of 24
ACS Population Summary 2640 NE 8th St, Bend, Oregon, 97701 Ring band: 3 - 5 mile radius
Prepared by Esri Latitude: 44.07560 Longitude: -121.28971 2018-2022 ACS Estimate
Percent
MOE(±)
Social Security Income
4,492
29.3%
291
No Social Security Income
10,846
70.7%
528
Retirement Income
3,969
25.9%
273
No Retirement Income
11,369
74.1%
576
39
Reliability
HOUSEHOLDS BY OTHER INCOME
GROSS RENT AS A PERCENTAGE OF HOUSEHOLD INCOME IN THE PAST 12 MONTHS <10% of Income
60
1.5%
10-14.9% of Income
396
9.8%
98
15-19.9% of Income
304
7.5%
113
20-24.9% of Income
638
15.8%
200
25-29.9% of Income
791
19.6%
265
30-34.9% of Income
494
12.2%
175
35-39.9% of Income
126
3.1%
43
40-49.9% of Income
123
3.0%
40
50+% of Income
937
23.2%
140
Gross Rent % Inc Not Computed
175
4.3%
27
15,338
HOUSEHOLDS BY PUBLIC ASSISTANCE INCOME IN THE PAST 12 MONTHS Total With public assistance income No public assistance income
170 15,168
100.0% 1.1% 98.9%
575 34 575
HOUSEHOLDS BY FOOD STAMPS/SNAP STATUS Total With Food Stamps/SNAP With No Food Stamps/SNAP
15,338 896 14,442
100.0% 5.8% 94.2%
575 171 586
HOUSEHOLDS BY DISABILITY STATUS Total With 1+ Persons w/Disability With No Person w/Disability
15,338 2,757 12,581
100.0% 18.0% 82.0%
575 266 595
Data Note: N/A means not available. Population by Ratio of Income to Poverty Level represents persons for whom poverty status is determined. Household income represents income in 2022, adjusted for inflation. 2018-2022 ACS Estimate: The American Community Survey (ACS) replaces census sample data. Esri is releasing the 2018-2022 ACS estimates, five-year period data collected monthly from January 1, 2018 through December 31, 2022. Although the ACS includes many of the subjects previously covered by the decennial census sample, there are significant differences between the two surveys including fundamental differences in survey design and residency rules. Margin of error (MOE): The MOE is a measure of the variability of the estimate due to sampling error. MOEs enable the data user to measure the range of uncertainty for each estimate with 90 percent confidence. The range of uncertainty is called the confidence interval, and it is calculated by taking the estimate +/- the MOE. For example, if the ACS reports an estimate of 100 with an MOE of +/- 20, then you can be 90 percent certain the value for the whole population falls between 80 and 120. Reliability: These symbols represent threshold values that Esri has established from the Coefficients of Variation (CV) to designate the usability of the estimates. The CV measures the amount of sampling error relative to the size of the estimate, expressed as a percentage. High Reliability: Small CVs (less than or equal to 12 percent) are flagged green to indicate that the sampling error is small relative to the estimate and the estimate is reasonably reliable. Medium Reliability: Estimates with CVs between 12 and 40 are flagged yellow-use with caution. Low Reliability: Large CVs (over 40 percent) are flagged red to indicate that the sampling error is large relative to the estimate. The estimate is considered very unreliable. Source: U.S. Census Bureau, 2018-2022 American Community Survey
Reliability:
high
medium
low
April 11, 2025 ©2025 Esri
Page 24 of 24
Market Profile 2640 NE 8th St, Bend, Oregon, 97701 Ring bands: 0-1, 1-3, 3-5 mile radii
Population Summary 2010 Total Population 2020 Total Population 2020 Group Quarters 2024 Total Population 2024 Group Quarters 2029 Total Population 2024-2029 Annual Rate 2024 Total Daytime Population Workers Residents Household Summary 2010 Households 2010 Average Household Size 2020 Total Households 2020 Average Household Size 2024 Households 2024 Average Household Size 2029 Households 2029 Average Household Size 2024-2029 Annual Rate 2010 Families 2010 Average Family Size 2024 Families 2024 Average Family Size 2029 Families 2029 Average Family Size 2024-2029 Annual Rate Housing Unit Summary 2000 Housing Units Owner Occupied Housing Units Renter Occupied Housing Units Vacant Housing Units 2010 Housing Units Owner Occupied Housing Units Renter Occupied Housing Units Vacant Housing Units 2020 Housing Units Owner Occupied Housing Units Renter Occupied Housing Units Vacant Housing Units 2024 Housing Units Owner Occupied Housing Units Renter Occupied Housing Units Vacant Housing Units 2029 Housing Units Owner Occupied Housing Units Renter Occupied Housing Units Vacant Housing Units
Prepared by Esri Latitude: 44.07560 Longitude: -121.28971
0 - 1 mile
1 - 3 mile
3 - 5 mile
9,147 11,327 59 12,438 60 13,539 1.71% 12,608 7,055 5,553
43,894 54,932 750 60,202 754 64,751 1.47% 78,507 50,329 28,178
27,472 37,794 473 41,021 464 44,007 1.42% 33,485 12,868 20,617
3,850 2.36 4,823 2.34 5,353 2.31 5,867 2.30 1.85% 2,226 2.92 2,842 2.98 3,087 2.98 1.67%
18,648 2.32 23,208 2.33 25,576 2.32 27,732 2.31 1.63% 11,020 2.87 14,773 2.89 15,865 2.88 1.44%
10,669 2.57 14,543 2.57 15,893 2.55 17,194 2.53 1.59% 7,643 2.96 10,918 2.95 11,734 2.93 1.45%
3,439 55.6% 40.3% 4.2% 4,176 44.9% 47.4% 7.8% 5,041 46.8% 48.9% 5.2% 5,614 48.3% 47.0% 4.6% 6,134 50.8% 44.9% 4.4%
14,008 54.8% 39.3% 5.9% 21,043 47.2% 41.4% 11.4% 25,257 51.8% 40.1% 7.8% 27,413 53.9% 39.4% 6.7% 29,578 54.5% 39.2% 6.2%
6,694 76.5% 16.0% 7.4% 12,307 63.5% 23.2% 13.3% 15,914 68.1% 23.3% 9.0% 17,219 70.4% 21.9% 7.7% 18,530 70.4% 22.4% 7.2%
Data Note: Household population includes persons not residing in group quarters. Average Household Size is the household population divided by total households. Persons in families include the householder and persons related to the householder by birth, marriage, or adoption. Per Capita Income represents the income received by all persons aged 15 years and over divided by the total population. Source: Esri forecasts for 2024 and 2029. U.S. Census Bureau 2000 and 2010 decennial Census data converted by Esri into 2020 geography.
April 11, 2025 ©2025 Esri
Page 1 of 8
Market Profile 2640 NE 8th St, Bend, Oregon, 97701 Ring bands: 0-1, 1-3, 3-5 mile radii
2024 Households by Income Household Income Base <$15,000 $15,000 - $24,999 $25,000 - $34,999 $35,000 - $49,999 $50,000 - $74,999 $75,000 - $99,999 $100,000 - $149,999 $150,000 - $199,999 $200,000+ Average Household Income 2029 Households by Income Household Income Base <$15,000 $15,000 - $24,999 $25,000 - $34,999 $35,000 - $49,999 $50,000 - $74,999 $75,000 - $99,999 $100,000 - $149,999 $150,000 - $199,999 $200,000+ Average Household Income 2024 Owner Occupied Housing Units by Value Total <$50,000 $50,000 - $99,999 $100,000 - $149,999 $150,000 - $199,999 $200,000 - $249,999 $250,000 - $299,999 $300,000 - $399,999 $400,000 - $499,999 $500,000 - $749,999 $750,000 - $999,999 $1,000,000 - $1,499,999 $1,500,000 - $1,999,999 $2,000,000 + Average Home Value 2029 Owner Occupied Housing Units by Value Total <$50,000 $50,000 - $99,999 $100,000 - $149,999 $150,000 - $199,999 $200,000 - $249,999 $250,000 - $299,999 $300,000 - $399,999 $400,000 - $499,999 $500,000 - $749,999 $750,000 - $999,999 $1,000,000 - $1,499,999 $1,500,000 - $1,999,999 $2,000,000 + Average Home Value
Prepared by Esri Latitude: 44.07560 Longitude: -121.28971
0 - 1 mile
1 - 3 mile
3 - 5 mile
5,353 6.6% 4.8% 4.7% 10.3% 25.1% 13.3% 16.8% 9.8% 8.4% $101,253
25,576 5.4% 4.3% 4.7% 10.3% 18.2% 12.4% 15.0% 12.8% 16.9% $133,021
15,893 3.4% 2.0% 3.4% 8.7% 18.6% 10.8% 15.2% 12.9% 25.0% $162,368
5,867 5.3% 3.7% 3.4% 8.5% 22.3% 13.1% 19.9% 12.6% 11.3% $120,376
27,732 4.3% 3.3% 3.7% 8.8% 15.9% 11.7% 15.9% 15.8% 20.6% $155,048
17,194 2.6% 1.5% 2.4% 7.1% 15.3% 9.5% 16.2% 15.7% 29.6% $187,891
2,714 1.1% 0.1% 0.4% 0.1% 0.8% 0.6% 3.3% 13.4% 52.4% 24.3% 2.4% 0.9% 0.3% $668,018
14,778 1.3% 1.1% 0.7% 0.2% 0.7% 0.9% 2.4% 8.1% 43.3% 20.6% 12.4% 6.2% 2.2% $814,556
12,121 1.3% 0.8% 0.1% 0.0% 0.0% 0.2% 1.1% 6.4% 41.3% 22.9% 16.1% 6.6% 3.2% $882,788
3,114 0.4% 0.0% 0.0% 0.0% 0.0% 0.0% 0.5% 6.6% 53.1% 33.6% 3.9% 1.6% 0.3% $740,559
16,129 0.4% 0.2% 0.0% 0.0% 0.0% 0.2% 0.5% 4.4% 41.8% 22.5% 18.3% 9.4% 2.2% $923,166
13,049 0.3% 0.1% 0.0% 0.0% 0.0% 0.0% 0.1% 3.1% 34.6% 25.5% 22.6% 10.7% 2.9% $989,825
Data Note: Income represents the preceding year, expressed in current dollars. Household income includes wage and salary earnings, interest dividends, net rents, pensions, SSI and welfare payments, child support, and alimony. Source: Esri forecasts for 2024 and 2029. U.S. Census Bureau 2000 and 2010 decennial Census data converted by Esri into 2020 geography.
April 11, 2025 ©2025 Esri
Page 2 of 8
Market Profile 2640 NE 8th St, Bend, Oregon, 97701 Ring bands: 0-1, 1-3, 3-5 mile radii
Median Household Income 2024 2029 Median Home Value 2024 2029 Per Capita Income 2024 2029 Median Age 2010 2020 2024 2029 2020 Population by Age Total 0-4 5-9 10 - 14 15 - 24 25 - 34 35 - 44 45 - 54 55 - 64 65 - 74 75 - 84 85 + 18 + 2024 Population by Age Total 0-4 5-9 10 - 14 15 - 24 25 - 34 35 - 44 45 - 54 55 - 64 65 - 74 75 - 84 85 + 18 + 2029 Population by Age Total 0-4 5-9 10 - 14 15 - 24 25 - 34 35 - 44 45 - 54 55 - 64 65 - 74 75 - 84 85 + 18 +
Prepared by Esri Latitude: 44.07560 Longitude: -121.28971
0 - 1 mile
1 - 3 mile
3 - 5 mile
$72,689 $86,442
$87,696 $105,323
$107,376 $131,774
$644,441 $700,061
$700,168 $776,803
$743,129 $865,284
$43,994 $52,719
$55,989 $65,791
$63,772 $74,402
34.0 36.1 37.1 39.2
36.1 38.8 39.7 41.2
39.6 42.8 43.1 44.5
11,327 5.7% 5.4% 5.5% 12.2% 19.0% 16.9% 11.7% 10.0% 8.5% 3.7% 1.2% 80.1%
54,932 5.0% 5.5% 6.1% 11.8% 15.6% 15.0% 12.3% 11.3% 10.4% 5.0% 2.0% 79.7%
37,794 4.8% 6.4% 7.2% 10.4% 10.3% 14.2% 14.0% 12.6% 12.7% 5.6% 1.8% 77.4%
12,437 5.5% 5.5% 4.9% 11.4% 19.1% 16.9% 12.8% 9.3% 8.5% 4.6% 1.4% 81.2%
60,200 4.9% 5.2% 5.4% 11.9% 15.5% 15.3% 12.9% 10.3% 10.3% 6.1% 2.1% 81.0%
41,019 4.8% 5.7% 6.4% 11.8% 10.3% 13.8% 14.2% 11.8% 12.1% 7.1% 1.9% 79.1%
13,539 5.2% 5.1% 5.2% 10.4% 16.1% 17.8% 14.0% 9.8% 8.6% 5.8% 1.9% 81.7%
64,753 4.7% 4.9% 5.3% 11.2% 14.6% 15.0% 13.6% 10.8% 9.9% 7.5% 2.5% 81.9%
44,008 4.7% 5.1% 5.8% 11.5% 11.0% 12.6% 14.1% 12.6% 11.3% 8.9% 2.5% 80.6%
Source: Esri forecasts for 2024 and 2029. U.S. Census Bureau 2000 and 2010 decennial Census data converted by Esri into 2020 geography.
April 11, 2025 ©2025 Esri
Page 3 of 8
Market Profile 2640 NE 8th St, Bend, Oregon, 97701 Ring bands: 0-1, 1-3, 3-5 mile radii
Prepared by Esri Latitude: 44.07560 Longitude: -121.28971
0 - 1 mile
1 - 3 mile
3 - 5 mile
2020 Population by Sex Males Females
5,629 5,698
26,993 27,939
18,683 19,111
2024 Population by Sex Males Females
6,278 6,160
30,089 30,113
20,547 20,474
2029 Population by Sex Males Females
6,772 6,767
32,201 32,549
21,875 22,131
9,146 89.7% 0.5% 1.1% 1.0% 0.1% 4.6% 3.0% 10.6% 34.6
43,893 91.6% 0.5% 0.9% 1.2% 0.2% 3.1% 2.6% 7.8% 28.0
27,471 92.1% 0.4% 0.7% 1.2% 0.1% 3.0% 2.5% 7.2% 26.5
11,327 83.1% 0.5% 0.8% 1.2% 0.2% 4.0% 10.1% 10.7% 43.1
54,932 84.8% 0.6% 0.6% 1.6% 0.1% 3.1% 9.1% 8.7% 38.8
37,794 85.1% 0.4% 0.6% 1.6% 0.1% 4.0% 8.2% 8.9% 38.6
12,438 81.9% 0.5% 0.8% 1.4% 0.3% 4.3% 10.8% 11.5% 45.5
60,203 83.7% 0.6% 0.6% 1.9% 0.2% 3.3% 9.8% 9.4% 41.0
41,022 83.9% 0.4% 0.6% 1.8% 0.1% 4.3% 8.8% 9.6% 41.0
13,539 80.5% 0.6% 0.8% 1.5% 0.3% 4.6% 11.6% 12.4% 48.0
64,751 82.4% 0.7% 0.6% 2.1% 0.2% 3.6% 10.5% 10.2% 43.5
44,007 82.7% 0.4% 0.6% 2.0% 0.1% 4.6% 9.5% 10.4% 43.4
2010 Population by Race/Ethnicity Total White Alone Black Alone American Indian Alone Asian Alone Pacific Islander Alone Some Other Race Alone Two or More Races Hispanic Origin Diversity Index 2020 Population by Race/Ethnicity Total White Alone Black Alone American Indian Alone Asian Alone Pacific Islander Alone Some Other Race Alone Two or More Races Hispanic Origin Diversity Index 2024 Population by Race/Ethnicity Total White Alone Black Alone American Indian Alone Asian Alone Pacific Islander Alone Some Other Race Alone Two or More Races Hispanic Origin Diversity Index 2029 Population by Race/Ethnicity Total White Alone Black Alone American Indian Alone Asian Alone Pacific Islander Alone Some Other Race Alone Two or More Races Hispanic Origin Diversity Index
Data Note: Persons of Hispanic Origin may be of any race. The Diversity Index measures the probability that two people from the same area will be from different race/ethnic groups. Source: Esri forecasts for 2024 and 2029. U.S. Census Bureau 2000 and 2010 decennial Census data converted by Esri into 2020 geography.
April 11, 2025 ©2025 Esri
Page 4 of 8
Market Profile 2640 NE 8th St, Bend, Oregon, 97701 Ring bands: 0-1, 1-3, 3-5 mile radii
2020 Population by Relationship and Household Type Total In Households Householder Opposite-Sex Spouse Same-Sex Spouse Opposite-Sex Unmarried Partner Same-Sex Unmarried Partner Biological Child Adopted Child Stepchild Grandchild Brother or Sister Parent Parent-in-law Son-in-law or Daughter-in-law Other Relatives Foster Child Other Nonrelatives In Group Quarters Institutionalized Noninstitutionalized 2024 Population 25+ by Educational Attainment Total Less than 9th Grade 9th - 12th Grade, No Diploma High School Graduate GED/Alternative Credential Some College, No Degree Associate Degree Bachelor's Degree Graduate/Professional Degree 2024 Population 15+ by Marital Status Total Never Married Married Widowed Divorced 2024 Civilian Population 16+ in Labor Force Civilian Population 16+ Population 16+ Employed Population 16+ Unemployment rate Population 16-24 Employed Population 16-24 Unemployment rate Population 25-54 Employed Population 25-54 Unemployment rate Population 55-64 Employed Population 55-64 Unemployment rate Population 65+ Employed Population 65+ Unemployment rate
Prepared by Esri Latitude: 44.07560 Longitude: -121.28971
0 - 1 mile
1 - 3 mile
3 - 5 mile
11,327 99.5% 43.2% 16.8% 0.3% 4.7% 0.2% 22.0% 0.6% 1.0% 1.0% 1.0% 0.8% 0.2% 0.2% 0.7% 0.1% 6.8% 0.5% 0.0% 0.5%
54,932 98.6% 41.8% 18.9% 0.2% 4.0% 0.2% 22.9% 0.6% 0.9% 0.9% 0.8% 0.6% 0.2% 0.2% 0.7% 0.1% 5.6% 1.4% 0.8% 0.6%
37,794 98.7% 39.0% 22.7% 0.2% 2.6% 0.1% 25.9% 0.7% 0.8% 0.9% 0.6% 0.6% 0.2% 0.3% 0.5% 0.1% 3.6% 1.3% 0.9% 0.4%
9,040 1.5% 2.1% 15.6% 3.7% 16.1% 14.8% 25.9% 20.3%
43,652 2.1% 2.4% 12.2% 3.4% 19.8% 11.3% 29.9% 18.9%
29,227 1.2% 1.5% 13.3% 2.6% 19.7% 8.8% 31.2% 21.6%
10,456 37.3% 42.3% 3.6% 16.7%
50,837 34.0% 47.5% 4.4% 14.0%
34,082 25.9% 60.4% 3.1% 10.6%
7,258 95.9% 4.1% 11.8% 6.3% 74.1% 3.7% 9.7% 0.3% 4.5% 10.6%
33,349 97.1% 2.9% 13.3% 7.0% 68.1% 1.9% 12.0% 2.5% 6.6% 5.8%
21,302 97.0% 3.0% 14.7% 4.4% 63.9% 1.6% 13.1% 5.6% 8.3% 6.5%
Source: Esri forecasts for 2024 and 2029. U.S. Census Bureau 2000 and 2010 decennial Census data converted by Esri into 2020 geography.
April 11, 2025 ©2025 Esri
Page 5 of 8
Market Profile 2640 NE 8th St, Bend, Oregon, 97701 Ring bands: 0-1, 1-3, 3-5 mile radii
2024 Employed Population 16+ by Industry Total Agriculture/Mining Construction Manufacturing Wholesale Trade Retail Trade Transportation/Utilities Information Finance/Insurance/Real Estate Services Public Administration 2024 Employed Population 16+ by Occupation Total White Collar Management/Business/Financial Professional Sales Administrative Support Services Blue Collar Farming/Forestry/Fishing Construction/Extraction Installation/Maintenance/Repair Production Transportation/Material Moving 2020 Households by Type Total Married Couple Households With Own Children <18 Without Own Children <18 Cohabitating Couple Households With Own Children <18 Without Own Children <18 Male Householder, No Spouse/Partner Living Alone 65 Years and over With Own Children <18 Without Own Children <18, With Relatives No Relatives Present Female Householder, No Spouse/Partner Living Alone 65 Years and over With Own Children <18 Without Own Children <18, With Relatives No Relatives Present 2020 Households by Size Total 1 Person Household 2 Person Household 3 Person Household 4 Person Household 5 Person Household 6 Person Household 7 + Person Household
Prepared by Esri Latitude: 44.07560 Longitude: -121.28971
0 - 1 mile
1 - 3 mile
3 - 5 mile
6,964 1.5% 15.1% 6.2% 2.4% 16.4% 1.3% 1.9% 4.0% 47.0% 4.4%
32,379 0.9% 7.1% 8.3% 1.9% 12.3% 2.2% 1.5% 6.0% 56.1% 3.7%
20,672 1.1% 7.1% 6.7% 2.1% 11.2% 2.9% 2.4% 7.2% 56.4% 3.0%
6,968 65.2% 17.2% 29.5% 12.6% 5.9% 18.5% 16.3% 0.7% 9.6% 1.7% 0.9% 3.6%
32,381 68.1% 18.5% 29.7% 10.4% 9.6% 17.8% 14.1% 0.5% 4.2% 2.4% 3.2% 3.9%
20,674 67.7% 21.4% 30.2% 8.5% 7.6% 18.4% 14.0% 0.1% 4.3% 1.9% 3.6% 4.1%
4,823 39.3% 16.1% 23.2% 11.5% 1.9% 9.6% 21.3% 13.2% 3.5% 2.0% 2.3% 3.8% 27.8% 16.0% 6.8% 4.6% 4.3% 3.0%
23,208 45.7% 17.6% 28.2% 9.8% 2.2% 7.5% 18.0% 11.6% 3.5% 1.6% 1.9% 2.9% 26.4% 16.2% 8.8% 4.1% 3.7% 2.4%
14,543 58.8% 23.1% 35.7% 6.9% 1.7% 5.2% 14.2% 8.9% 3.3% 1.5% 1.7% 2.1% 20.1% 12.0% 6.5% 3.4% 3.1% 1.6%
4,823 29.2% 38.0% 15.3% 11.3% 4.2% 1.3% 0.7%
23,208 27.9% 37.8% 15.6% 12.5% 4.3% 1.3% 0.6%
14,543 20.8% 39.9% 15.2% 15.2% 6.1% 1.9% 0.8%
Source: Esri forecasts for 2024 and 2029. U.S. Census Bureau 2000 and 2010 decennial Census data converted by Esri into 2020 geography.
April 11, 2025 ©2025 Esri
Page 6 of 8
Market Profile 2640 NE 8th St, Bend, Oregon, 97701 Ring bands: 0-1, 1-3, 3-5 mile radii
2020 Households by Tenure and Mortgage Status Total Owner Occupied Owned with a Mortgage/Loan Owned Free and Clear Renter Occupied 2024 Affordability, Mortgage and Wealth Housing Affordability Index Percent of Income for Mortgage Wealth Index 2020 Housing Units By Urban/ Rural Status Total Urban Housing Units Rural Housing Units 2020 Population By Urban/ Rural Status Total Urban Population Rural Population
Prepared by Esri Latitude: 44.07560 Longitude: -121.28971
0 - 1 mile
1 - 3 mile
3 - 5 mile
4,823 48.9% 37.1% 11.8% 51.1%
23,208 56.4% 40.7% 15.7% 43.6%
14,543 74.5% 51.8% 22.7% 25.5%
46 55.5% 73
51 50.0% 120
59 43.3% 169
5,041 99.8% 0.2%
25,257 96.3% 3.7%
15,914 90.4% 9.6%
11,327 99.7% 0.3%
54,932 95.6% 4.4%
37,794 89.6% 10.4%
Data Note: Households with children include any households with people under age 18, related or not. Multigenerational households are families with 3 or more parent-child relationships. Unmarried partner households are usually classified as nonfamily households unless there is another member of the household related to the householder. Multigenerational and unmarried partner households are reported only to the tract level. Esri estimated block group data, which is used to estimate polygons or non-standard geography. Source: Esri forecasts for 2024 and 2029. U.S. Census Bureau 2000 and 2010 decennial Census data converted by Esri into 2020 geography.
April 11, 2025 ©2025 Esri
Page 7 of 8
Market Profile 2640 NE 8th St, Bend, Oregon, 97701 Ring bands: 0-1, 1-3, 3-5 mile radii
Prepared by Esri Latitude: 44.07560 Longitude: -121.28971
0 - 1 mile Top 3 Tapestry Segments 1. 2. 3.
Bright Young Professionals Front Porches (8E) Old and Newcomers (8F)
2024 Consumer Spending Apparel & Services: Total $ Average Spent Spending Potential Index Education: Total $ Average Spent Spending Potential Index Entertainment/Recreation: Total $ Average Spent Spending Potential Index Food at Home: Total $ Average Spent Spending Potential Index Food Away from Home: Total $ Average Spent Spending Potential Index Health Care: Total $ Average Spent Spending Potential Index HH Furnishings & Equipment: Total $ Average Spent Spending Potential Index Personal Care Products & Services: Total $ Average Spent Spending Potential Index Shelter: Total $ Average Spent Spending Potential Index Support Payments/Cash Contributions/Gifts in Kind: Total $ Average Spent Spending Potential Index Travel: Total $ Average Spent Spending Potential Index Vehicle Maintenance & Repairs: Total $ Average Spent Spending Potential Index
1 - 3 mile
3 - 5 mile
Bright Young Professionals Middleburg (4C) Old and Newcomers (8F)
In Style (5B) Middleburg (4C) Bright Young Professionals
$11,726,866 $2,190.71 92 $8,207,239 $1,533.20 89 $19,566,580 $3,655.25 89 $35,098,723 $6,556.83 90 $19,340,375 $3,613.00 93 $35,724,155 $6,673.67 87 $15,291,802 $2,856.68 90 $4,908,930 $917.04 92 $129,737,888 $24,236.48 91 $16,460,987 $3,075.10 88 $14,519,364 $2,712.38 89 $7,239,002 $1,352.33 91
$71,509,078 $2,795.94 117 $53,637,657 $2,097.19 121 $122,084,347 $4,773.39 117 $216,663,388 $8,471.36 116 $119,195,978 $4,660.46 120 $221,580,134 $8,663.60 113 $94,261,873 $3,685.56 116 $30,553,493 $1,194.62 120 $812,931,712 $31,784.94 119 $102,863,040 $4,021.86 115 $92,171,977 $3,603.85 119 $43,838,328 $1,714.04 116
$51,665,430 $3,250.83 136 $40,505,665 $2,548.65 147 $93,142,320 $5,860.59 143 $158,813,466 $9,992.67 137 $87,995,559 $5,536.75 142 $167,831,314 $10,560.08 137 $71,029,942 $4,469.26 141 $22,578,734 $1,420.67 143 $610,369,202 $38,404.91 144 $81,311,265 $5,116.17 146 $71,029,419 $4,469.23 147 $32,569,712 $2,049.31 138
Data Note: Consumer spending shows the amount spent on a variety of goods and services by households that reside in the area. Expenditures are shown by broad budget categories that are not mutually exclusive. Consumer spending does not equal business revenue. Total and Average Amount Spent Per Household represent annual figures. The Spending Potential Index represents the amount spent in the area relative to a national average of 100. Source: Consumer Spending data are derived from the 2019 and 2020 Consumer Expenditure Surveys, Bureau of Labor Statistics. Esri. Source: Esri forecasts for 2024 and 2029. U.S. Census Bureau 2000 and 2010 decennial Census data converted by Esri into 2020 geography.
April 11, 2025 ©2025 Esri
Page 8 of 8
Traffic Count Map 2640 NE 8th St, Bend, Oregon, 97701 Ring bands: 0-1, 1-3, 3-5 mile radii
0
0.8
Prepared by Esri Latitude: 44.07560 Longitude: -121.28971
1.6
mi
Source: ©2024 Kalibrate Technologies (Q4 2024).
April 11, 2025 ©2025 Esri
Page 1 of 1
Left blank intentionally
City of Bend Development Code-RS
Ch. 2.1 Residential Districts (UAR, RL, RS, RM-10, RM, RH) | Bend Development Code
Page 1 of 24
Chapter 2.1 RESIDENTIAL DISTRICTS (UAR, RL, RS, RM-10, RM, RH) Sections:
2.1.100
Purpose, Applicability and Location.
2.1.200
Permitted and Conditional Uses.
2.1.300
Setbacks.
2.1.400
Repealed.
2.1.500
Lot Area and Dimensions.
2.1.600
Residential Density.
2.1.700
Maximum Lot Coverage and Floor Area Ratio.
2.1.800
Building Height.
2.1.900
Architectural Design Standards.
2.1.950
Design Standards (Triplex, Quadplex and Townhome).
2.1.1000
Multi-Unit Residential Districts (RM, RH).
2.1.1100
Other Design Standards.
2.1.100 A.
Purpose, Applicability and Location.
Purpose. Residential Districts are intended to promote the livability, stability, safety and improvement of the
City of Bend’s neighborhoods based on the following principles: •
Make efficient use of land and public services, and implement the Comprehensive Plan, by providing
minimum and maximum density standards for housing. •
Accommodate a range of housing needs, including owner-occupied and rental housing.
•
Provide for compatible building and site design at an appropriate neighborhood scale which reflects the
neighborhood character. •
Reduce reliance on the automobile for neighborhood travel and provide options for walking and
bicycling. • B.
Provide direct and convenient access to schools, parks and neighborhood services.
Applicability. This chapter applies to all development in the Urban Area Reserve District (UAR), Low Density
Residential District (RL), Standard Density Residential District (RS), Medium-10 Density Residential District (RM-10), Medium Density Residential District (RM), and High Density Residential District (RH). These districts are identified on the City’s official Zoning Map. Properties designated within each district that contain additional standards must
The Bend Development Code is current through Ordinance NS-2471, passed April 19, 2023.
Ch. 2.1 Residential Districts (UAR, RL, RS, RM-10, RM, RH) | Bend Development Code
Page 2 of 24
comply with the provisions of the applicable district, except as may be modified by this section. Properties within a designated Historic District must comply with the provisions of BC Chapter 10.20. Table 2.1.100. Zone District
Zone District Characteristics Location and Characteristics
Urban Area Reserve
The Urban Area Reserve District is a holding zone for urban development. The
(UAR)
maximum residential density for the district is 1 dwelling unit per 10 gross acres.
Low Density
The Low Density Residential District consists of large urban residential lots that are
Residential (RL)
served with a community water system and DEQ permitted community sewer, private on-site septic systems, or municipal sewer systems. The residential density range in this district is 1.1 to 4.0 dwelling units per gross acre.
Standard Density
The Standard Density Residential District is intended to provide opportunities for a
Residential (RS)
wide variety of residential housing types at the most common residential densities in places where community sewer and water services are available. The residential density range in this district is 4.0 to 7.3 dwelling units per gross acre.
Medium-10 Density
The Medium-10 Density Residential District is intended to provide opportunities
Residential (RM-10)
for manufactured home park development and a variety of single- and multi-unit residential housing types. The density range in this district is 6.0 to 10.0 dwelling units per gross acre.
Medium Density
The Medium Density Residential District is intended to provide primarily for the
Residential (RM)
development of multi-unit residential in areas where sewer and water service are available. The residential density range in the district is 7.3 to 21.7 units per gross acre and must provide a transitional use area between other Residential Districts and other less restrictive areas.
High Density
The High Density Residential District is intended to provide land for primarily high
Residential (RH)
density multi-unit residential in locations close to shopping and services, transportation and public open space. The density range of the district is 21.7 to 43.0 units per gross acre and must provide a transitional use area between other Residential Districts and other less restrictive areas.
[Ord. NS-2423, 2021; Ord. NS-2361, 2020; Ord. NS-2353, 2019; Ord. NS-2271, 2016; Ord. NS-2251, 2015; Ord. NS-2016, 2006]
The Bend Development Code is current through Ordinance NS-2471, passed April 19, 2023.
Ch. 2.1 Residential Districts (UAR, RL, RS, RM-10, RM, RH) | Bend Development Code
2.1.200 A.
Page 3 of 24
Permitted and Conditional Uses.
Permitted Uses. The land uses listed in Table 2.1.200 are permitted in the Residential Districts, subject to the
provisions of this chapter. Only land uses that are specifically listed in Table 2.1.200, land uses that are incidental and subordinate to a permitted use and land uses that are approved as “similar” to those in Table 2.1.200 may be permitted. The land uses identified with a “C” in Table 2.1.200 require conditional use permit approval prior to development, in accordance with BDC Chapter 4.4, Conditional Use Permits. B.
Determination of Similar Land Use. Similar use determinations must be made in conformance with the
procedures in BDC 4.1.1400, Declaratory Ruling. C.
Exceptions. Existing uses and buildings lawfully established under previously effective land use regulations are
allowed to continue subject to BDC Chapter 5.2, except as otherwise specified in this section. 1.
Existing dwelling units that were lawfully established in their current location are treated as permitted
uses in the residential zones unless originally approved through a conditional use permit, in which case they must remain subject to any applicable conditions of approval. Such uses are not subject to BDC Chapter 5.2 unless otherwise nonconforming. D.
Conversions. 1.
Duplex. Conversion of an existing single-unit detached dwelling to a duplex is allowed; provided, that the
conversion does not increase nonconformance. 2.
Triplex and Quadplex. Conversion of an existing single-unit detached dwelling or duplex to a triplex or
quadplex is allowed; provided, that the conversion does not increase nonconformance. Table 2.1.200 – Permitted and Conditional Uses Land Use
RL
RS
RM-10
RM
RH
UAR
Single-unit detached dwelling
P
P
P
P
N
P
*Accessory dwelling units (ADUs)
P
P
P
P
P
P
*Manufactured homes on individual lots
P
P
P
P
N
P
*Manufactured home park
C
C
P
P
N
N
*Townhomes
P
P
P
P
P
N
*Duplex
P
P
P
P
P
N
*Triplex
P
P
P
P
P
N
Residential
The Bend Development Code is current through Ordinance NS-2471, passed April 19, 2023.
Ch. 2.1 Residential Districts (UAR, RL, RS, RM-10, RM, RH) | Bend Development Code
Page 4 of 24
Table 2.1.200 – Permitted and Conditional Uses Land Use
RL
RS
RM-10
RM
RH
UAR
*Quadplex
P
P
P
P
P
N
Residential care home (5 or fewer residents)
P
P
P
P
P
P
Adult day care
P
P
P
P
P
P
Residential care facility (6 or more residents)
N
N
C
P
P
N
Family childcare home (16 or fewer children)
P
P
P
P
P
P
*Multi-unit residential (more than 4 units)
N/P**
N/P**
P
P
P
N
Micro-units. See BDC Chapter 3.8.200
N
P
P
P
P
N
*Home business (Class A/Class B/Class C)
P
P
P
P
P
P
*Accessory uses and structures
P
P
P
P
P
P
Cottage housing development. See BDC 3.8.500
N
P
P
P
N
N
Cottage cluster development. See BDC 3.8.900
P
P
P
P
N
N
Places of worship
C
C
C
C
C
C
Clubs, lodges, similar uses
C
C
C
C
C
C
*Government offices and facilities
C
C
C
C
C
C
C
C
C
C
C
C
*Utilities (above ground)
C
C
C
C
C
C
Neighborhood parks
P
P
P
P
P
P
Community parks
C
C
C
C
C
C
Regional parks
C
C
C
C
C
C
Recreational facilities (public)
C
C
C
C
C
C
*Public and Institutional
(administration, public safety, utilities, and similar uses) Libraries, museums, community centers, and similar uses
The Bend Development Code is current through Ordinance NS-2471, passed April 19, 2023.
Ch. 2.1 Residential Districts (UAR, RL, RS, RM-10, RM, RH) | Bend Development Code
Page 5 of 24
Table 2.1.200 – Permitted and Conditional Uses Land Use
RL
RS
RM-10
RM
RH
UAR
C/P**
C/P**
C/P**
C/P**
C/P**
C/P**
Cemetery/mausoleum
C
C
C
C
C
C
Child care facility (17 or more children)
C
C
C
C
C
C
Hospital
C
C
C
C
C
C
*Mobility hub
P
P
P
P
P
N
C/
P/
P/
P
P
N
N***
N***
N***
C/
C/
C/
C/
P
N
N***
N***
N***
P***
C/
C/
P/
P
P
N
N***
N***
N***
C/
C/
P/
P
P
N
N***
N***
N***
C/
P/
P/
P
P
N
N***
N***
N***
C/
C/
C/
C/
C/
N
N***
N***
N***
P***
P***
C/
C/
P/
P
P
N
N***
N***
N***
C/
C/
P/
P
P
N
N***
N***
N***
Bed and breakfast inn
C
C
C
C
C
C
Boarding kennel
N
N
N
N
N
C
Schools
*Neighborhood Commercial (See 3.6.300(J)) Child care facility (13 or more children)
*Food and beverage services less than 2,000 square feet (with or without alcohol) Laundromats and dry cleaners
Retail sales and services
Personal services (e.g., barber shops, salons, similar uses) Repair services, conducted entirely within building; excluding vehicle repair, small engine repair and similar services Offices and clinics
Mixed-use building
*Miscellaneous Uses
The Bend Development Code is current through Ordinance NS-2471, passed April 19, 2023.
Ch. 2.1 Residential Districts (UAR, RL, RS, RM-10, RM, RH) | Bend Development Code
Page 6 of 24
Table 2.1.200 – Permitted and Conditional Uses Land Use
RL
RS
RM-10
RM
RH
UAR
Destination resorts
N
N
N
N
N
C
Diagnostic testing, counseling, administrative
C
C
C
C
C
N
Farm use, agriculture
N
N
N
N
N
P
Office uses lawfully existing prior to the
N
N
N
P
P
N
• Existing
P
P
P
P
P
P
• New (limited to 1 acre)
C
C
C
C
N
C
• New (larger than 1 acre)
N
N
N
N
N
C
*Shelters
P
P
P
P
P
P
*Short-term rental
P
P
P
P
P
P
*Small hydroelectric facility
P
P
P
P
P
P
• Small animal (only)
C
N
N
N
N
N
• Large animal
C
N
N
N
N
C
offices, meeting facilities for nonprofit and public community service programs for children and families.
adoption date of the ordinance codified in this code *Plant nursery
Veterinary clinic
Wireless and broadcast communication facilities
See BDC Chapter 3.7
Key to Districts: UAR = Urban Area Reserve
RL = Low Density Residential
RS = Standard Density Residential
RM = Medium Density Residential
RM-10 = Medium-10 Density Residential
RH = High Density Residential
The Bend Development Code is current through Ordinance NS-2471, passed April 19, 2023.
Ch. 2.1 Residential Districts (UAR, RL, RS, RM-10, RM, RH) | Bend Development Code
Page 7 of 24
Key to Permitted Uses P = Permitted, subject to BDC Chapter 4.1, Development Review and Procedures N = Not Permitted C = Conditional Use, subject to permit standards in BDC Chapter 4.4. * Subject to special standards as described in BDC 2.1.900, Architectural Design Standards, and/or BDC Chapter 3.6, Special Standards and Regulations for Certain Uses. ** Permitted as part of a master plan subject to BDC Chapter 4.5. *** Neighborhood commercial sites adjacent to a commercial or mixed-use Comprehensive Plan map designation. See BDC 3.6.300(J), Neighborhood Commercial Sites. Note: Existing Neighborhood Commercial (CN) Zoned properties will remain as mapped recognizing neighborhood commercial properties established prior to the adoption of this code. The development of these sites must conform to the standards outlined in BDC Chapter 3.6, Special Standards and Regulations for Certain Uses, for the uses described above. [Ord. NS-2463, 2023; Ord. NS-2443, 2022; Ord. NS-2423, 2021; Ord. NS-2389, 2020; Ord. NS-2353, 2019; Ord. NS-2303, 2018; Ord. NS-2289, 2017; Ord. NS-2271, 2016; Ord. NS-2264, 2016; Ord. NS-2260, 2016; Ord. NS-2251, 2015; Ord. NS-2241, 2015; Ord. NS-2240, 2015; Ord. NS-2158, 2011; Ord. NS-2016, 2006]
2.1.300 A.
Setbacks.
Purpose. Setbacks provide private outdoor living space, building separation for fire protection/security,
building maintenance, and sunlight and air circulation. The setback standards encourage placement of residences close to the street for public safety and neighborhood security. B.
Setback Standards. The following setback standards apply to all structures, except as otherwise provided by
this section or specified in this code. See also special setbacks permitted in BDC 3.6.200, Special Standards for Residential Uses, and BDC Chapter 3.8, Development Alternatives. C.
Front Setbacks. 1.
RL and UAR Districts. The minimum front setback is 20 feet. a.
Exception. On corner or through lots with two frontages within a platted land division, one front
setback may be 10 feet; provided, that a garage and/or carport with a street access is set back a minimum of 20 feet. 2.
RS, RM-10, RM, and RH Districts. The minimum front setback is 10 feet. Garages and carports with street
access must be set back a minimum of 20 feet from the front property line.
The Bend Development Code is current through Ordinance NS-2471, passed April 19, 2023.
Ch. 2.1 Residential Districts (UAR, RL, RS, RM-10, RM, RH) | Bend Development Code
3.
Page 8 of 24
Where streets with insufficient right-of-way abut the site, special setbacks apply in conformance with
BDC 3.4.200(J), Special Setbacks. D.
Rear Setbacks. 1.
RL and UAR Districts. The minimum rear setback is 20 feet.
Exception. In the RL Zone on corner lots within a platted subdivision, the minimum rear setback is 10 feet. 2.
RS, RM-10, RM and RH Districts. The minimum rear setback is five feet. When multi-unit residential or
nonresidential uses abut a single-unit detached dwelling in the RS District, the rear setback abutting the RS District must increase one-half foot for each foot by which the building height exceeds 20 feet. Exception: Development in conformance with the provisions of BDC Chapter 3.8, Development Alternatives. E.
Side Setbacks. 1.
RL and UAR Districts. The minimum side setback is 10 feet.
2.
RS, RM-10, RM and RH Districts. The minimum side setback is five feet. When multi-unit residential or
nonresidential uses abut a single-unit detached dwelling in the RS District, the side setback abutting the RS District must increase one-half foot for each foot by which the building height exceeds 20 feet. Exception: Development in conformance with the provisions of BDC Chapter 3.8, Development Alternatives. Table 2.1.300 – Typical Residential District Setbacks Front
Rear
Side
UAR
10 ft./20 ft.
20 ft.
10 ft.
RL
10 ft./20 ft.
10 ft./20 ft.
10 ft.
RS
10 ft., except garages and/
5 ft.*
5 ft.*
5 ft.*
5 ft.*
or carports must be set back 20 ft. RM-10, RM and
10 ft., except garages and/
RH
or carports must be set back 20 ft.
* When multi-unit residential or nonresidential uses abut one or more dwelling units in the RL or RS District, the setback abutting the RL or RS District must increase one-half foot for each foot by which the building height exceeds 20 feet. Where a fractional number results, the number may be rounded down to the nearest whole number. F.
Additional Setback Requirements.
The Bend Development Code is current through Ordinance NS-2471, passed April 19, 2023.
Ch. 2.1 Residential Districts (UAR, RL, RS, RM-10, RM, RH) | Bend Development Code
1.
Page 9 of 24
Garages and Carports. a.
Where the side or rear wall of the garage faces the street, the front setback for the garage side or
rear wall must be a minimum of 10 feet from the front property line for RS, RM, RM-10 and RH and 20 feet for RL. The garage must have a window(s) in the side or rear wall facing the street that is a minimum of six square feet. b.
Alley Access. Where an existing alley is less than 20 feet in width, the setback abutting the alley must
be increased to provide a minimum of 24 feet for maneuvering and backing movements from garages, carports and/or parking areas. As shown in Figure 2.1.300, side entry garages that access an alley must also have a driveway with a minimum length of 20 feet from the garage door to the side property line. c.
Street Access. As shown in Figure 2.1.300, side entry garages that access a street must have a
driveway with a minimum length of 20 feet from the front and side property lines. Figure 2.1.300.
2.
Townhomes. Setbacks for lot lines where townhouse units are attached are zero.
3.
Clear Vision Areas. All structures must comply with this section, except as necessary to comply with BDC
3.1.500, Clear Vision Areas. 4.
Bridges. Bridges that form the driveway or pedestrian access from the abutting street or alley are
permitted in the setbacks. 5.
Architectural Features. Except as prohibited in subsection (F)(6) of this section, the following architectural
features are allowed to encroach into the front, side and rear setbacks by no more than two feet provided a minimum setback of three feet is provided from the property line: eaves, chimneys including fireplace enclosures and chimney chases, bay windows up to eight feet in width, window wells, and similar architectural features. 6.
Front Setbacks. The following may encroach into the front setback: The Bend Development Code is current through Ordinance NS-2471, passed April 19, 2023.
Ch. 2.1 Residential Districts (UAR, RL, RS, RM-10, RM, RH) | Bend Development Code
a.
Page 10 of 24
RL and UAR. An unenclosed covered or uncovered porch, patio, deck or stoop with a maximum floor
height not exceeding 18 inches may be set back a minimum of 10 feet, as long as it does not encroach into a public utility easement. No portion of the structure can encroach closer than 10 feet including the architectural features in subsection (F)(5) of this section. b.
RS, RM, RM-10 and RH. An unenclosed covered or uncovered porch, patio, deck or stoop with a
maximum floor height not exceeding 18 inches may be set back a minimum of six feet from the front property line, as long as it does not encroach into a public utility easement. No portion of the structure can encroach closer than six feet to the front property line including the architectural features in subsection (F)(5) of this section. c.
Stairs, ramps and landings that are not roofed or enclosed above or below the steps may be in the
front setback when they follow the grade. 7.
Side and Rear Setbacks. The following may encroach into the side and rear setback in the UAR, RL, RS, RM,
RM-10 and RH: a.
An uncovered porch, patio, deck or stoop located above finished grade with a maximum floor height
not exceeding 18 inches must be set back a minimum of 18 inches from the side and rear property lines, as long as it does not encroach into a public utility easement. b.
Uncovered patios at finished grade are exempt from setbacks as long as it does not encroach into a
public utility easement. c.
Stairs, ramps and landings that are not roofed or enclosed above or below the steps may be in the
side and rear setback when they are at ground level and follow the grade. G.
Prohibited in Setbacks. The following are prohibited, unless stated otherwise, within the following setbacks: 1.
Front Setbacks. Satellite dishes greater than 18 inches in diameter, heat pumps and other similar objects.
2.
Side and Rear Setbacks. Satellite dishes greater than 18 inches in diameter, heat pumps and other similar
objects, unless screened for visual and noise abatement by a solid enclosure two feet higher than the object/ use being screened. 3.
Balconies. [Ord. NS-2463, 2023; Ord. NS-2423, 2021; Ord. NS-2389, 2020; Ord. NS-2353, 2019; Ord.
NS-2314, 2018; Ord. NS-2303, 2018; Ord. NS-2289, 2017; Ord. NS-2260, 2016; Ord. NS-2251, 2015; Ord. NS-2082, 2007; Ord. NS-2016, 2006]
2.1.400
Building Mass and Scale.
Repealed by Ord. NS-2423.
The Bend Development Code is current through Ordinance NS-2471, passed April 19, 2023.
Ch. 2.1 Residential Districts (UAR, RL, RS, RM-10, RM, RH) | Bend Development Code
2.1.500
Page 11 of 24
Lot Area and Dimensions.
Lot areas and lot dimension standards for residential uses are listed in Table 2.1.500. For other residential uses listed in Table 2.1.200, the lot area and dimensions are subject to the type of residential structure being occupied. Lot development must be in conformance with BDC 2.1.600, Residential Density. Lot area and dimensions exceptions for affordable housing, see BDC 3.6.200(C). Table 2.1.500.
Lot Areas and Dimensions in the Residential Districts by Housing Type and Zone
Residential Use
Zone
Minimum Lot Area
Single-Unit
UAR
10 acres
Minimum Lot Width/
Exceptions
Depth Width: 300 ft. min.
No exceptions
Detached
average lot width with a
permitted
Dwelling;
min. street frontage of
Manufactured
150 ft.
Homes on Lots
Width: 50 ft. at front
Bulb of a cul-de-sac
3.6.200(E));
property line
minimum width: 30 ft.
Residential Care
Depth: 100 ft.
min. at the front
(See BDC
Homes and Facilities (See BDC 3.6.200(J))
RL
10,000 sq. ft.
property line except for RS
4,000 sq. ft.
RM-10
RM
2,500 sq. ft.
Width: 40 ft. at front
townhomes and flag
property line
lots
Depth: 50 ft.
Except for townhomes,
Width: 30 ft. at the front property line Depth: 50 ft.
Duplex, Triplex, and Quadplex. See BDC
RH
Not applicable
Not applicable
UAR
Not applicable
Not applicable
RL
Duplex: 10,000 sq. ft.
Width: 50 ft. at front
Triplex: 10,000 sq. ft.
property line
Quadplex: 10,000 sq.
Depth: 100 ft.
3.6.200(H)
ft.
corner lots or parcels must be at least five feet more in width than the minimum lot width required in the zone Lots or parcels existing prior to November 5, 2021, that are less than 2,500 square feet in the RH Zone may have a triplex or a quadplex Development
RS
Duplex: 4,000 sq. ft.
Width: 40 ft. at front
RM-10
Triplex: 4,000 sq. ft.
property line
Quadplex: 4,000 sq.
Depth: 50 ft.
alternatives: see BDC Chapter 3.8
ft.
The Bend Development Code is current through Ordinance NS-2471, passed April 19, 2023.
Ch. 2.1 Residential Districts (UAR, RL, RS, RM-10, RM, RH) | Bend Development Code
Table 2.1.500.
Page 12 of 24
Lot Areas and Dimensions in the Residential Districts by Housing Type and Zone
Residential Use
Minimum Lot Width/
Zone
Minimum Lot Area
RM
Duplex: 2,500 sq. ft.
Width: 30 ft. at the front
Triplex: 4,000 sq. ft.
property line
Quadplex: 4,000 sq.
Depth: 50 ft.
Depth
Exceptions
ft. RH
Duplex: 1,250 sq. ft. Triplex: 2,500 sq. ft. Quadplex: 2,500 sq. ft.
Townhomes See BDC 3.6.200(D)
UAR
Not applicable
Not applicable
RL, RS,
Average minimum lot
Width: 20 ft. at front
RM-10,
or parcel size: 1,500
property
RM
sq. ft. for each unit
Depth: 50 ft.
RH
Average minimum lot or parcel size: 1,200 sq. ft. for each unit
Multi-Unit Dwelling (more than 4 units)
UAR
Not applicable
Not applicable
RL*,
4,000 sq. ft. for each
Width: 30 ft. at front
RS*,
unit
property line
RM-10 RM, RH
Depth: 50 ft. None
* When permitted as part of a master plan subject to BDC Chapter 4.5, Master Plans. [Ord. NS-2434, 2022; Ord. NS-2423, 2021; Ord. NS-2389, 2020; Ord. NS-2361, 2020; Ord. NS-2353, 2019; Ord. NS-2318, 2018; Ord. NS-2314, 2018; Ord. NS-2289, 2017; Ord. NS-2271, 2016; Ord. NS-2113, 2009; Ord. NS-2016, 2006]
The Bend Development Code is current through Ordinance NS-2471, passed April 19, 2023.
Ch. 2.1 Residential Districts (UAR, RL, RS, RM-10, RM, RH) | Bend Development Code
2.1.600 A.
Page 13 of 24
Residential Density.
Residential Density Standard. The following density standards apply to all new development in all of the
Residential Districts, except as specified in subsection (B) of this section. The density standards shown in Table 2.1.600 are intended to ensure efficient use of buildable lands and provide for a range of needed housing, in conformance with the Bend Comprehensive Plan. 1.
The density standards may be averaged over more than one development phase (i.e., as in a subdivision
or Master Planned Development). Table 2.1.600.
Residential Densities
Residential Zone
B.
Density Range
Urban Area Reserve (UAR10)
1 unit/10 gross acres
Low Density Residential (RL)
1.1 – 4.0 units/gross acre
Standard Density Residential (RS)
4.0 – 7.3 units/gross acre
Medium Density Residential (RM-10)
6.0 – 10.0 units/gross acre
Medium Density Residential (RM)
7.3 – 21.7 units/gross acre
High Density Residential (RH)
21.7 – 43 units/gross acre
Exemptions. 1.
The following are exempt from the density standards in subsection (A) of this section: a.
Residential care homes/facilities.
b.
Bed and breakfast inns.
c.
Nonresidential uses, including neighborhood commercial uses, public and institutional uses, and
miscellaneous uses that do not include a dwelling unit. d.
Buildings that are listed in the Inventory of Historic Sites within the Bend Area Comprehensive Plan
Exhibit “A” or buildings designated on the Historic National Landmarks Register. e.
Replacement, renovation, or expansion of existing dwelling unit(s) in any zone provided the number
of dwelling units does not change. f.
Development on a vacant lot or parcel consistent with an approved land division, except tracts
identified for future phases. 2.
The following are exempt from the maximum density standards in subsection (A) of this section:
The Bend Development Code is current through Ordinance NS-2471, passed April 19, 2023.
Ch. 2.1 Residential Districts (UAR, RL, RS, RM-10, RM, RH) | Bend Development Code
Page 14 of 24
a.
Accessory dwelling units (ADUs).
b.
Manufactured home parks within the RS Zone; provided, that the standards of BDC 3.6.200(G) are
met.
3.
c.
Duplexes, triplexes, quadplexes, townhomes and cottage cluster developments.
d.
Multi-unit affordable dwellings. See BDC 3.6.200(C).
The following are exempt from the minimum density standards in subsection (A) of this section: a.
Residential infill, as defined in BDC Chapter 1.2.
b.
Partitions on properties that are large enough to be divided into four or more lots; provided, that
the size of the resulting parcels and siting of dwellings allow future development on these parcels at minimum densities. C.
Density Calculation. 1.
Maximum housing densities are calculated as follows: a.
The area subject to maximum housing density is the total site area excluding any land to be
developed with or dedicated for neighborhood commercial uses, public and institutional uses, and miscellaneous uses that do not include a dwelling unit. b.
The area for future streets is included in the area subject to maximum housing density.
c.
Where existing streets abut the proposed development site, the area of up to 30 feet of the abutting
street width multiplied by the site frontage shall be added to the area subject to maximum housing density. d.
Sensitive lands, fire breaks, and canals and their associated easements on the site are included in
the area subject to maximum housing density. e.
For purposes of calculating maximum density, fractional units are rounded down to the next whole
unit. f.
As an illustrative example, if the total site area is five acres, of which a half-acre is sensitive lands,
and another acre will be developed with neighborhood commercial uses, and new streets will be created, the area subject to maximum housing density is four acres (total site area minus one acre of neighborhood commercial uses, but including the sensitive lands). If the maximum allowable density is 7.3 dwelling units per acre, then a maximum number of 29 units is allowed on the site. 2.
Minimum housing densities are calculated as follows: a.
The area subject to minimum housing density is the total site area excluding any land to be
developed with or dedicated for neighborhood commercial uses, public and institutional uses, and
The Bend Development Code is current through Ordinance NS-2471, passed April 19, 2023.
Ch. 2.1 Residential Districts (UAR, RL, RS, RM-10, RM, RH) | Bend Development Code
Page 15 of 24
miscellaneous uses that do not include a dwelling unit; sensitive lands; fire breaks; and canals and their associated easements. b.
The area for future streets is included in the area subject to minimum housing density.
c.
For purposes of calculating minimum density, fractional units are rounded up to the next whole
unit. d.
As an illustrative example, if the total site area is five acres, of which a half-acre is sensitive lands,
and another acre will be developed with neighborhood commercial uses, and new streets will be created, the area subject to minimum housing density is three and one-half acres (total site area minus one acre of neighborhood commercial uses, minus a half-acre of sensitive lands). If the minimum density is 4.0 dwelling units per acre, then a minimum number of 14 units is required on the site. 3.
Where a property is within multiple zoning districts, the minimum and maximum number of units is
calculated based on the acreage in each Residential Zone that is subject to the density standard as specified above multiplied by the applicable minimum and maximum density standards. Areas with nonresidential zones are excluded from the density calculation. D.
Density Bonus for Affordable Housing. See BDC 3.6.200(C). [Ord. NS-2434, 2022; Ord. NS-2423, 2021; Ord.
NS-2389, 2020; Ord. NS-2318, 2018; Ord. NS-2314, 2018; Ord. NS-2303, 2018; Ord. NS-2271, 2016; Ord. NS-2260, 2016; Ord. NS-2241, 2015; Ord. NS-2016, 2006]
2.1.700 A.
Maximum Lot Coverage and Floor Area Ratio.
Maximum Lot Coverage and Floor Area Ratio. The following maximum lot coverage and floor area ratio
standards apply: Table 2.1.700. Residential Zone
Residential Lot Coverage Lot Coverage
FAR
35%
None
50% for lots or parcels with
1.1 for three-story residential
and Medium-10 Density
single-story dwelling unit(s) and
uses and accessory structures.
Residential (RM-10)
single-story accessory structures.
None for all other uses.
Low Density Residential (RL) Standard Density Residential (RS),
45% for all other lots or parcels. Medium Density Residential (RM)
50% for lots or parcels with
None
single-story single-unit detached dwelling unit(s) and single-story accessory structures.
The Bend Development Code is current through Ordinance NS-2471, passed April 19, 2023.
Ch. 2.1 Residential Districts (UAR, RL, RS, RM-10, RM, RH) | Bend Development Code
Table 2.1.700. Residential Zone
Page 16 of 24
Residential Lot Coverage Lot Coverage
FAR
45% for all other lots or parcels with single-unit detached dwellings and accessory structures and nonresidential uses. 60% for lots or parcels with townhomes, duplexes, triplexes, quadplexes and multi-unit and accessory structures. High Density Residential (RH) B.
None
None
Exceptions. 1.
Lot Coverage for Affordable Housing. See BDC 3.6.200(C).
2.
Development in conformance with the provisions of BDC Chapter 3.8, Development Alternatives. [Ord.
NS-2423, 2021; Ord. NS-2314, 2018; Ord. NS-2271, 2016; Ord. NS-2241, 2015; Ord. NS-2016, 2006]
2.1.800
Building Height.
The following building height standards are intended to promote land use compatibility and support the principle of neighborhood-scaled design: A.
B.
Standard. The following building heights apply to all development within the Residential District: 1.
Buildings within the UAR, RL, RS and RM-10 Districts may be no more than 35 feet in height.
2.
Buildings within the RM Zone may be no more than 40 feet in height.
3.
Buildings within the RH Districts may be no more than 50 feet in height.
Exceptions to Maximum Building Height Standard for Affordable Housing. See BDC 3.6.200(C). [Ord. NS-2423,
2021; Ord. NS-2314, 2018; Ord. NS-2303, 2018; Ord. NS-2271, 2016; Ord. NS-2241, 2015; Ord. NS-2082, 2007; Ord. NS-2016, 2006]
The Bend Development Code is current through Ordinance NS-2471, passed April 19, 2023.
Ch. 2.1 Residential Districts (UAR, RL, RS, RM-10, RM, RH) | Bend Development Code
2.1.900 A.
Page 17 of 24
Architectural Design Standards.
Purpose. The architectural standards are intended to provide detailed, human-scale design, while affording
flexibility to use a variety of building styles for certain types of residential development. B.
Applicability. This section applies to all of the following types of buildings: 1.
Multi-unit residential;
2.
Public and institutional buildings in Residential Zones;
3.
All other types of permitted/conditional nonresidential use buildings listed in Table 2.1.200 when built in
a Residential Zone. a. C.
Exemption. Neighborhood commercial uses listed in Table 2.1.200.
Standards. All buildings that are subject to this section shall comply with all of the following standards. The
graphics provided with each standard are intended to show examples of how to comply. Other building styles and designs can be used to comply, so long as they are consistent with the text of this section. An architectural feature (i.e., as shown in the graphics) may be used to comply with more than one standard. 1.
Building Form. All buildings shall incorporate design features such as offsets, balconies, projections,
window reveals, or similar elements to preclude large expanses of uninterrupted building surfaces, as shown in the figure below. Along the vertical face of a structure, such features shall occur at a minimum of every 40 feet, on each floor, and shall contain at least two of the following features: a.
Recess (e.g., deck, patio, courtyard, entrance or similar feature) that has a minimum depth of six
feet; b.
Extension (e.g., floor area, deck, patio, entrance, or similar feature) that projects a minimum of two
feet and runs horizontally for a minimum length of four feet; and/or c.
Offsets or breaks in roof elevation of two feet or greater in height. Figure 2.1.900.A.
Building Form (Multi-Unit Dwelling Example)
The Bend Development Code is current through Ordinance NS-2471, passed April 19, 2023.
Ch. 2.1 Residential Districts (UAR, RL, RS, RM-10, RM, RH) | Bend Development Code
2.
Page 18 of 24
Building Orientation. All building elevations adjacent to a street right-of-way shall provide doors, porches,
balconies, and/or windows. A minimum of 40 percent of front (i.e., street-facing) elevations, and a minimum of 30 percent of side and rear building elevations, shall meet this standard. Percent of elevation is measured as the horizontal plane (lineal feet) containing doors, porches, balconies, terraces and/or windows. The standard applies to each full and partial building story. Exceptions: a.
A multi-unit building may have its entrance oriented to a side yard when a direct pedestrian
walkway is provided between the building entrance and the street in accordance with the standards in BDC Chapter 3.1, Lot, Parcel and Block Design, Access and Circulation. In this case, at least one entrance shall be provided not more than 30 feet from the closest sidewalk or street. b. 3.
A multi-unit building may be oriented to a common use courtyard.
Detailed Design. All buildings shall provide detailed design along all elevations which are visible from the
street(s) adjacent to the property (i.e., front, rear and sides). There are two options for complying with this requirement. a.
Menu Option (Type I). Detailed design shall be provided by using at least six of the following 12
architectural features on all applicable elevations, as appropriate for the proposed building type and style (may vary features on rear/side/front elevations). These features shall be reviewed by a Type I application as per BDC 4.1.300: Dormers
Gables
Recessed entries
Covered porch entries
Cupolas
Pillars or posts
The Bend Development Code is current through Ordinance NS-2471, passed April 19, 2023.
Ch. 2.1 Residential Districts (UAR, RL, RS, RM-10, RM, RH) | Bend Development Code
Eaves (minimum 12-inch projection)
Window trim (minimum four inches wide)
Bay windows
Balconies
Offsets in the building face or roof by a
Decorative patterns on the exterior finish
minimum of 18 inches
using shingles, wainscoting, board and
Page 19 of 24
batt. Figure 2.1.900.B.
b.
Examples of Architectural Details
Design Review Option (Type II). Detailed design shall be provided by showing compliance with the
following design criteria through a Type II application and review per BDC 4.1.400, Type II and Type III Applications. i.
The general size, shape, and scale of the structure(s) are architecturally compatible with the site
and with the surrounding neighborhood, unless such compatibility with existing structures does not reflect the long-term purpose or intent of the underlying zoning of the subject site. ii.
If the project includes a large structure or structures (greater than 20,000 square feet), the
design shall incorporate changes in direction and divide large masses into varying heights and sizes by breaking up building sections, or by the use of such elements as variable planes, projections, bays, dormers, setbacks, canopies, awnings, parapets, changes in the roofline, materials, color, or textures. iii.
Exterior finish on vertical surfaces shall be primarily of materials such as masonry/wood siding,
shingles, or stucco. The use of sheet metal or plywood shall not exceed 50 percent of the wall area. No smooth-faced cinder block construction shall be permitted on front facades. Cinder block construction for side and rear facades shall be permitted by approval as part of this review process. [Ord. NS-2423, 2021; Ord. NS-2353, 2019; Ord. NS-2318, 2018; Ord. NS-2271, 2016; Ord. NS-2260, 2016; Ord. NS-2016, 2006]
The Bend Development Code is current through Ordinance NS-2471, passed April 19, 2023.
Ch. 2.1 Residential Districts (UAR, RL, RS, RM-10, RM, RH) | Bend Development Code
2.1.950 A.
Page 20 of 24
Design Standards (Triplex, Quadplex and Townhome).
Applicability. This section applies to all of the following types of buildings: 1.
Triplex.
2.
Quadplex.
3.
Townhome.
For purposes of this section, a “street” also means a tract for mid-block developments and T-courts. B.
Garage Door Standards. The maximum combined garage door width facing the street is 50 percent of the total
building width. As shown in Figure 2.1.950.B, the maximum combined garage door width facing the street may be up to 60 percent of the total building width if the front door entrance is within 10 feet of the longest street-facing wall of the dwelling unit. 1.
Exemptions to Garage Door Standards. a.
Existing garages legally constructed prior to November 5, 2021.
b.
When the side or rear wall of the garage faces the street, provided the standards of BDC
2.1.300(F)(1)(a) are met. Figure 2.1.950.B.
The Bend Development Code is current through Ordinance NS-2471, passed April 19, 2023.
Ch. 2.1 Residential Districts (UAR, RL, RS, RM-10, RM, RH) | Bend Development Code
C.
Page 21 of 24
Front Door Orientation Standards. The following front door orientation standards are required for lots and
parcels with frontage onto a street. For triplexes and quadplexes, these standards are only required to be met for one of the dwelling units. The entrance must either: 1.
Face the street;
2.
Be at an angle of up to 45 degrees from the street;
3.
Face a common open space that abuts the street and be abutted by dwellings on at least two sides; or
4.
Open onto a porch. The porch must be at least 20 square feet in area and have at least one entrance
facing the street or have a roof. A covered walkway or breezeway is not a porch. 5.
D.
Exemptions to Orientation Standards. a.
Triplexes, quadplexes and townhomes created by a conversion of an existing dwelling unit.
b.
Dwelling units located on the flag portion of a flag lot.
Windows and Doors. A minimum of 15 percent of the area of all street facing facades must include windows
and/or doors. Gabled areas and garage doors (in blue) and roofs (in white) are not included in the base wall calculation when determining the minimum 15 percent calculation for windows/door areas. Facades separated from the street property line by a dwelling are exempt from meeting this standard. Figure 2.1.950.D.
[Ord. NS-2463, 2023; Ord. NS-2434, 2022; Ord. NS-2423, 2021]
The Bend Development Code is current through Ordinance NS-2471, passed April 19, 2023.
Ch. 2.1 Residential Districts (UAR, RL, RS, RM-10, RM, RH) | Bend Development Code
2.1.1000 A.
Page 22 of 24
Multi-Unit Residential Districts (RM, RH).
Purpose/Intent Statement. The Medium and High Density Residential Districts are intended to provide land for
a mix of attached and multi-unit dwellings in locations that are convenient to service commercial uses and future transit opportunities. B.
Development Standards for Multi-Unit Developments in the RM and RH Districts. In addition to the site
development standards in BDC Chapter 4.2, the following standards apply to multi-unit developments of five units or more, unless otherwise stated: 1.
Common Open Space. In addition to the required setback yards, a minimum of 10 percent of the site area
must be designated and permanently reserved as usable common open space in all large-scale (20 units or more) multiple-unit developments, unless a credit in subsection (B)(1)(a) of this section is approved. The site area is defined as the lot or parcel on which the development is planned, after subtracting any required dedication of street right-of-way and other land for public purposes (e.g., public park or school grounds, etc.). Sensitive lands and historic buildings or landmarks open to the public and designated by the Bend Comprehensive Plan may be counted toward meeting the common open space requirements. a.
Credit for Proximity to a Park. A common open space credit of 50 percent may be granted when the
development is located within one-quarter mile walking distance of a public park; and there is a direct, accessible, and maintained trail or sidewalk between the development and the park that does not cross an arterial or collector street. 2.
Private Open Space. Private open space areas are required for ground-floor and upper-floor housing units
through compliance with all of the following standards: a.
Ground-floor housing units must have patios or decks at least four feet deep and measuring at least
48 square feet. Ground-floor housing means the housing unit entrance (front or rear) is within five feet of the finished ground elevation, after grading and landscaping; b.
A minimum of 50 percent of all upper-floor housing units must have balconies or porches at least
four feet deep and measuring at least 48 square feet. Upper-floor housing means housing units that are more than five feet above the finished grade, after grading and landscaping; and c. 3.
Ground-floor private open space areas must not be located within 12 feet of trash receptacles.
Trash Receptacles. Trash receptacles must not be located within setbacks for property lines shared with
single-unit detached and attached dwellings and must be screened on at least three sides with an evergreen hedge or solid fence or wall of not less than six feet in height. Receptacles must be located for easy access by trash pick-up vehicles. C.
Housing Mix Standards in the RM District. In order to ensure a mix of housing types that meets the City’s overall
housing needs, in addition to minimum and maximum density standards in BDC 2.1.600, at least 50 percent of the total housing units in residential developments on any property or combination of properties between three acres
The Bend Development Code is current through Ordinance NS-2471, passed April 19, 2023.
Ch. 2.1 Residential Districts (UAR, RL, RS, RM-10, RM, RH) | Bend Development Code
Page 23 of 24
and 20 acres in the RM District must be middle housing and/or multi-unit dwellings. The standards of BDC 4.5.200(E) apply to properties of 20 acres in size and greater. Figure 2.1.1000.A.
Multi-Unit Dwellings (typical site layout)
[Ord. NS-2463, 2023; Ord. NS-2423, 2021; Ord. NS-2303, 2018; Ord. NS-2271, 2016; Ord. NS-2016, 2006]
2.1.1100
Other Design Standards.
A.
Development must comply with BDC 3.5.600, On-Site Drainage.
B.
Development must comply with BDC 3.5.200, Outdoor Lighting Standards, and 3.5.400, Solar Standards.
C.
Garage and carports must be accessed from abutting alleys. See BDC 3.1.200(E), Lot and Parcel Access, and
BDC 3.1.400(F), Access Management Requirements. D.
A sink outside of a kitchen or wet bar may be added in compliance with the following: 1.
In a garage or accessory structure if the space is not conditioned as defined in BDC Chapter 1.2,
Definitions. A garage or accessory structure must not contain a dishwashing machine; a range hood, exhaust vent, or similar equipment; or a stove, range, or oven. The Bend Development Code is current through Ordinance NS-2471, passed April 19, 2023.
Ch. 2.1 Residential Districts (UAR, RL, RS, RM-10, RM, RH) | Bend Development Code
2.
Page 24 of 24
In a laundry room. The laundry room may include utility hook-ups for gas or electric laundry appliances.
A laundry room must not contain a dishwashing machine; a range hood, or similar equipment; or a stove, range, or oven. [Ord. NS-2463, 2023; Ord. NS-2462, 2023; Ord. NS-2423, 2021; Ord. NS-2389, 2020; Ord. NS-2314, 2018]
The Bend Development Code is current through Ordinance NS-2471, passed April 19, 2023. Disclaimer: The city recorder’s office has the official version of the Bend Development Code. Users should contact the city recorder’s office for ordinances passed subsequent to the ordinance cited above. City Website: www.bendoregon.gov Hosted by Code Publishing Company, A General Code Company.
The Bend Development Code is current through Ordinance NS-2471, passed April 19, 2023.
For more information please contact:
HEATHER OSGOOD Real Estate Broker, GRI, ABR WINDERMERE REALTY TRUST Bend, Oregon heatherosgood@windermere.com 206-419-3459 CELL 541-388-0404 OFFICE heatherosgoodre.com