
Future Vehicle Technology Insights Pack


Sponsors


Corporate Partners

Connecting the industry TM




Hello and welcome to this special ARC360 Insights Pack, published specifically to align with ARC360’s annual conference.
On the following pages you will find slides from the conference presentations courtesy of:
Matthew Freeman Managing Consultant, cap hpi
Chris Downing Head of Sales & Operations, Stellantis
Tom Leggett Vehicle Technology Manager, Thatcham Research
Included is also the inaugural Activate Group Charge-Up: Quarterly EV Insights as well as an exclusive Market Intelligence report courtesy of ARC360 Associate Partner, Trend Tracker.
Welcome
Each section of this publication is clearly marked with the source of the information included and we hope each helps continue to support dialogue across the industry.
Of course, this Insights Pack is only possible through the support of those contributors, those many more who partner with ARC360 on an ongoing basis, and those who support on an event-byevent basis.
We would therefore like to say a special thank you to ARC360 Corporate Partners: BASF; CAPS; Entegral; Enterprise Mobility; Mirka, Nationwide Assistance Group; S&G Response; and Solera Audatex, along with our Partners: e2e; Gemini ARC; Prasco; and Repairify, and, of course sponsors of this year’s conference: Activate Group; Thatcham Research; and Stellantis.
We hope the information contained within this special Insights Pack supports your business objectives and would welcome any feedback.
Many thanks for your ongoing support.
Mark Hadaway
Co-founder
ARC360

KEYNOTE The UK vehicle parc – where
are we heading?
Matthew Freeman Managing Consultant
cap hpi

The UK vehicle parc – where are we heading?
Matt Freeman, Managing Consultant
cap hpi

ARC360
Coventry, 27th June 2024

Agenda
cap hpi view of the current and future vehicle market

1. Used vehicle market update

2. Driving the EV market forwards

3. Impact of new technology

1. Used vehicle market update
Used vehicle market update
The Used Car Market Remains in Good Health…
Used Car Values – Cumulative Movements
Used vehicle market update
The Used Car Market Remains in Good Health…
Used Car Values – Cumulative Movements 36m, 60k miles
Feb-21 Mar-21 Apr-21 May-21 Jun-21 Jul-21 Aug-21 Sep-21 Oct-21 Nov-21 Dec-21 Jan-22 Feb-22 Mar-22 Apr-22 May-22 Jun-22 Jul-22 Aug-22 Sep-22 Oct-22 Nov-22 Dec-22 Jan-23 Feb-23 Mar-23 Apr-23 May-23 Jun-23 Jul-23 Aug-23 Sep-23 Oct-23 Nov-23 Dec-23 Jan-24 Feb-24 Mar-24 Apr-24 May-24 Jun-24
Data: cap hpi
Used vehicle market update
2021-22 Unprecedented Used Car Price Inflation for all Fuel Types
Used Car Values – Cumulative Movements 36m, 60k miles
Data: cap hpi
BEVs have dropped an average of 58.4% since September 2022
Petrol Diesel Hybrids Plug-in hybrids BEV
Used vehicle market update
Top-10 Biggest Upward Movers in last 36-months at 3-years, 30k miles
Data: cap hpi
Mercedes-Benz S-Class (13-21)
Hyundai i10 (1420) Hyundai iX20 (10-20)
Vauxhall Combo Life (18-24) Toyota Yaris (17-21)
KIA Picato (17-) Peugeot Rifter (18-24)
Hyundai i800 Diesel (18-20)
Rolls-Royce Dawn (15-23)
Toyota Proace Verso Diesel (16-23)
Used vehicle market update
Top-10 Biggest Downward Movers in last 36-months at 3-years, 30k miles
Jaguar I-PACE (18-)
Nissan Leaf (17)
Range Rover Sport HEV (1723)
Land Rover
Discovery Diesel (16-)
VW e-Golf (1420)
Audi e-tron (1823)
Range Rover HEV (17-22)
Range Rover
Sport Diesel (1723)
Hyundai Kona BEV (18-23)
Range Rover
Diesel (15-21)
Data: cap hpi
2. Driving the EV market forwards
Market Trends & Innovation Update
Car Parc by Fuel-Type
Data:
Market Trends & Innovation Update
…as registrations shift to electric
New Car Registrations by Fuel-Type
Data: SMMT
Market Trends & Innovation Update
…as registrations shift to electric


Market Trends & Innovation Update
…as registrations shift to electric

Market Trends & Innovation Update
Road to Net Zero
Zero-emission vehicle mandate targets for cars
Net zero strategies are now set to drive the change
Data: UK Government
Market Trends & Innovation Update
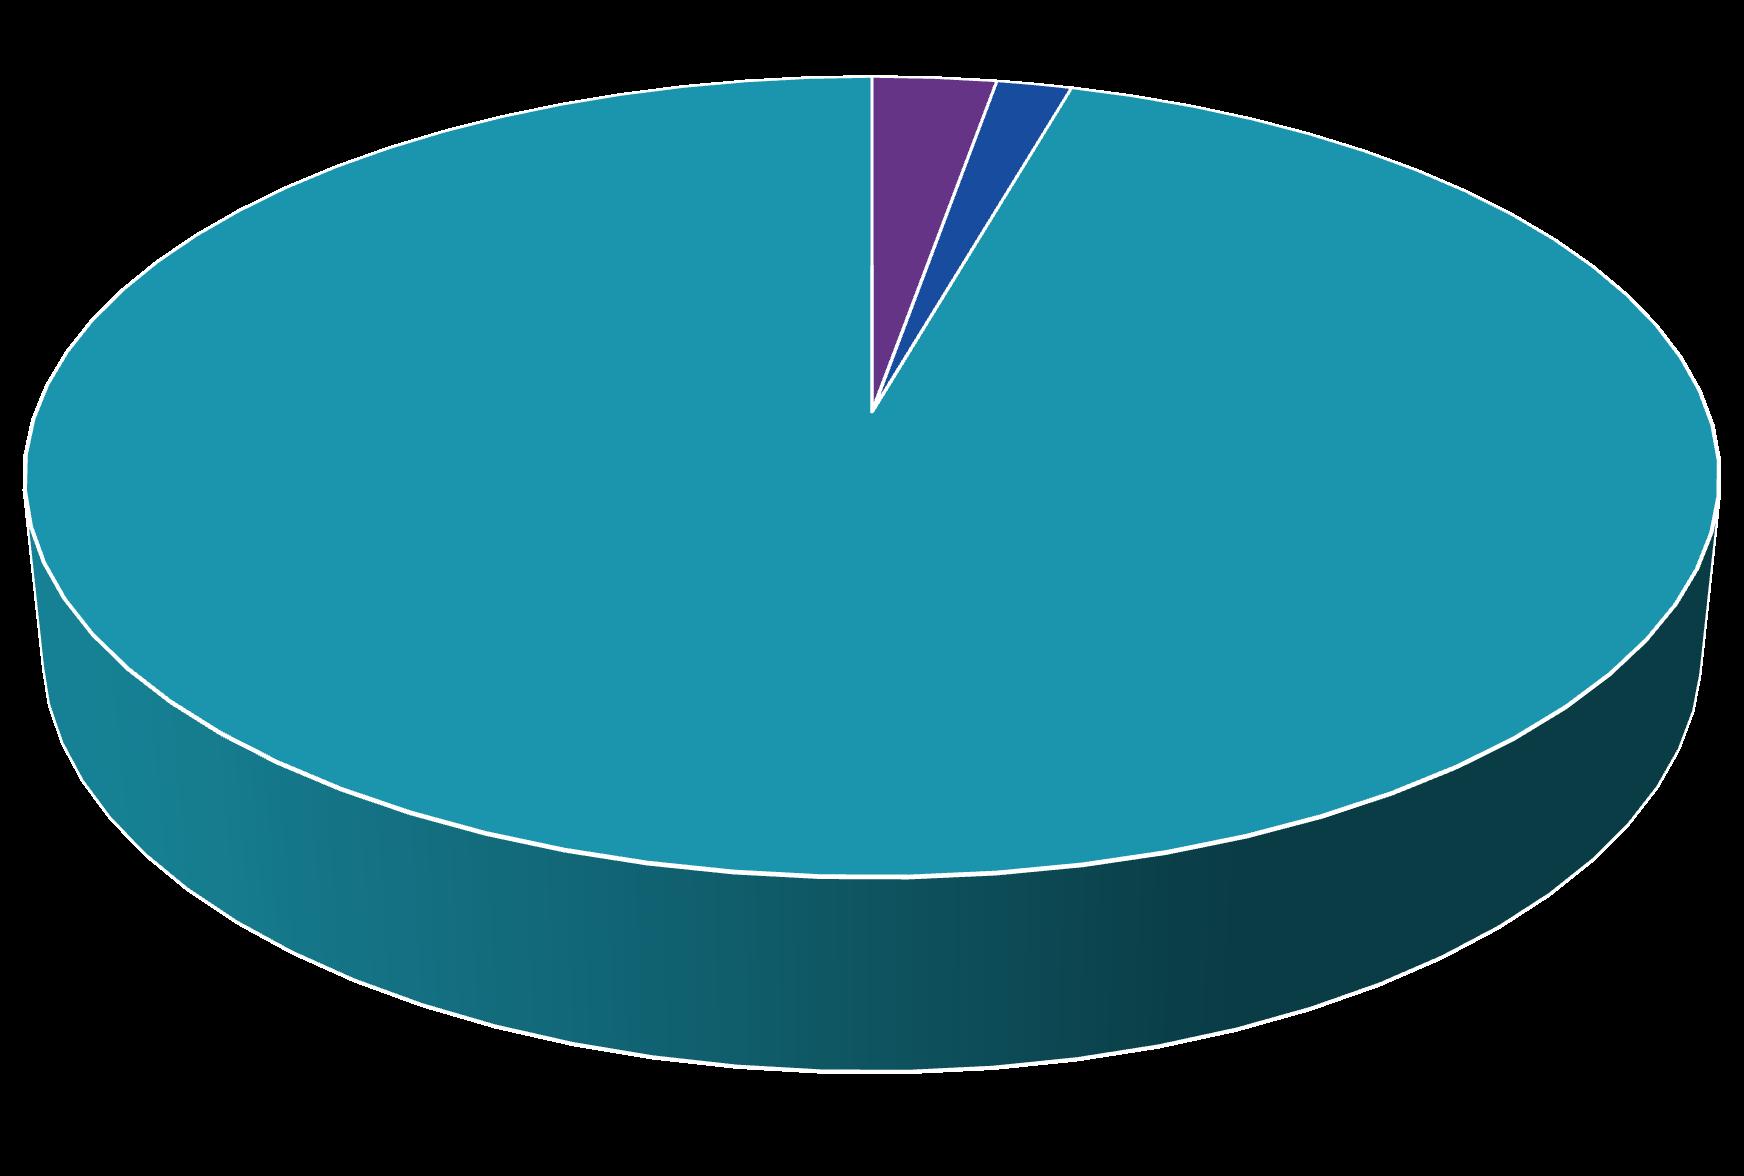
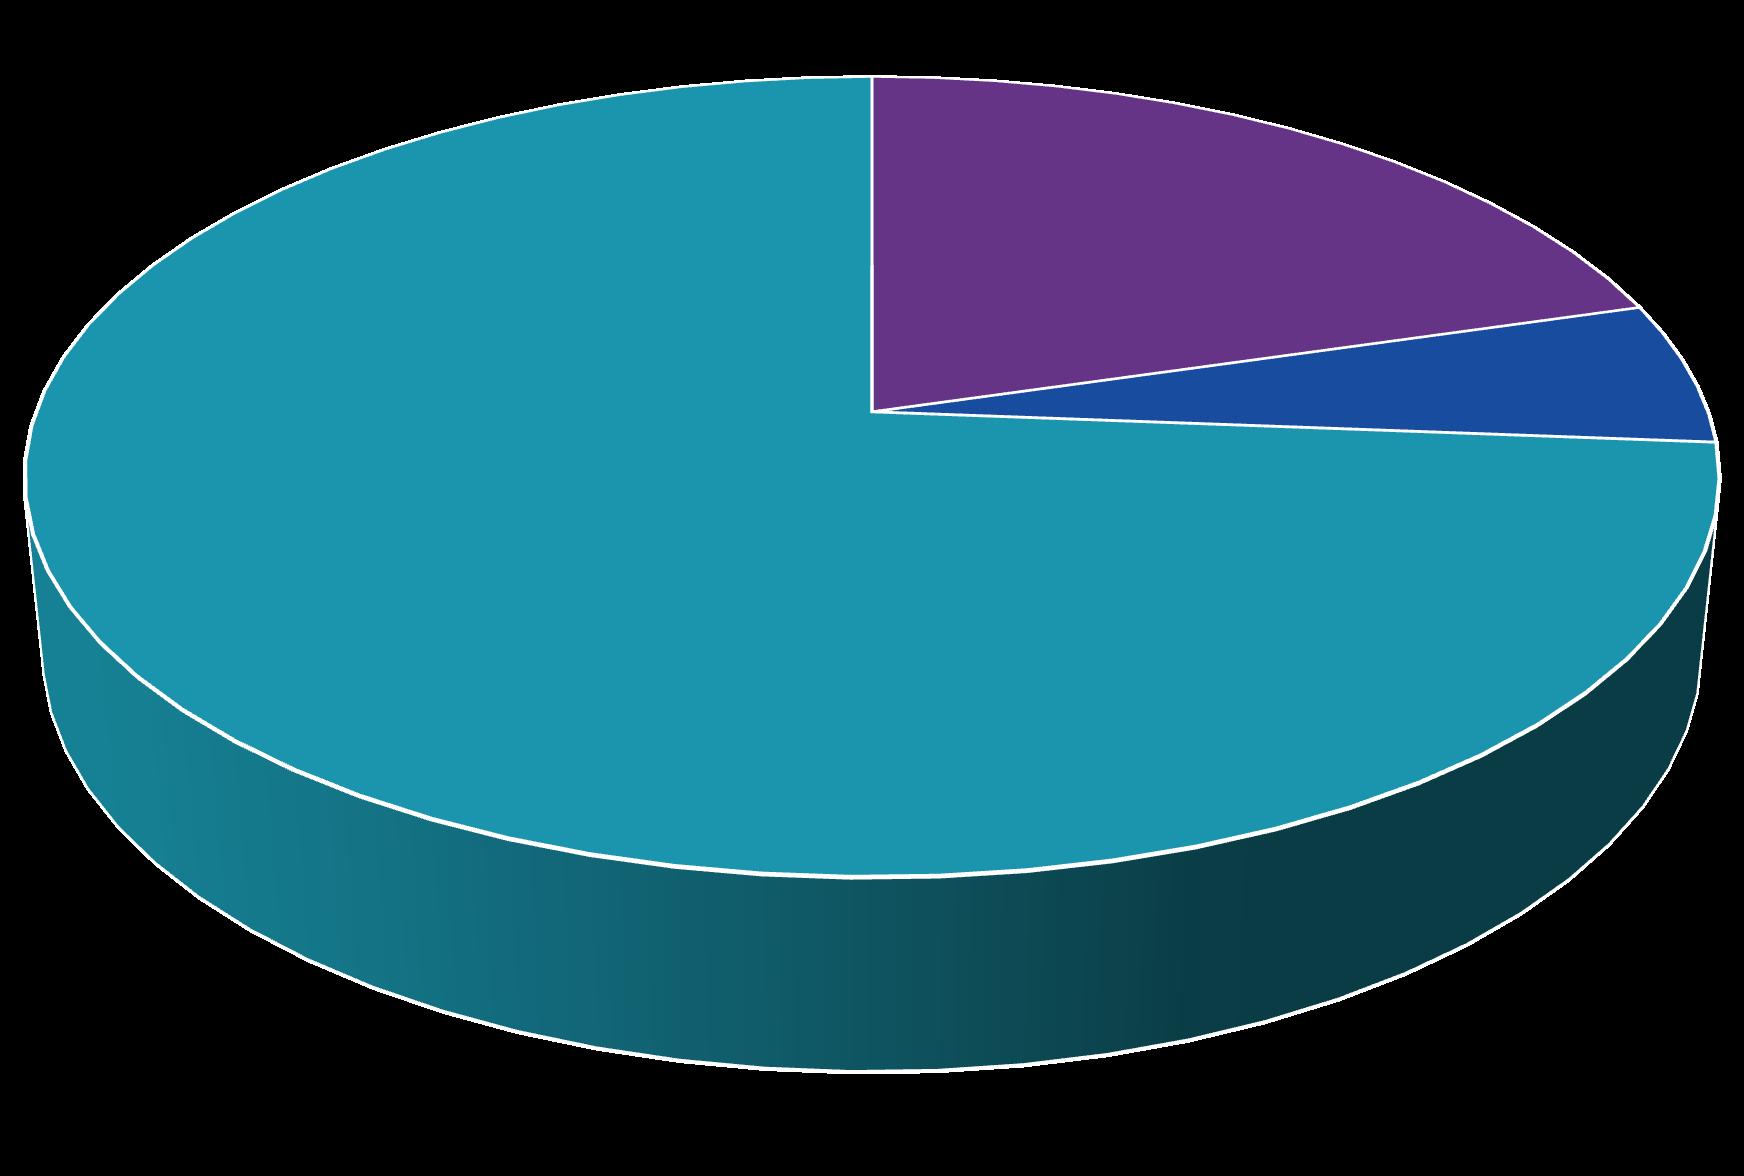
Potential impact on the parc
Market Trends & Innovation Update
Market Trends & Innovation Update
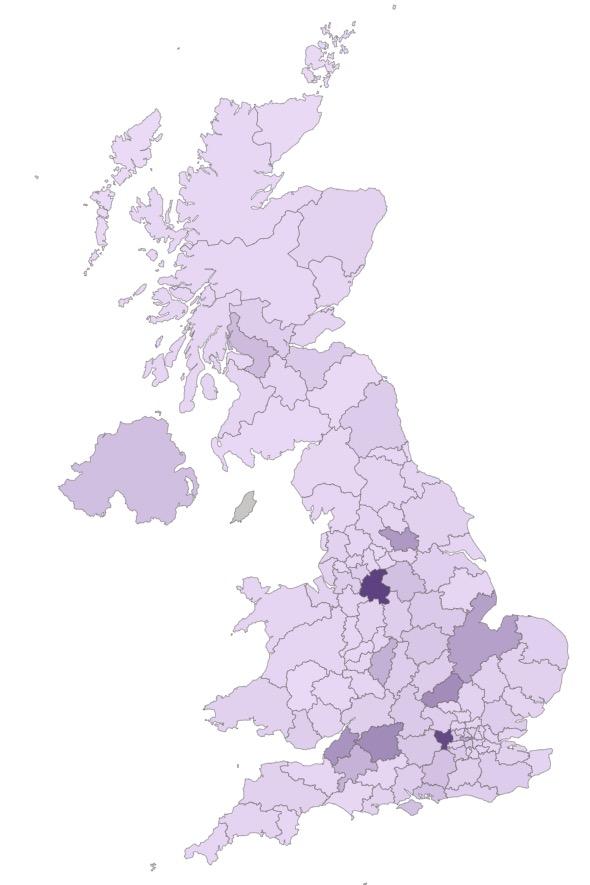
Where is “true” BEV demand?
What
if we could see…
Data: cap hpi
Market Trends & Innovation Update
Where is “true” BEV demand?
What if we could see…
Data: cap hpi
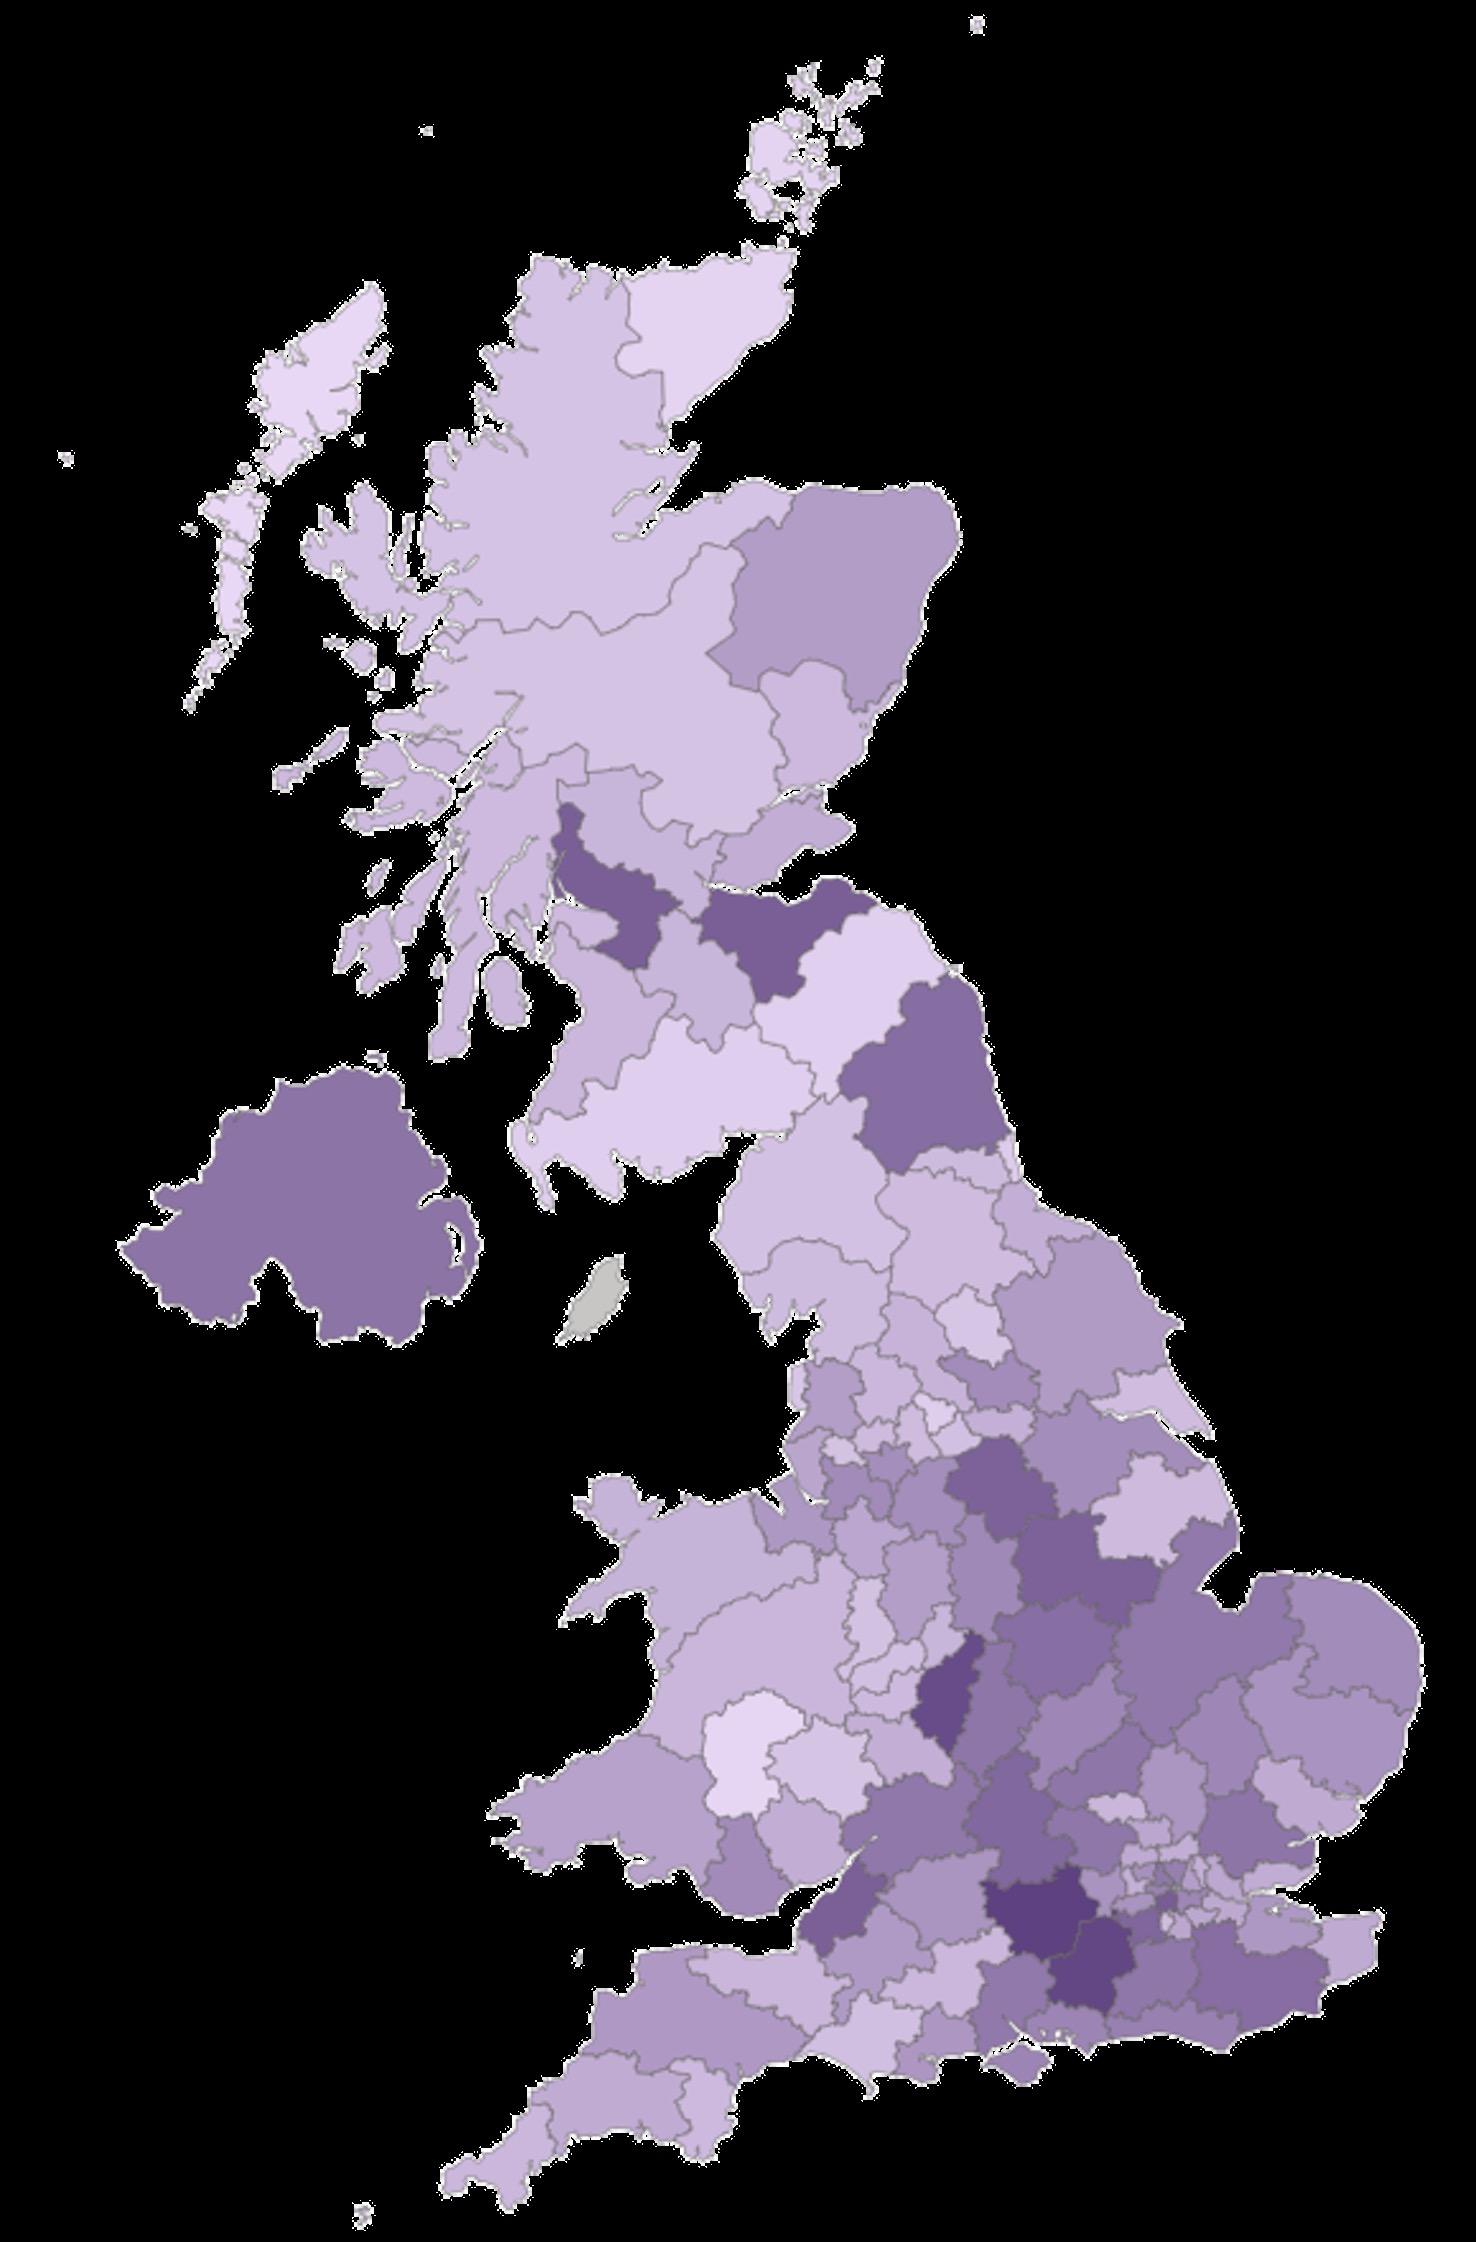
…just privately registered vehicles?
Market Trends & Innovation Update
Where is “true” BEV demand?
Top-10 Private BEV ranges in the UK
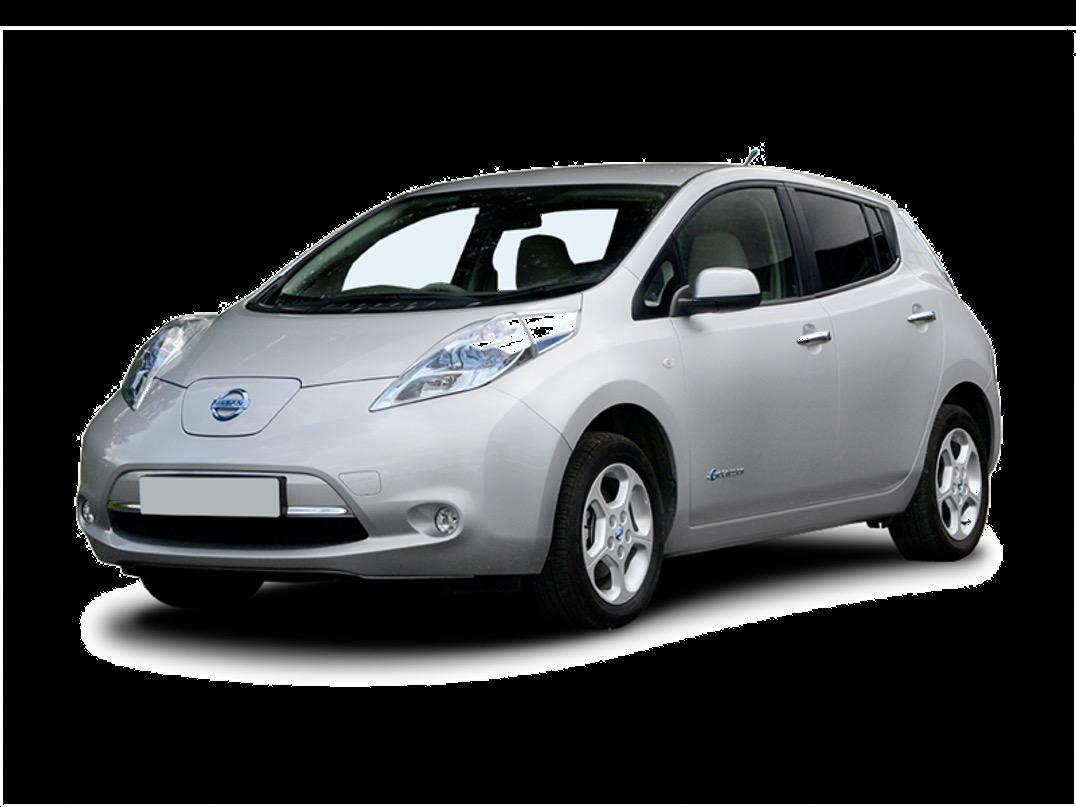
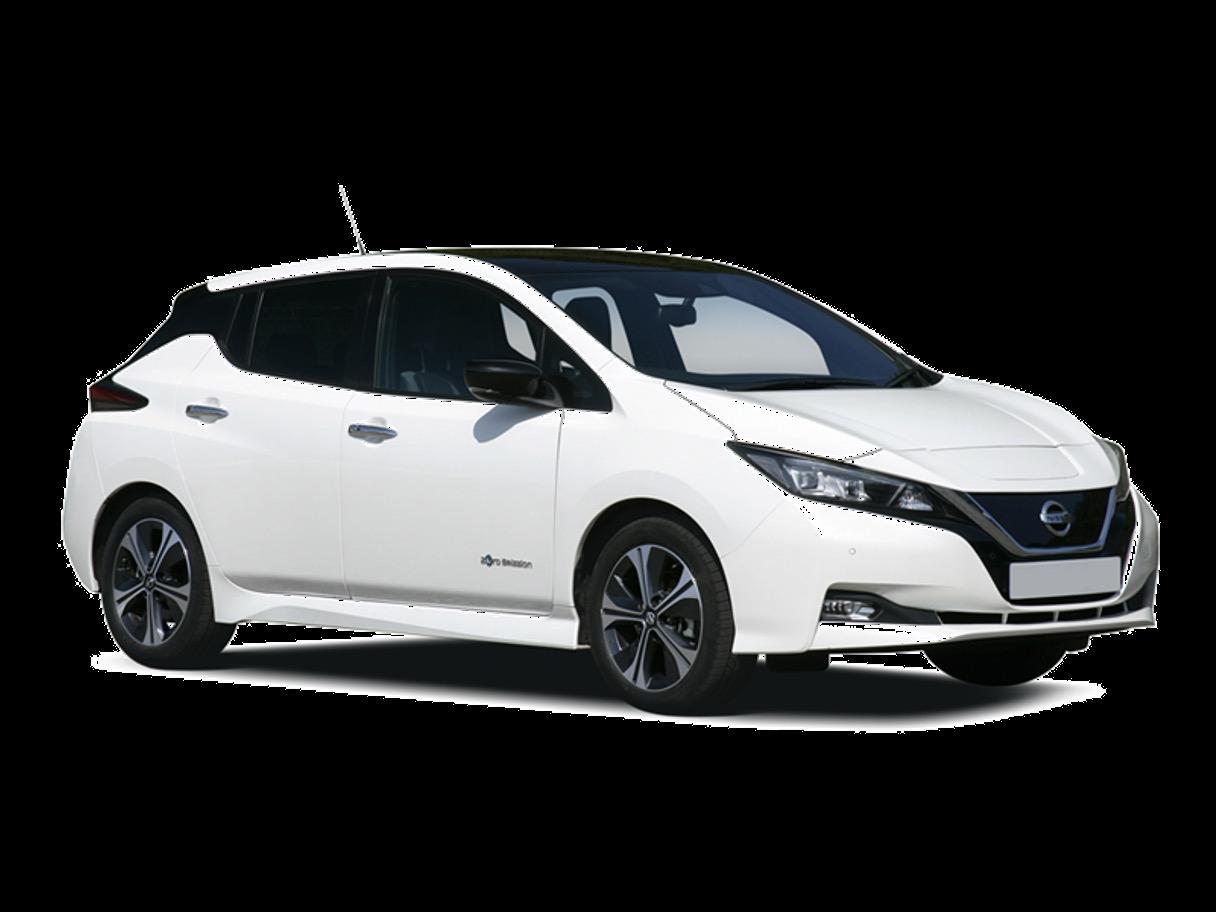
Data: cap hpi

Market Trends & Innovation Update
Where is “true” BEV demand?

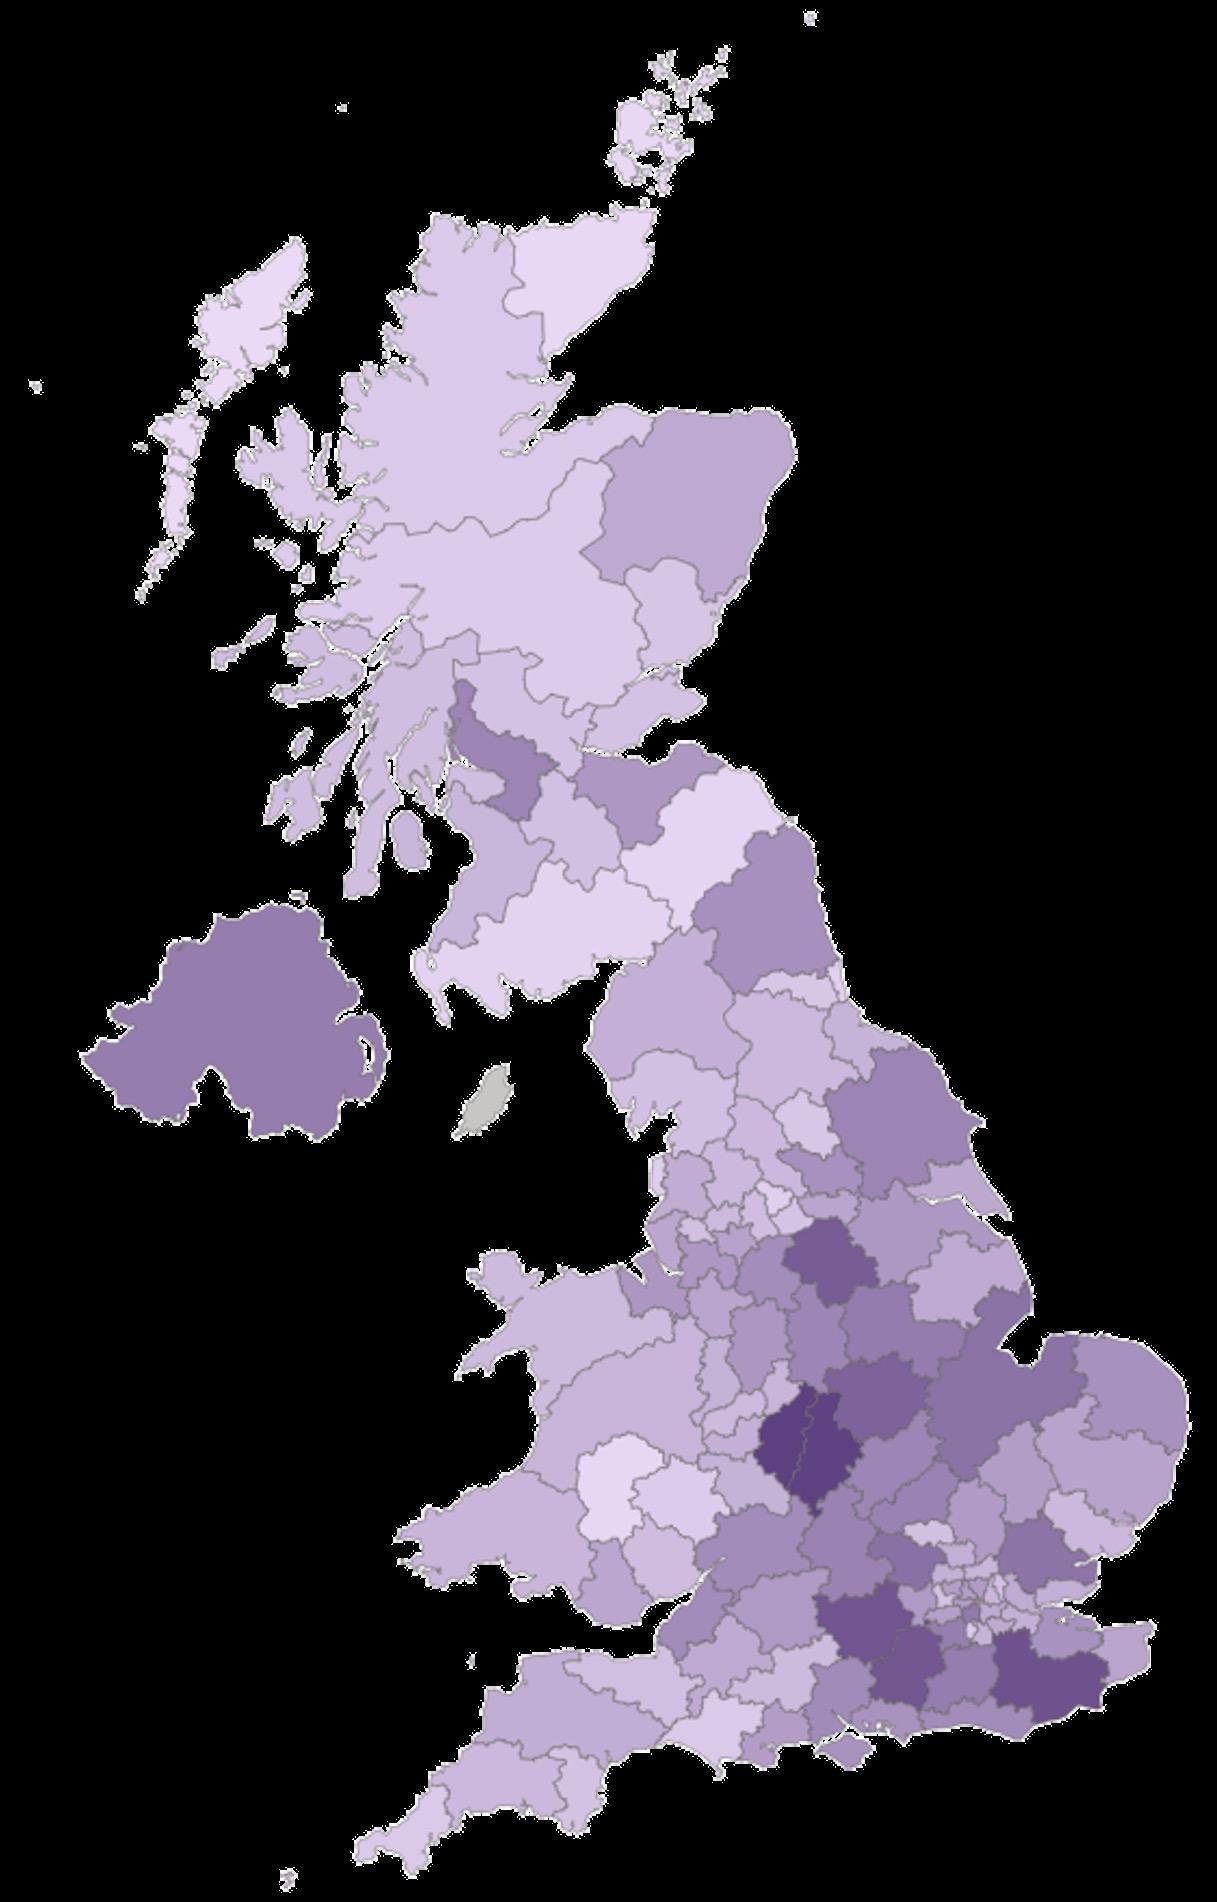
Market Trends & Innovation Update
Where is “true” BEV demand?
Market Trends & Innovation Update
Where is “true” BEV demand?
Data: cap hpi
Market Trends & Innovation Update
Total Cost of Ownership
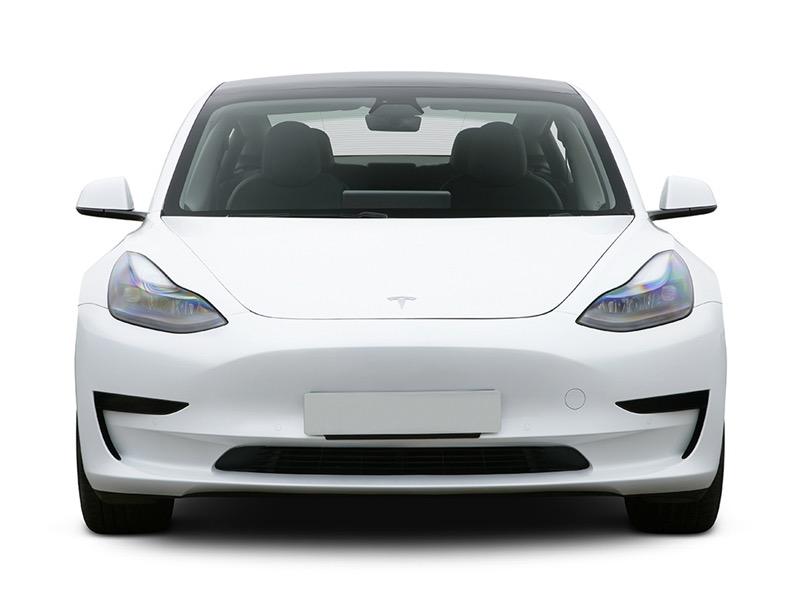
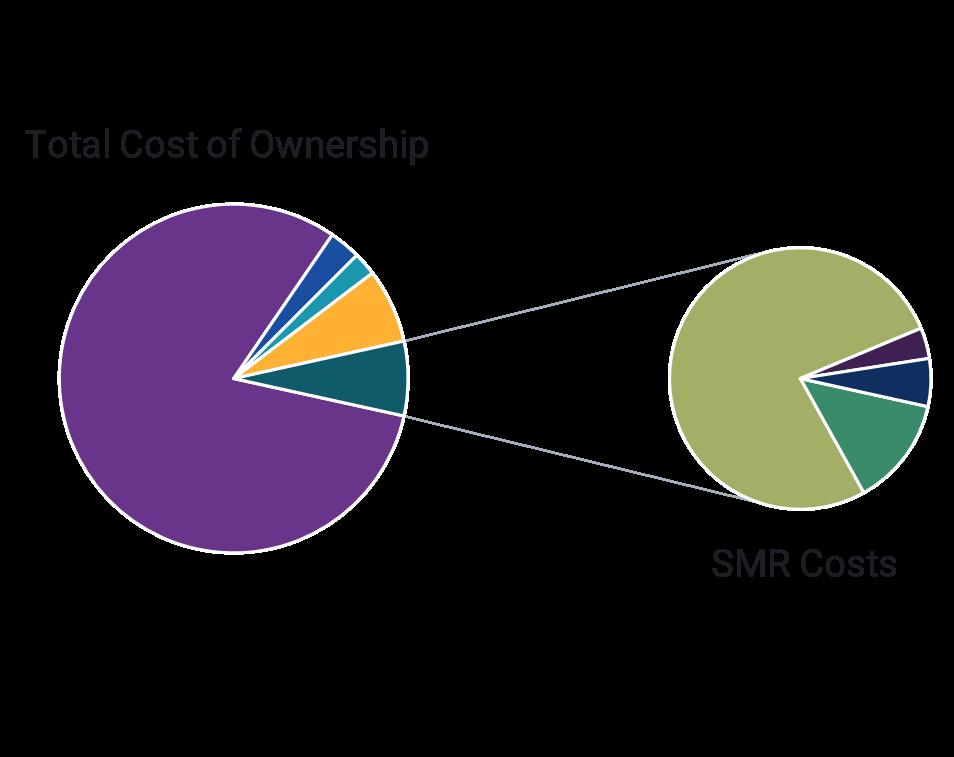
Impact of EV technology
New entrants to the market

£35,000 vehicle
written off as a door mirror could not be replaced!
Market Trends & Innovation Update
Where is “true” BEV demand?

on the





Where are they sold? Who’s selling them? Cost of ownership?
3. Impact of new technology
Impact of EV technology































Impact of EV technology
What creates value in a used car?






Impact of EV technology
Three key challenges:

Battery technology

• Reducing battery
costs
• Durability and longevity
• Accelerated obsolescence
• Infrastructure development

Impact of EV technology
Three key challenges:

Feature tech
• Autonomous vehicles
• Function on demand • New manufacturing techniques • Sustainability

Impact of EV technology
Three key challenges:

New brands
•
Chinese brand expansion
• Global market development
• Partners, collabs, M&A
• Business failures
Impact of EV technology
Impact of EV technology
Charging network development
Number of public charging devices available and share of rapid devices (OZEV) All devices Share of rapid
Data: OZEV / zap-map

Impact of EV technology
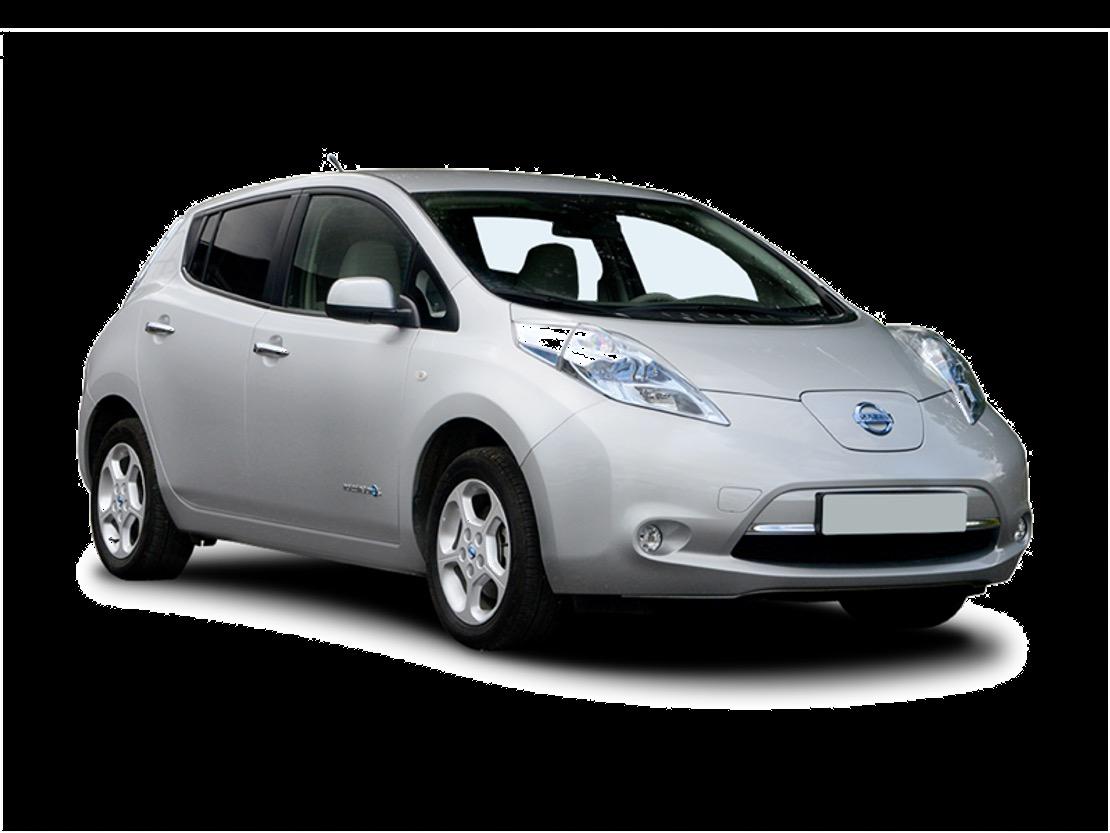
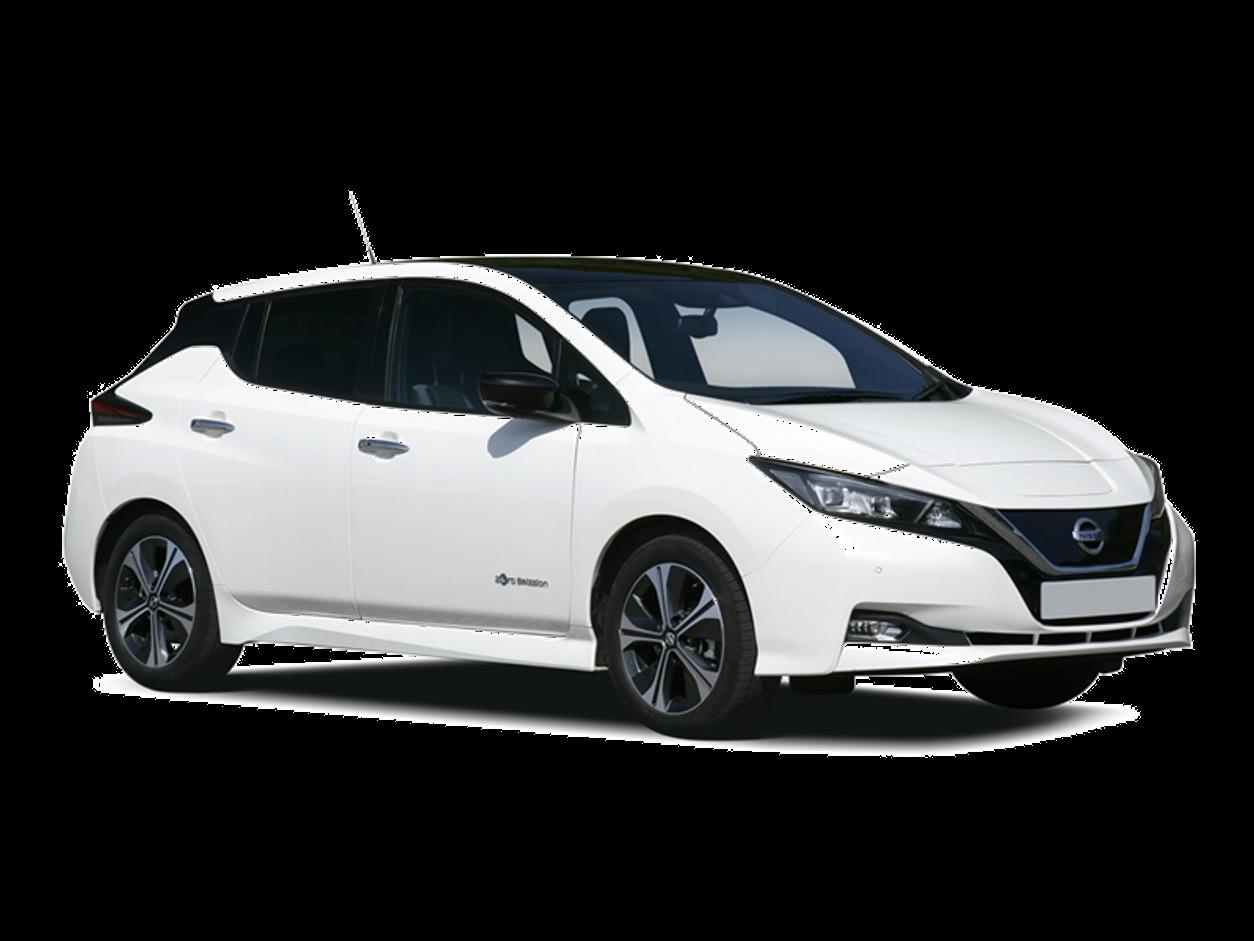
Battery technology issues


Data: cap hpi
Note:
for
Impact of EV technology
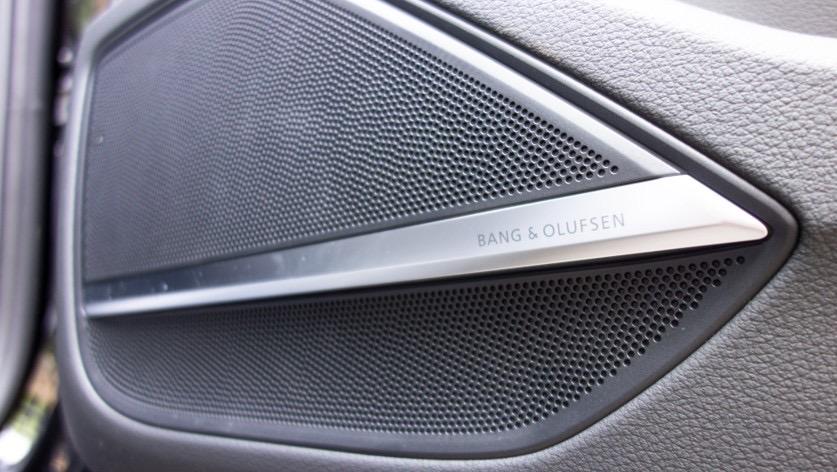






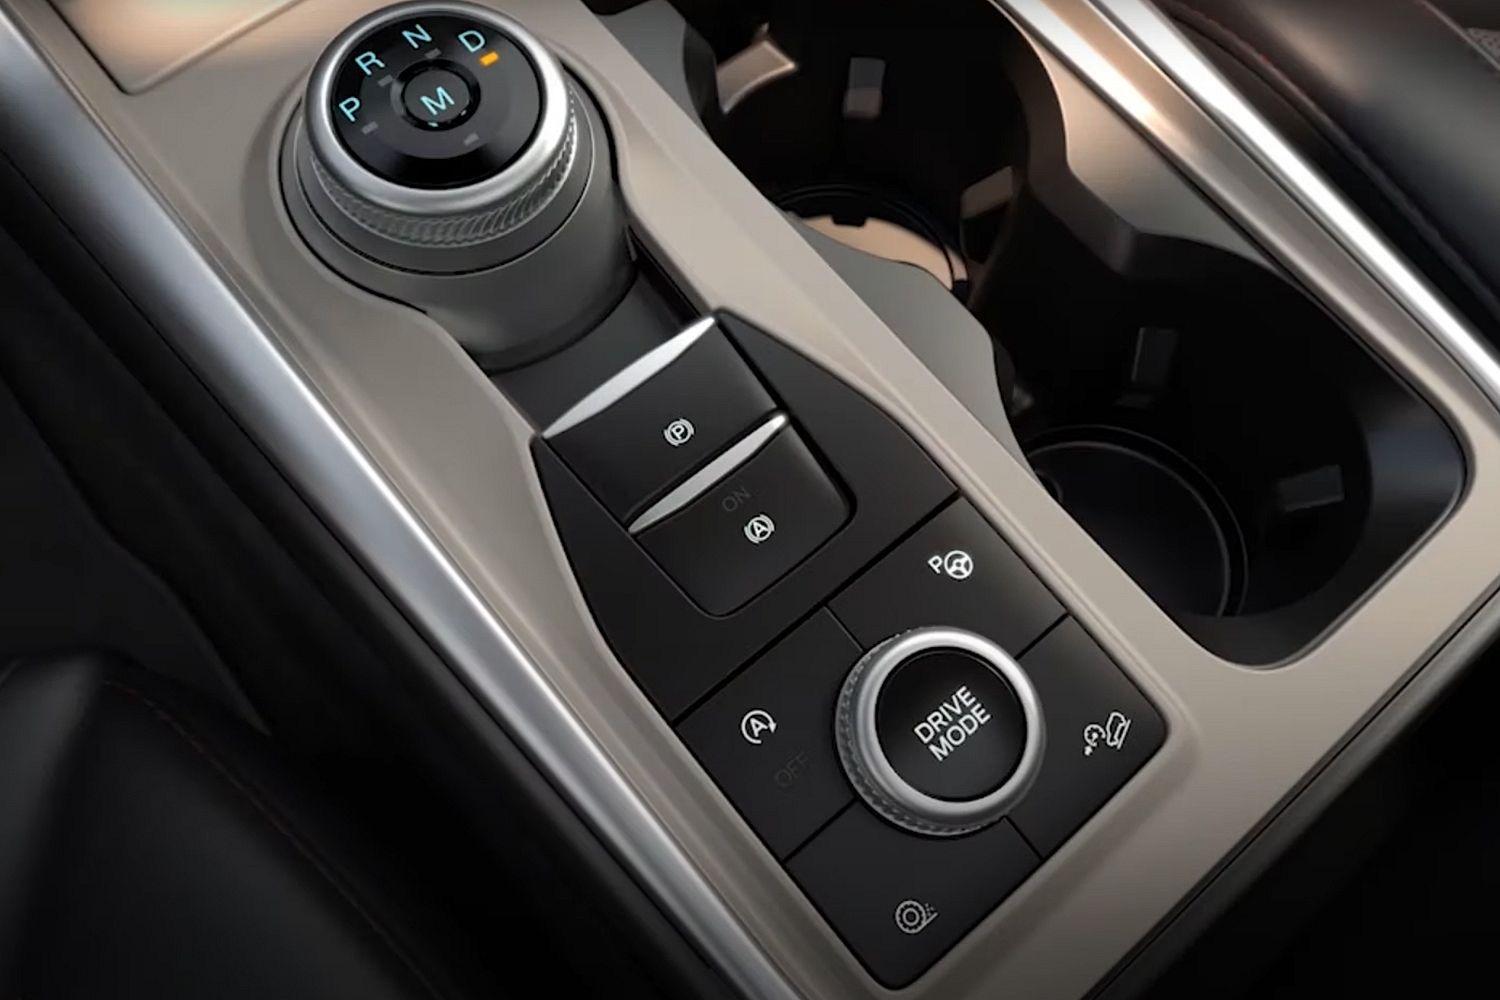
“According to Ford’s COO, very few customers are using the auto-park feature… … Ford is using connected vehicle data to analyse which features are being used and which are not, and to make decisions accordingly.”
Impact of EV technology
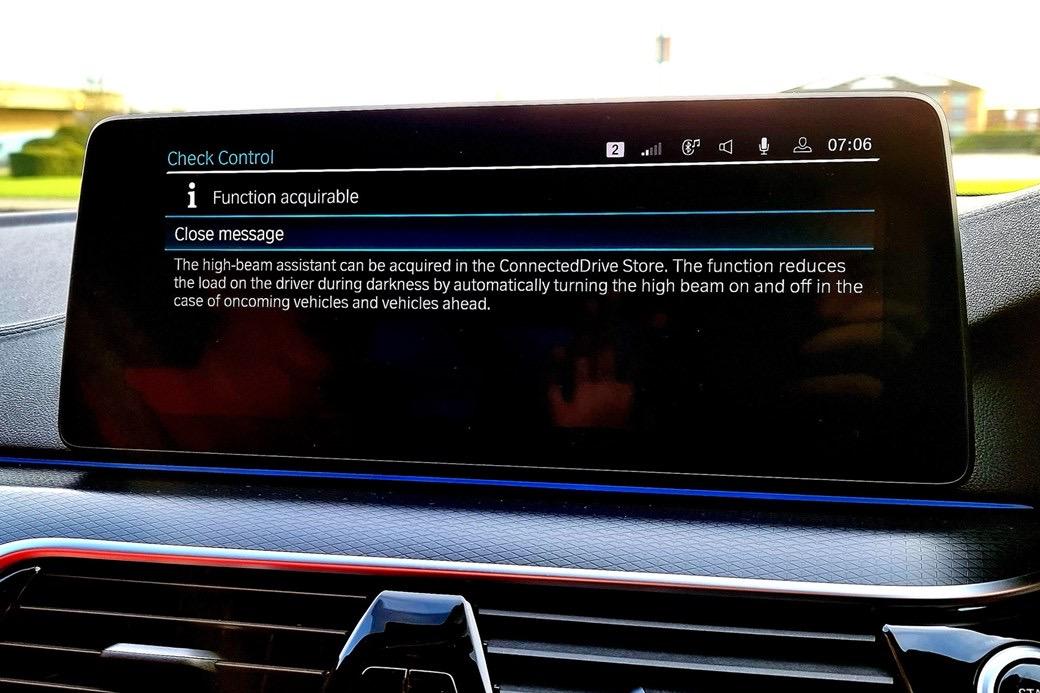
Function on demand
Impact of EV technology
New entrants to the market… and the challenges they face
UK New Registrations of Chinese-built Cars Chinese brands Non-Chinese brands
Chinese brand cars expected to be almost 10%
of
the UK market
Data: S&P (IHS)

Impact of EV technology
Exits from the market












Unprecedented change External forces will move consumers

Be prepared for turbulence

Consumers are on the adoption path
Data from across the industry
FIRESIDE
CHAT Today’s challenge, tomorrow’s normal?
Chris Downing Head of Sales & Operations
Stellantis

ZEV MANDATE BRIEFING
Key Features of ZEV Mandate:
• Minimum requirement registrations ZEV mix for 2024 onwards
Ø 2024 22% passenger car, 10% LCV
• Flexibility exists as follows:
Ø Trading between manufacturers (and those within a group can form a closed pool)
Ø ‘Borrowing’ from the future (if product plan suits)
Ø Offset available from excess CO2 performance (vs 2021 baseline)
Ø Banking excess for use in future years
• Fines of £15k per car and £18k per van (vans reduced to £9k in 2024 only)

KEYNOTE A glimpse into the future...
Tom Leggett
Vehicle Technology Manager
Thatcham Research


A glimpse into the future...
- VehicleTechnology Manager

TomLeggett
A: Assisted & Automated
C: Connected
E: Electrified
Predicting the future isn’t easy…


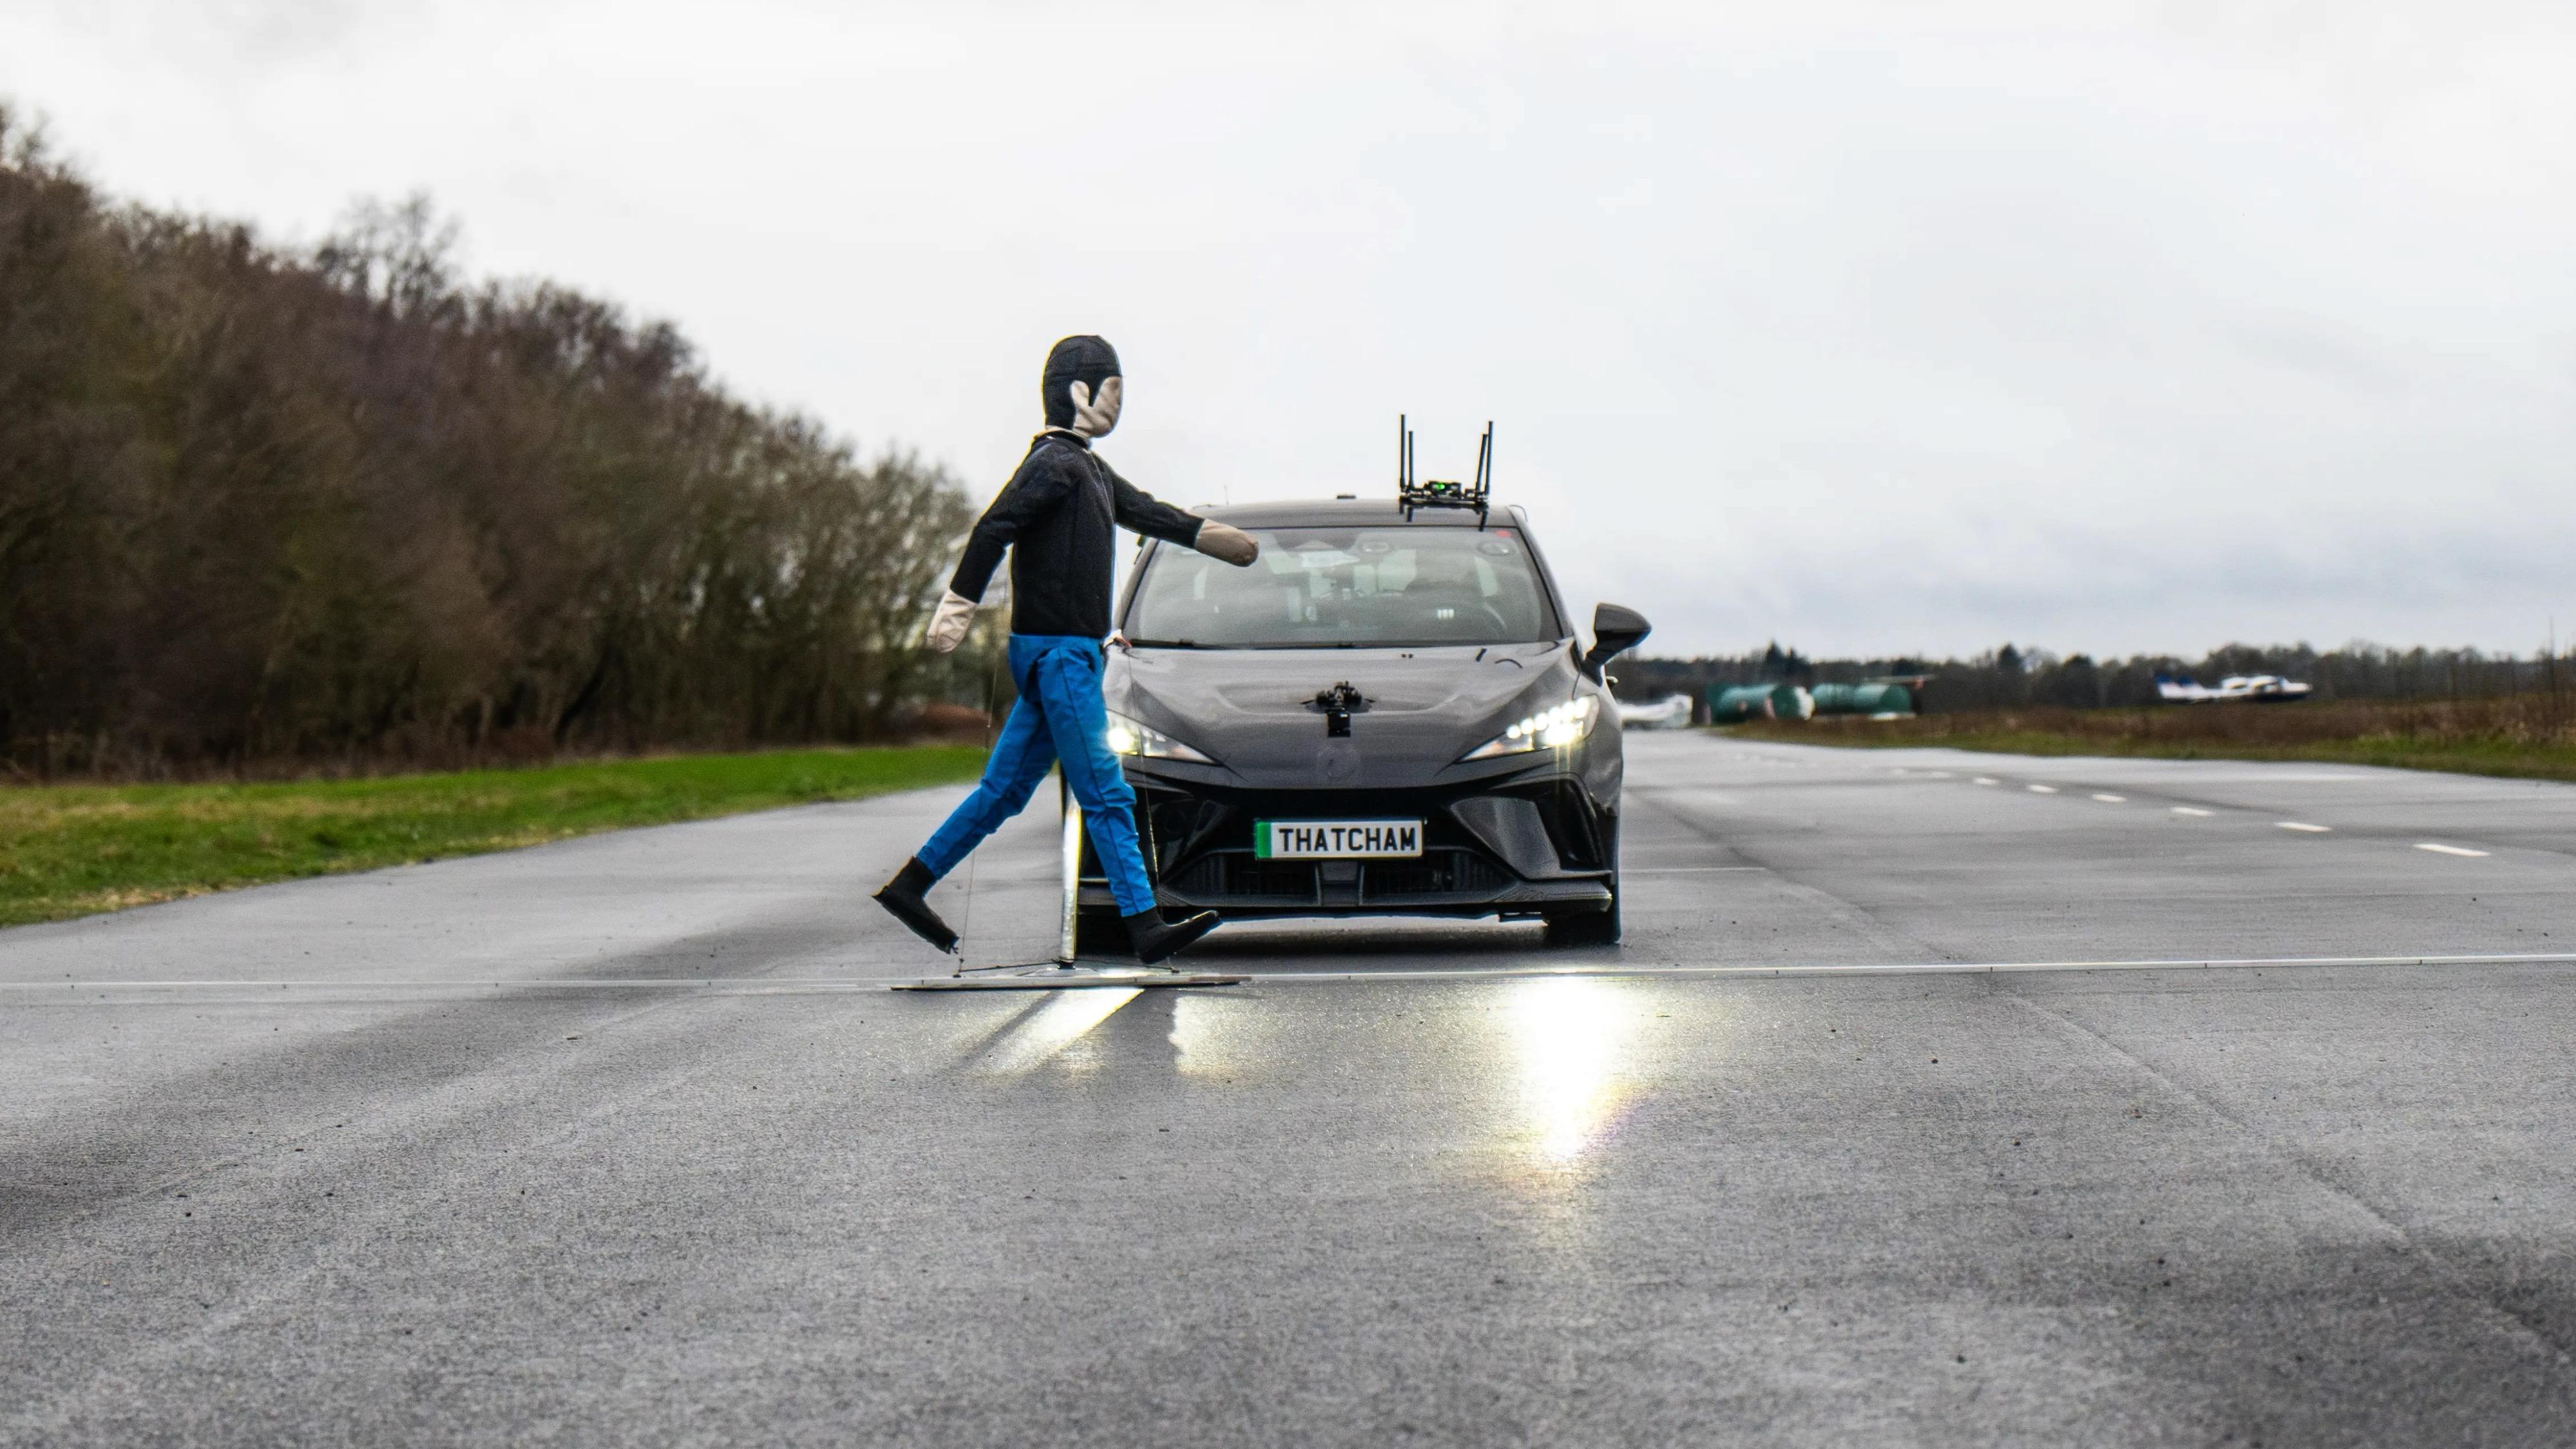
ADAS: Here to stay
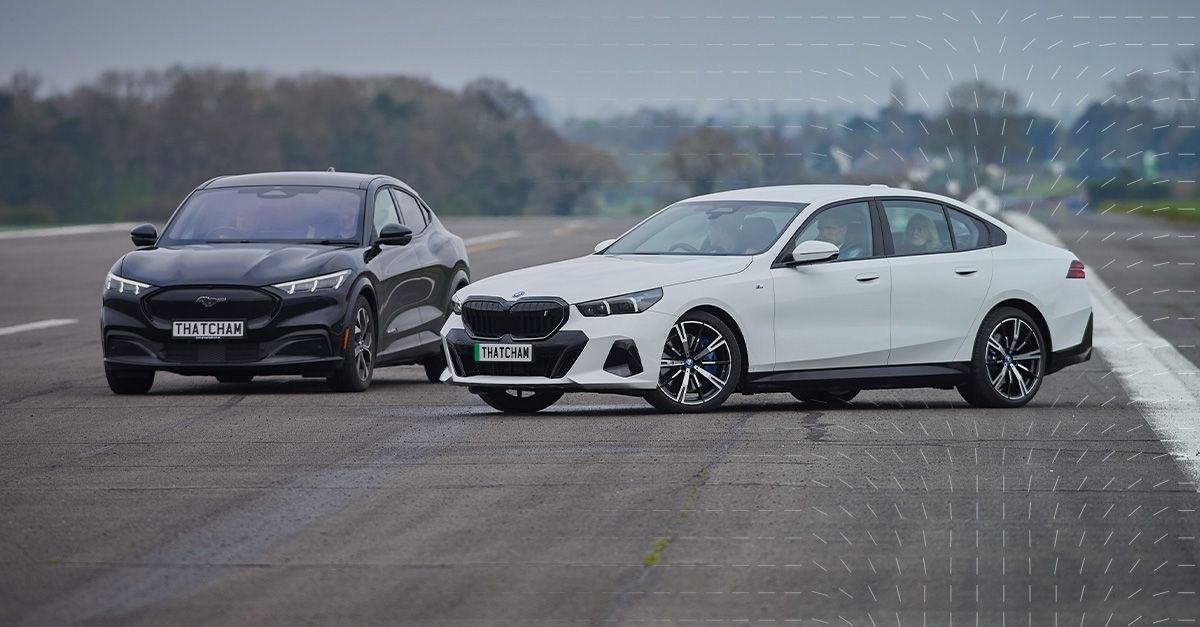
ADAS: “Hands Off, Eyes on”

-Small scale commercial deployments by 2027
-Extremely limited passenger vehicle deployment*
Connectivity:
-Data is the oil, AI the engine -Lines will blur between phones and cars

7 Thatcham Research – 27/05/24
Electrification:
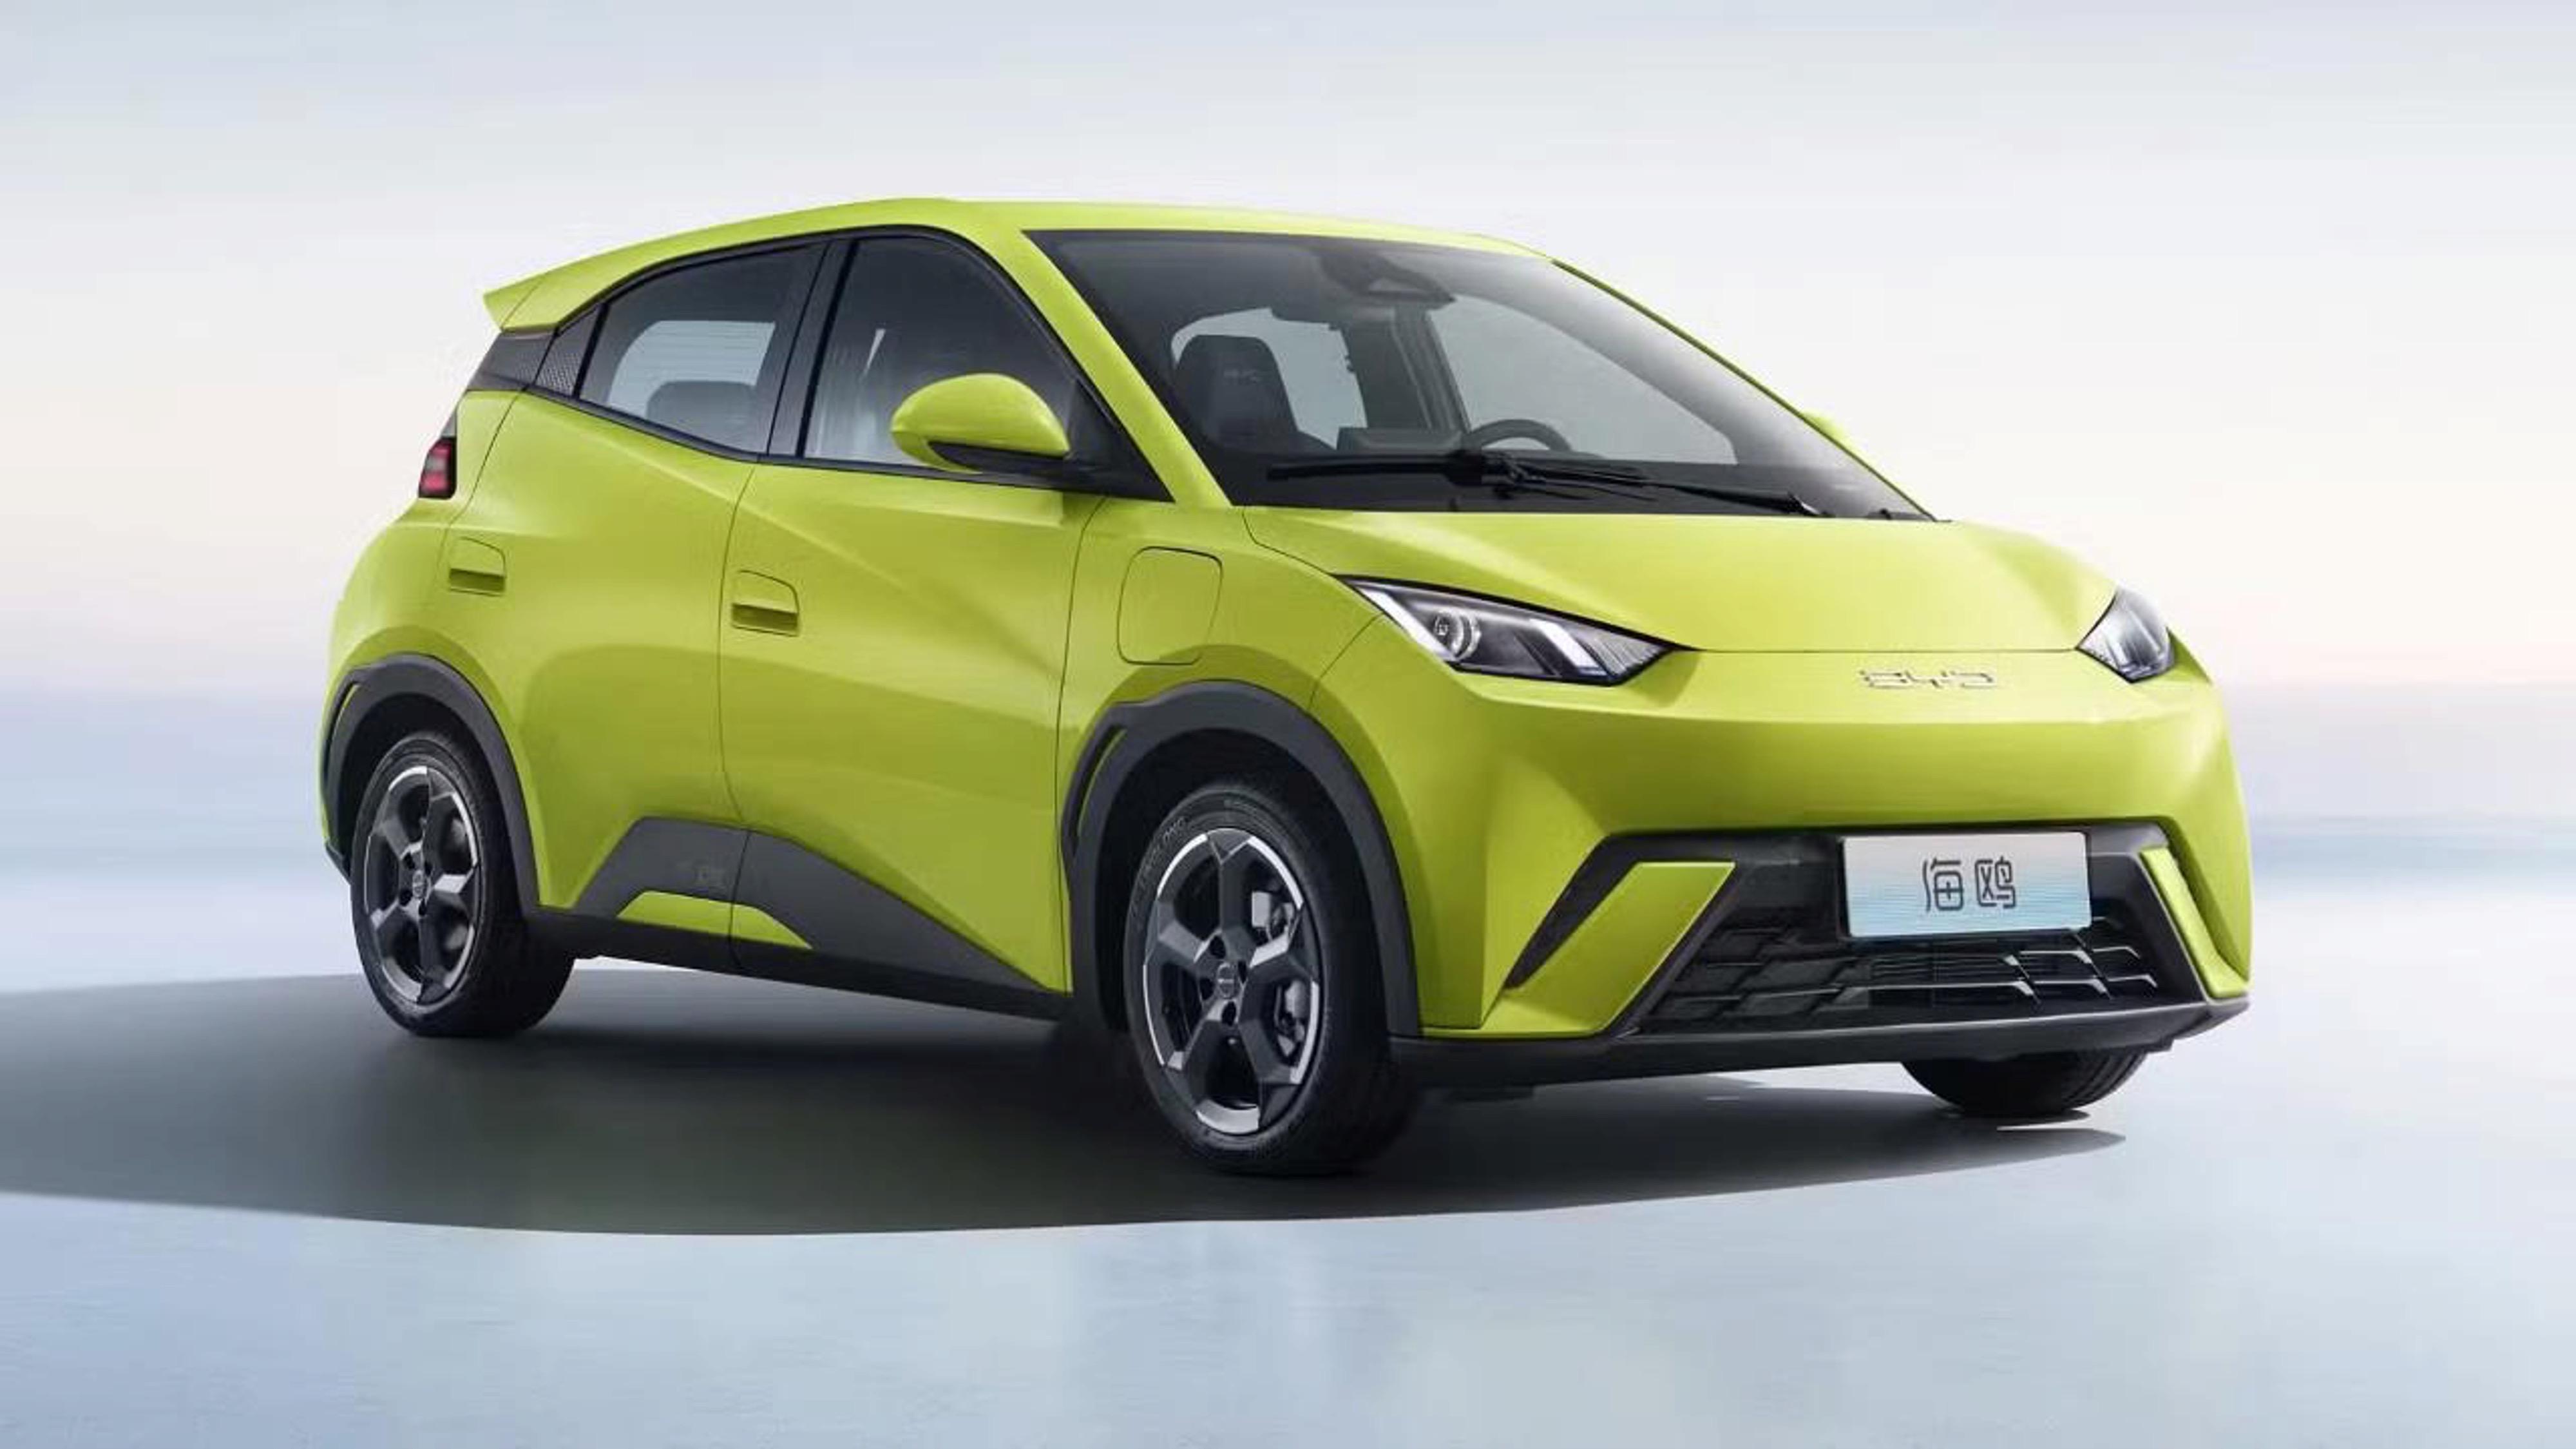
-The affordable EV will arrive in 2025 -NMC 40%, LFP 40%, Na/SS 20%
-Motivations for battery recycling over battery repair
One thing to take away… Don’t get left behind
Thank you

TomLeggett - VehicleTechnology Manager
Activate Group



EV pulse headlines
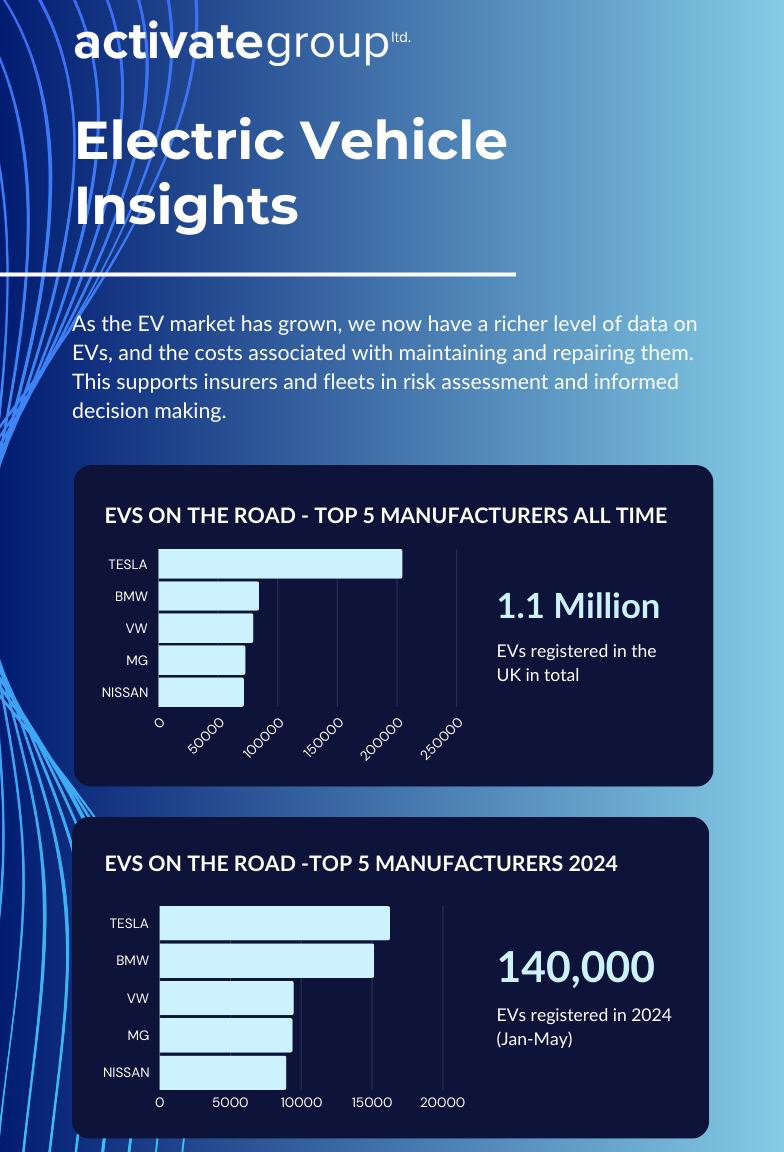
• 2024 new vehicle registrations - BMW challenges Tesla for EV market dominance
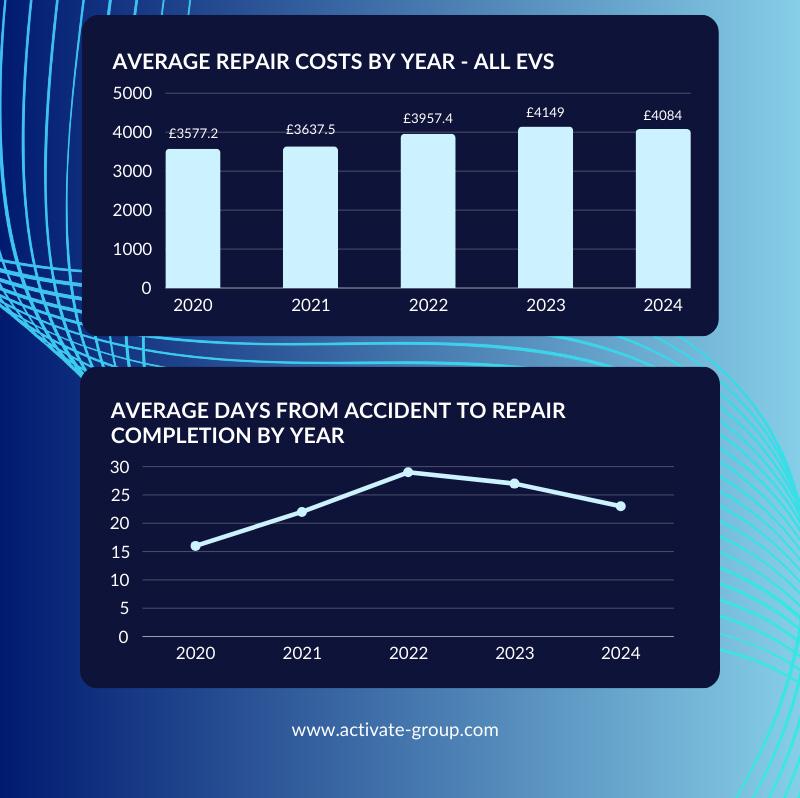
• Average EV repair costs down 1.6% year on year
• EV repair cycle times continue to fall from 2022 peak
Introduction
In the early days of the electric vehicle (EV) industry, the lack of comprehensive data posed significant challenges for fleets and insurers, making risk assessment and informed decisionmaking difficult. As the EV market has grown, we now have a richer level of data on EVs and the costs associated with maintaining and repairing them.
To provide valuable insights into this evolving market, Activate Group, the accident management specialist, is launching a quarterly EV report, utilising data from Gecko Risk. This report aims to offer comprehensive and up-to-date information on the latest trends and developments in EV repair, from average repair costs to cycle times.
Electric Vehicle Market
There are more than 1.1 million EVs on UK roads, and 55% of these have been registered in the last two years.
This is a sector of the UK car parc that’s growing fast Initially, this growth was driven by specialist manufacturers and early adopters like Tesla and Nissan. The Tesla model 3 is the UK’s most popular EV of all time, with 104,781 registered on UK roads.
Top 5 EV manufacturers overall
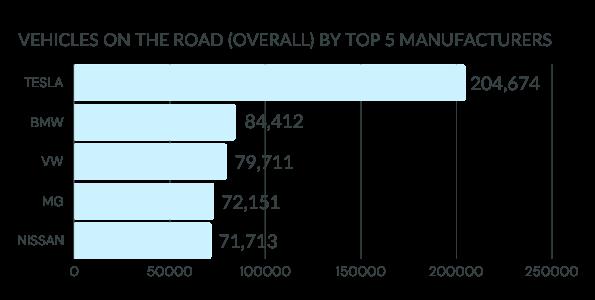
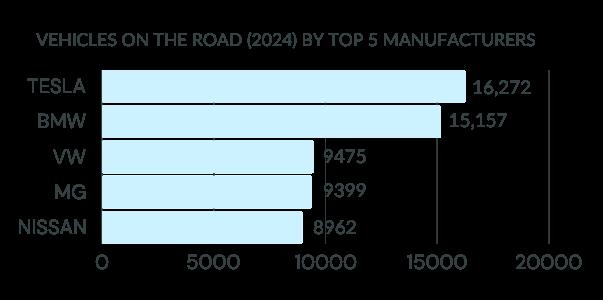
More recently, high-end marques like BMW, Mercedes and Audi have been building market share, challenging Tesla’s dominance in the EV market.
Top 5 EV manufacturers 2024
James Fisher, CEO of Gecko Risk commented: “To date we have seen battery electric vehicle adoption being predominantly driven by fleets and those who can afford the luxury of owning high value vehicles. At Gecko we are interested to see how the demographic of EV drivers changes over the next few years with less expensive models due to hit the road from Chinese manufacturers like BYD and Great Wall Motors. With younger drivers behind the wheel of BEVs the risk in this subsector will continue to evolve and will require up to date analysis.”
EV Repair Cost Trends
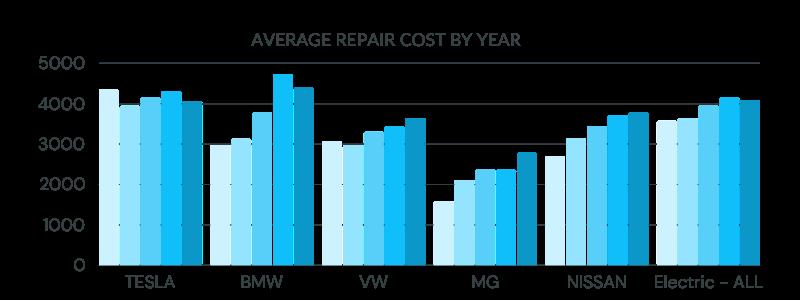
Figures for the first five months of 2024 reveal that average EV repair costs have come down from their 2023 peak.
This data bucks a five-year trend that has seen the average EV repair cost rise steadily from £3,499 in 2019 to £4,149 in 2023.
To date, the average EV repair cost for 2024 is £4,084, down 1.6% when compared to 2023. The reduction in EV repair costs is somewhat at odds with the market overall, as average repair costs for ICE vehicles continued to rise slightly in the first months of the year.
Adrian Furness, Managing Director of Motor Repair Network, Activate Group’s insurance division, said: “There has been a high level of investment in EV capability across the industry,



creating repair availability. With ncreased capacity and a reduction in repair volume across all vehicle types, we may see more evidence of average repair costs leveling out or reducing over the coming months.”
Average EV repair cost breakdown
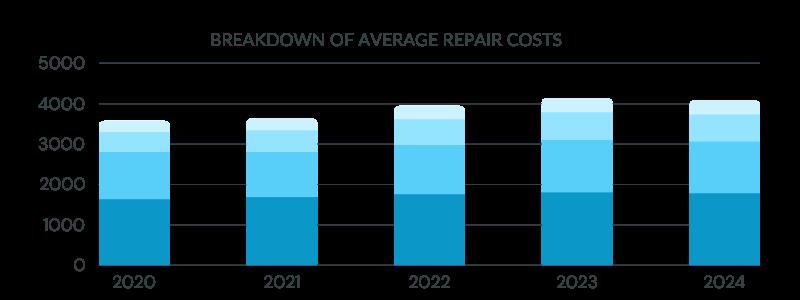
When we break down the cost of repairs, it’s clear that parts costs consistently represent the highest outlay
Data from the last five years reveals that parts costs account for 44% of overall EV repair costs on average.
Interestingly, Tesla repair data does not follow this trend. Here labour costs are consistently higher accounting for 42% of the repair cost in comparison to 34% for parts.
Mark Hobson Operations Manager for Activate Parts Activate Group’s wholesale parts division, commented: “In general, EVs are packed with technology and made of lightweight materials that are more challenging to repair than traditional ICE vehicles. This, coupled with low availability of green and aftermarket EV parts explains why parts account for a high proportion of the average EV repair cost
“Tesla stands out because repairs are usually completed by main dealers and manufacturer approved repairers, where labour costs are significantly higher. In addition, Tesla does not readily offer parts discounts which makes it more economical for bodyshops to repair rather than replace a part if it’s safe to do so.”
EV Repair Times
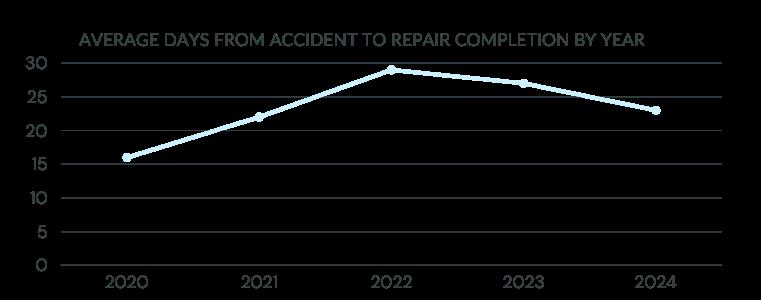
Looking at the full cycle time from accident date to repair completion, we see that EV repair cycle times have fallen significantly over the last two years.
Gecko data reveals that the cycle time peaked in 2022 at 29 days and is tracking at an average of 23 days so far in 2024.
June 2024
Adrian said: “This change is in line with the wider market, where there has been significant improvement in repair times across all vehicle types
“This has been driven by investment in new, state-of-the-art repair capacity as found in our own Activate Repair sites. In addition, we are seeing higher excesses and an increased rate of write-offs, which have a knock-on effect on repair availability.”
Conclusion
The electric vehicle market in the UK is undergoing rapid growth, supported by investment in training and equipment across the vehicle repair industry.
Increased repair capacity and EV capability, coupled with a reduction in repair volume across all vehicle types is helping to stabilise repair costs and bring down cycle times.
With the increasing availability of comprehensive data, fleets and insurers can now make more informed decisions, enhancing their ability to manage risks and costs effectively.
Activate Group’s new quarterly EV report, powered by Gecko Risk data, aims to provide crucial insights and trends, supporting stakeholders in navigating this evolving landscape. As the EV sector continues to expand, staying informed will be key to leveraging the opportunities it presents
Other Paint Labour Parts
Trend Tracker

Market Intelligence
June 2024



“Paul Sell, Associate Director, Trend Tracker
The recent trends in the automotive repair industry have sparked significant discussions and raised pertinent questions. Several key factors are influencing repair estimate volumes including the price of insurance, higher excess levels, and increased write -off thresholds. At the same time the market has created new capacity. Together these have created a rapid change in the supply Vs demand picture – something we explore here.
The industry has seen an increase in new sites and acquisitions. The most recent, notable ones being Steer Group's acquisition of Chartwell and M&A. This trend of consolidation and expansion indicates a growing confidence in the sector's future. This is no doubt based on some macro data which confirms more vehicles on the roads, more miles being driven, claims frequency almost back to pre-pandemic levels and the average car age being older – all pointing to a consistent demand of repairable vehicles.
In the short-term however repair volumes in May were slightly lower than in April and the same month in 2023. However, the decli ne is not as severe as some might suggest, indicating that the industry is not in the ‘crisis’ some consider.
A notable decrease in cycle times was observed, with a reduction of 10 days in May, which marked the lowest cycle time in ove r two years. This improvement in efficiency sees repairers working through work in progress (WIP) at a faster rate than new work coming in which, together with increased capacity from new sites, creates this perfect storm.
The expansion and increased capacity pose new challenges for work providers. While the growth is positive for the industry and customers, work providers must now adapt to the increased capacity. This adaptation could lead to pressure on repair rates and potential changes in Cat N (non -structural) t otal loss trends, as providers strive to balance supply with demand.
The interplay between insurance premiums, excess levels, and repair costs will continue to shape the market as the automotive repair industry undergoes significant changes driven by acquisitions, vehicle technology and the continued skills shortage. It’s change that will need to be carefully navigated.
Full details of all these market impacts in the latest Trend Tracker report visit: https://www.trendtracker.co.uk.

Motor Insurance – Increased prices following increased repair costs (2022/23) leading to increased excess levels and consumers looking at cover options
(ABI, Consumer Intelligence, Go Compare, Nimble Fins, Oxbow Partners, Trend Tracker)
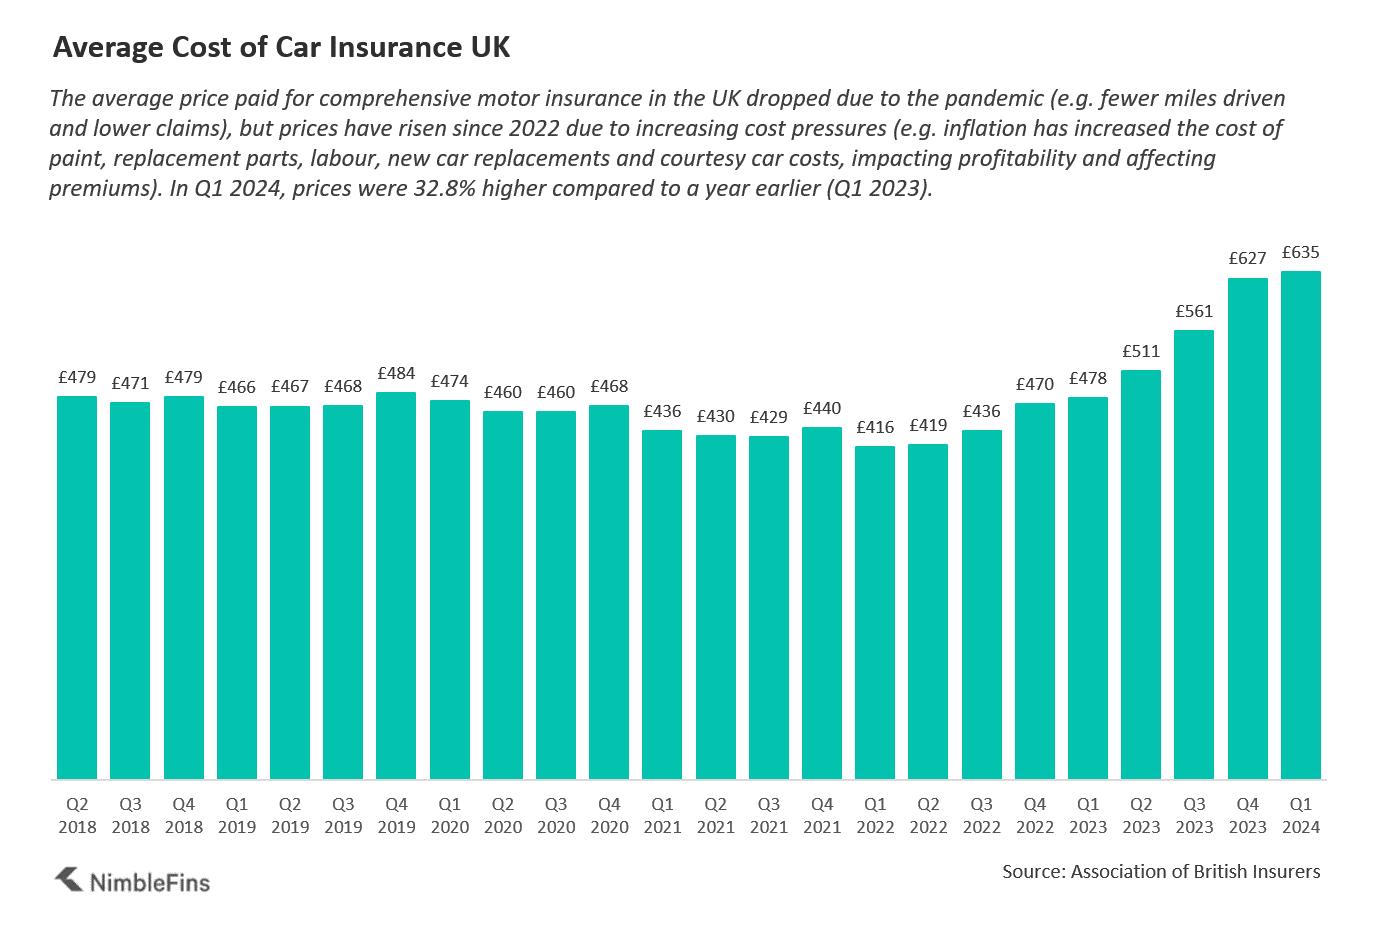
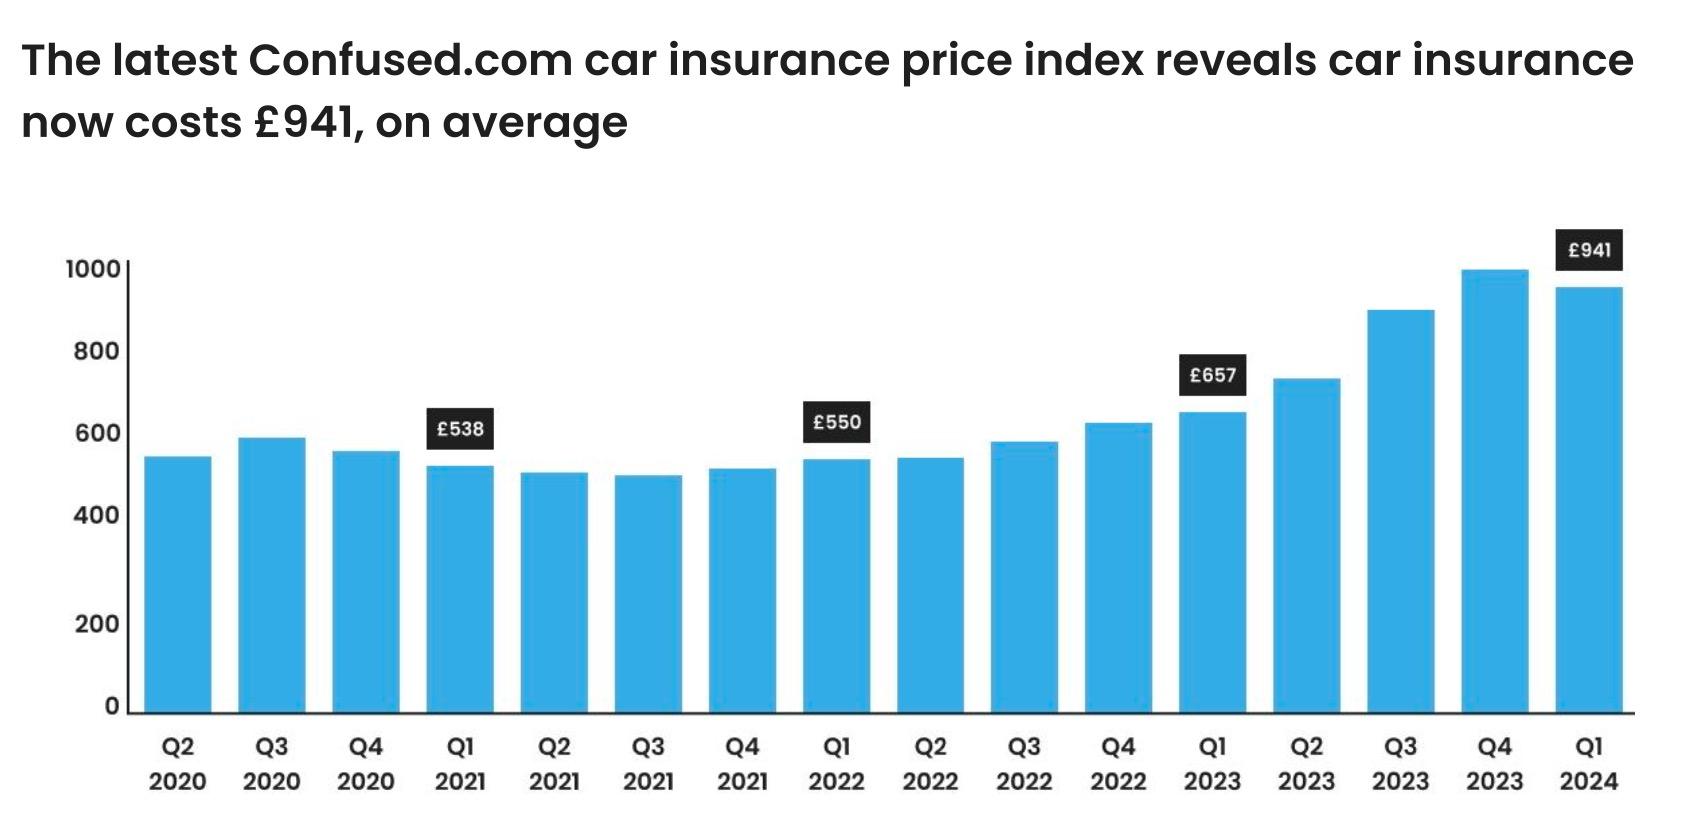
• ABI – 2023: ‘Insurers are spending more on claims and costs than they are collecting in premiums.’
• Oxbow Partners: ‘As 2023 premiums are earned through, this will drive up gross earned premiums and generate better profitability in the market. We expect COR of 94% in 2024, rising to 95% in 2025 as volume targets come back into the minds of executives and shareholders causing rates to fall again.’
• Consumer Intelligence: Tracking significant increases in premiums through 2023 as all insurers sought to combat claims inflation. Price increases seen in the graphs above from Nimble Fins and Consumer Intelligence.
• Go Compare: ‘seen an increase in the number of people choosing a £500 voluntary excess, from 20 percent in August 2022 to 23% in August 2023.
• Confused.com: ‘average voluntary excess chosen by its customers had hit a record high.’

UK Car Parc:
Increased miles driven, cars in households and average age of vehicles
(
Dept. of Transport, Trend Tracker.)
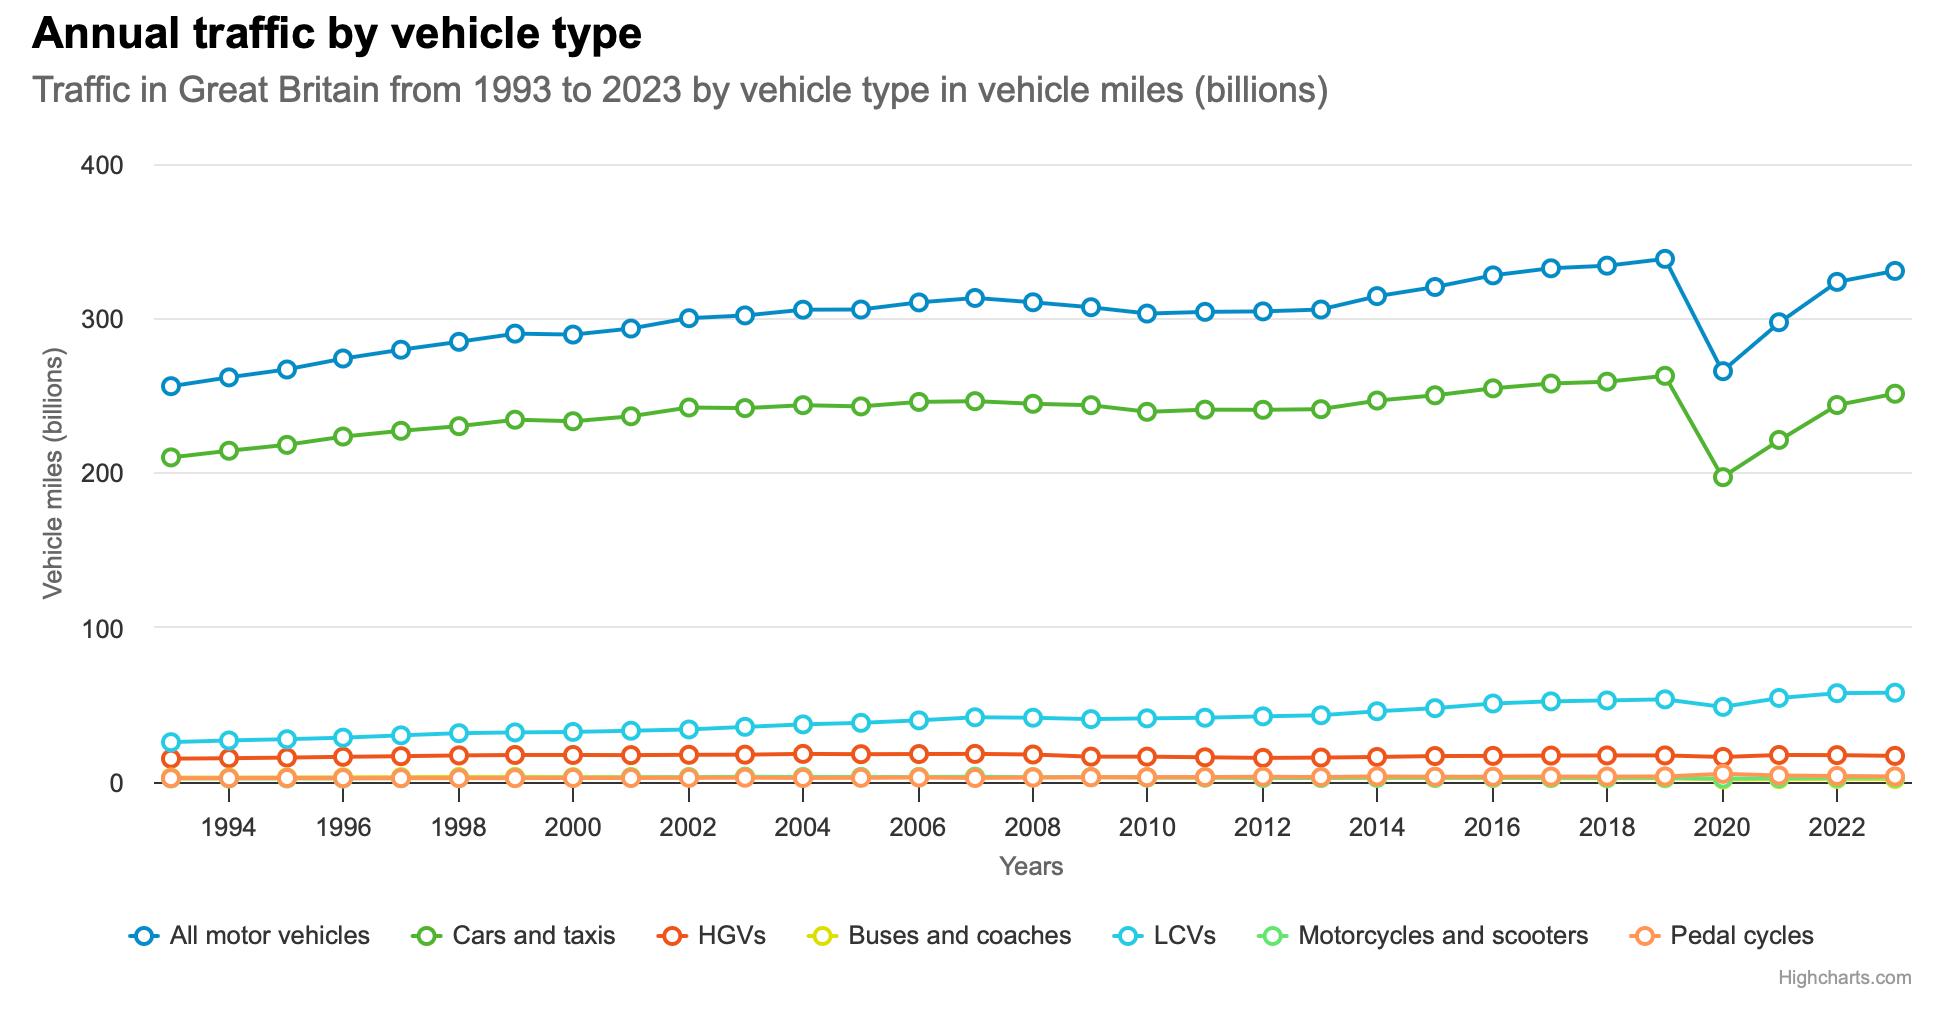
• Dept. Transport - 330.8 billion vehicle miles were driven on Great Britain’s roads in 2023, an increase of 2.2% compared to 2022. Traffic has been building but in 2023 was still 2.3% lower when compared to 2019 pre-pandemic levels.
• Dept. Transport - In 2023, the number of new vehicle registrations showed an increase of 16%, when compared to 2022.
• At the end of December 2023, there were more than 1,015,000 licensed zero emission vehicles on the road, representing 2.5% of all vehicles.
• Dept. Transport - At the end of December 2023, the average age of a licensed car in the UK was 9 years old, an increase of 16% compared to the end of December 2018. Alongside this, Car ownership trends have continued (bouncing back from pandemic) with more homes having at least 1 car in the household.

Vehicle repair volumes & costs - both now steady
(Audatex, Trend Tracker, Synetiq)
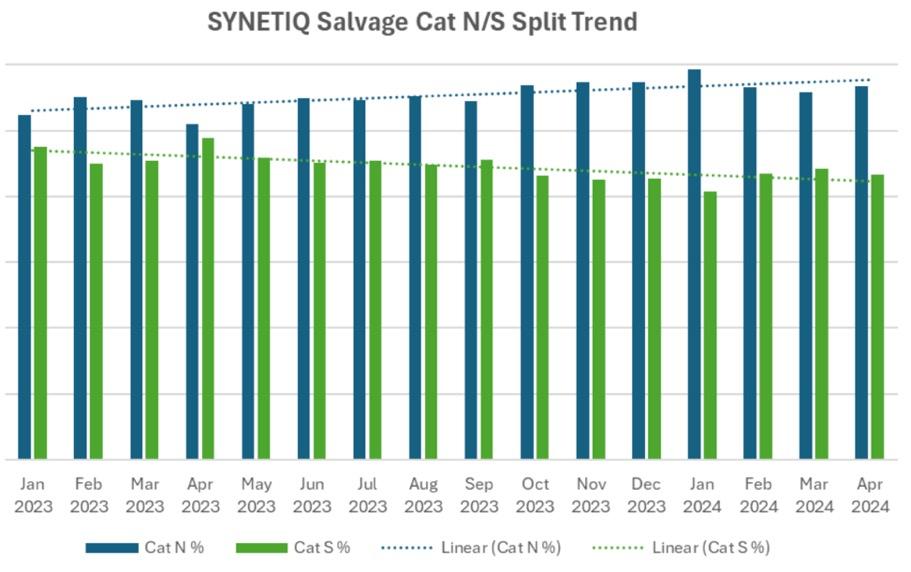
• Repair estimate volumes growing year on year?
- April 2024 - 33% higher than April 2021; 10% higher than April 2022 and 13% higher than April 2023
- On a YTD basis 2024 2% higher than 2023
• Repair costs – have continued to climb at a rate higher inflation, but increases are starting to slow - March, April and May consistent repair cost value with a small fall in May.
• Unsurprisingly, as repair costs rose - with the used car market stable - CAT N total loss volumes have increased over the past 12 months. Also influenced by increased EVs which statistically have a higher write-off rate and high lead times in the repair market through 2023 increasing associated costs of claim eg mobility – making a total loss decision more likely.

Market Capacity – lead times falling, new
sites and aquisitions
(Audatex, Trend Tracker, ABP)
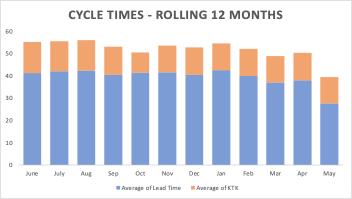
• Cycle times have fallen in recent months, with lead time especially improving following reduction of work in progress.
• The ratio of repairs Vs number of bodyshops had been climbing post-pandemic as claim volumes increased and the number of bodyshops didn’t. This has changed in the last six months with new investment, acquisition and new sites opening, driven through the increased value/repair costs making the market attractive.
• The demand graphs both reflect this change with 2024 volumes starting slowly but available capacity increased – creating some concern amongst the market.
• Since April, we are seeing a more predictable level of repair volumes (2% higher than 2023) but, this work will be competed f or by more bodyshops leading to some being concerned about work volumes. This is likely to continue to reduce lead times which could create a diff erent economical decision point for Cat N total losses as we progress through the year.
Thank you
June 2024