11 I January 2023 https://doi.org/10.22214/ijraset.2023.48623
ISSN: 2321-9653; IC Value: 45.98; SJ Impact Factor: 7.538 Volume 11 Issue I Jan 2023- Available at www.ijraset.com

ISSN: 2321-9653; IC Value: 45.98; SJ Impact Factor: 7.538 Volume 11 Issue I Jan 2023- Available at www.ijraset.com
1
Basavaraj Pachapur2
, Vinay Deulkar , Jitendra Chouhan31
2,
Post Graduate Student, 3Professor, Transportation Engineering Jawaharlal Institute of Technology, Borawan, Khargone (M.P)Abstract: Infrastructure development is key for economic growth of a country. However, poorly planned and deficiently designed infrastructure facilities becomes hazardous to the public. This leads to frequent fatalities in densely crowded cities like Pune. To minimizing fatalities by improving existing infrastructure facilities is game changer to overcome this problem. In India and around the globe many crowded cities are transforming with Metro rail networks to make urbanites life easy. In this study we have analyzed safety measures and evaluated Level of Service (LOS) for At-Grade intersections, along metro rail corridors in Pune city. This study gives good to fare idea about current safety situation of At-Grade junction based on various parameters viz. Junction Design, Pedestrian Facilities, Public Transport Facilities, Impact of Metro Infrastructure etc. The data used in this study is mostly open sourced data from Mappls RealView 360, Google Street View and site inventory. This study can be used for wide scale implementation for crowded cities, which may helpful in multimodal infrastructure development.
Keywords: Level of Service, LOS, Safety Analysis, At-Grade Intersection, Metro Impact, Junction Design.
The economic development of a country is measured based on its road transport infrastructure. Here, I want to mention our honourable Road Transport Minister Shri. Nitin Gadkari. He often says the famously quoted words of US President John F Kennedy: "American roads are not good because America is rich, but America is rich because American roads are good." These words speak volumes about the significance of road infrastructure. India is fast growing and fifth largest economy in the world. Such growth will come from industrial and service sector. Most of the economic activities in these fields take place in urban areas. The state of our cities is key to India’s economic growth. Further Indian cities are crowded with 35% of its total population. Across the world it has been experience that as economies grow, rapid urbanization takes this projection to over 70% before it begins to stabilize. As Such, the statistical projection studies says that, 90 Crore by 2050. As against ~50 Crore in 2021.
By considering rapid urban developments, urban areas must not only meet the transport needs of the current population but also to be adequate for future urbanites yet to join. In this context, the study of the existing road infrastructure becomes crucial by considering future population and vehicular growth. One of the prime concern on Indian roads is fatalities and injuries caused by traffic accidents. The road accident rates per million population have been increasing from the past three decades. As per NCRB data, 1.15 lakh people lost their lives in road accidents in 2007 which raised to 1.35 lakh in 2010 and 40 lakhs during the year 2012. This clearly shows that, the road accident problem in urban areas cannot be solved without improving existing road infrastructure facilities. Which gives an importance to Level of Service evaluation and safety analysis of At-Grade intersections. This study method can be further used for larger scale in both urban and rural areas, for better management & upgradation of At-Grade intersections, for achieving better road safety.
Many researchers have worked on safety related topics, I haves studied (Bhatt Bhasker Vijaykumar et al.,2011) on Evolution of mechanism for road safety audit of urban roads, as case study conducted for Surat. 2 roads of Surat city were studied for various stages to check the safety for users on such roads. A rigorous accident analysis is carried out in the study with available data and compiled statistics from different police stations. Road safety audit was carried on two different stretches with different stages and situations, in first case the road which is under up-gradation scheme and conceptual design stage is accomplished.

ISSN: 2321-9653; IC Value: 45.98; SJ Impact Factor: 7.538 Volume 11 Issue I Jan 2023- Available at www.ijraset.com
In second case the road under audit was opened to traffic one year prior to the study. The audit was performed on the road segment and issues regarding safety for road users were identified and all issues were addressed with possible recommendations and suggestions.
In one of the research, (El-Said Mahmoud Zahran et al., 2019) on reducing Road Traffic Accidents (RTA) and their socioeconomic costs is an increasingly important priority in many countries. In recent years, many authors have proposed various approaches to analyses historical RTA data using Geographic Information System (GIS) tools, so that locations with high instances or risk of RTA. i.e., RTA hotspots or blackspots – could be identified and ranked. This could then enable limited road engineering resources to be priorities for remediating more critical RTA hotspots and therefore reducing RTA rates. This paper presents the development of a new validation methods to evaluate the application of four different hotspot analysis methods in ESRI ArcGIS 10.2 to identify and rank RTA hotspots using historical RTA data on a section of a road in Brunei Darussalam as a case study. During accident data analysis one of the important step is to get a spatial data for further use in future geometric improvements. I found a research (Nilesh Deshpande et al.,2011) on the concern, regarding road safety in a developing country like India, further amplifies in absence of proper framework to analyse the accident related data using modern tools & techniques, especially in semiurban or rural setting. The model derived in this paper tries to utilize the data available through old records, by extracting factual & relevant information. This model analyses the data based on various parameters such as location of accident, severity, date and time of accident and some demographic parameters like population, educational institutions etc. Different methods of statistical & spatial analysis, such as Kernel density estimation and spatial autocorrelation, are being compared so as to determine the most appropriate way to analyse the acquired data. Geographical Information System (GIS) is being used as a tool for statistical analysis. The analytical process determines the statistically significant areas, which require urgent attention corresponding to the relevant parameters. Suggested areas are to be further investigated and recommendations can be made accordingly. The study was conducted for Pilani town & surrounding areas. With appropriate modifications, this system can be further applied over larger geographical extents, for better management & analysis of accident related data, for achieving better road safety
Steps followed to carry out this study are listed below:
1) Analysed two Metro Rail Corridors covering major parts of the city, which are passing through densely populated areas and heavy traffic routes.
2) Total 5 At-Grade intersections (renamed as J1, J2, J3, J4 & J5) are considered for this study based on intersection type, Landuse, Metro infrastructure impact and accident statistics etc.; Junction J1, J2 and J3 are from metro corridor-I and J4 & J5 are from corridor-II.
3) The checklist are prepared for At-Grade intersections based on IRC standards, and by following the guidelines from the ‘Manual for Safer Road Design’ developed for MoRTH
4) Below steps should be followed to evaluate the Level of Service (LOS) for At-Grade intersersections using checklists prepared in the point no. 3 are explained below:
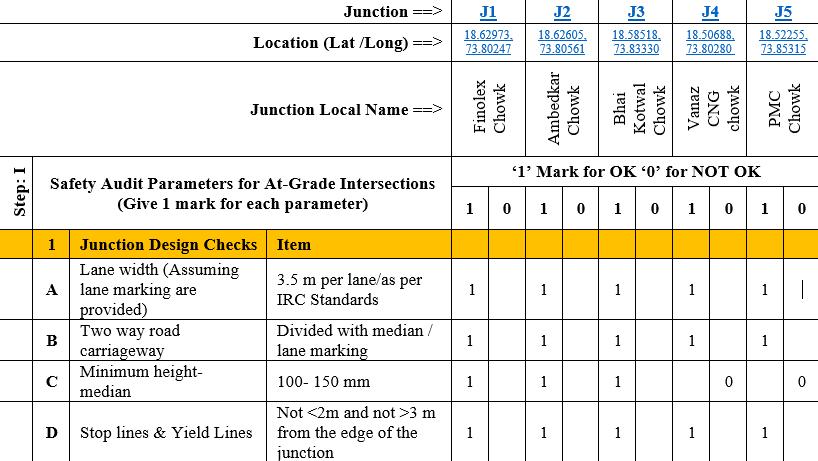
In first step, marking (1 Mark for OK, 0 for NOT OK) should be entered in the checklist as shown in Fig -1 for all the subsections. Subtotal and total marks should be counted for each facility.
-1: Marking Sample Format
& Engineering Technology (IJRASET
ISSN: 2321-9653; IC Value: 45.98; SJ Impact Factor: 7.538 Volume 11 Issue I Jan 2023- Available at www.ijraset.com
In second step, total marks for each facility should be calculated under ‘1’ column and this value should be entered under marks obtained (b) column for each intersection as shown in TABLE I
TABLEI
MARKS OBTAINEDFOREACHINTERSECTION
Sr No. Component/ Facility
Total Marks (a)
Marks Obtained (b) J1 J2 J3 J4 J5
1 Junction Design Checks 12 10 10 8 7 8
2 Pedestrian friendly 19 16 14 11 13 10
3 Bicycle friendly 2 1 1 1 1 1
4 Public Transport 1 1 1 1 1 1 5 Parking 1 0.5 0.5 0.5 0 0.5 6 Metro Infra Impact 5 4 3 3 2 2 Total 40
In third step : Percentage achieved should be calculated for all the facilities for each intersection and filled in the TABLE II format.
TABLEII
PERCENTAGE(%)ACHIEVEDFOREACHINTERSECTION
Sr. No. Component/ Facility
% Achieved c= (b/a)x100 J1 J2 J3 J4 J5
1 Junction Design Checks 83 83 67 58 67
2 Pedestrian friendly 84 74 58 68 53 3 Bicycle friendly 50 50 50 50 50 4 Public Transport 100 100 100 100 100 5 Parking 50 50 50 40 50 6 Metro Infra Impact 80 60 60 40 40
In fourth step : Based on Percentage achieved (c) in TABLE II, Level of Service is summarised in the TABLE III, LOS range is given below :
LOS A More than 80%
LOS B Between 80% - 70%
LOS C Between 70% - 60%
LOS D Between 60% - 50%
LOS E Between 50% - 40%
LOS F Less than 40%
TABLEIII
LEVELOFSERVICE FORINTERSECTIONS
Sr. No. Component/ Facility
Level of Service (LOS) (d) J1 J2 J3 J4 J5
1 Junction Design Checks LOS A LOS A LOS C LOS D LOS C
2 Pedestrian friendly LOS A LOS B LOS D LOS C LOS D
3 Bicycle friendly LOS E LOS E LOS E LOS E LOS E
4 Public Transport LOS A LOS A LOS A LOS A LOS A 5 Parking LOS E LOS E LOS E LOS F LOS E 6 Metro Infra Impact LOS B LOS D LOS D LOS F LOS F
ISSN: 2321-9653; IC Value: 45.98; SJ Impact Factor: 7.538 Volume 11 Issue I Jan 2023- Available at www.ijraset.com
The study concludes that, in India there is no significant policy by government to no road accidents in urban areas. Currently In Indian cities, Infrastructure developement is in full swing. The newly developed infrastructure and existing facilities should undergo safety analysis to safegaurd the urbanites. A method to analyse safety measures and evaluating Level of Service (LOS) of At-Grade intersections gives a good iterpreatetion about existing condition of the road infrastructure facilities and impact of metro corridors on it. This study helps to understand the exisiting situation and gives overall idea about At-Grade intersection functionality based on LOS, to concerned stakeholders. Level of Services (LOS) of At-Grade intersections can be evaluated at any stage of the project based on requirements.
This research was supported and guided by Jawaharlal Institute of Technology Borawan, Khargone (MP). I am thankful to my guide Prof. Vinay Deulkar who supported and provided his inputs that greatly assisted the research. I am thankful to the Mappls RealView 360, and Google Street View open data source providers.
[1] El-Said Mamdouh Mahmoud Zahran, Soon Jiann Tan, Eng Hie Angel Tan, Nurul Amirah ‘Atiqah Binti Mohamad ‘Asri Putra, Yok Hoe Yap & Ena Kartina Abdul Rahman, “Spatial Analysis of road traffic accident hotspots: evaluation and validation of recent approaches using road safety audit.”
[2] Khanh Giang Le1,2, Pei Liu & Liang-Tay Lin1 (1College of Construction and Development, Feng Chia University, Taichung, Taiwan, China; 2Faculty of Civil Engineering, University of Transport and Communications, Hanoi, Vietnam) : “Determining the road traffic accidents hotspots using GIS-based temporalspatial statistical analytic techniques in Hanoi, Vietnam.”
[3] Nilesh Deshpande (Student, Civil Engineering Department, BITS Pilani-333 031) Ishan Chanda (Student, Civil Engineering Department, BITS Pilani-333 031) Shriniwas S. Arkatkar (Asst. Professor, Civil Engineering Department, BITS Pilani 333 031) “Accident Mapping and Analysis Using Geographic Information Systems.”
[4] Amin Naboureh Bhakhtiar Feizizadeh, AbbasNaboureh, Jinhu Bian, Thomas Blaschke, Omid Ghorbanzadeh, and Meisam Moharrami. “Traffic Accident Spatial Simulation Modelling for Planning of Road Emergency Services”
[5] Surya Sarat Chandra Congressa, Anand J. Puppalaa, Aritra Banerjeeb, Ujwalkumar D. Patilc (aTexas A&M University, College Station, TX, USA bUniversity of Delaware, Newark, DE, USA, cUniversity of Guam, Mangilao, GU, USA) : “Identifying hazardous obstructions within an intersection using unmanned aerial data analysis.”
[6] Hemant Kumar Sharma1,2, Mansha Swami3 and B.L.Swami1 [1Malviya National Institute of Technology, Jaipur- 302 017, India, 2Rajasthan Urban Infrastructure Development Project (Asian Development Bank assisted Project), Jaipur- 302 017, India, 3Sardar Vallabhbhai National Institute of Technology, Surat-395007, India]. “Optimizing Performance of at-grade Intersection with Bus Rapid Transit Corridor and Heterogeneous Traffic.”
[7] Indian Roads Congress “IRC: SP : 88-2019, Manual on Road Safety Audit.”