1 minute read
International Journal for Research in Applied Science & Engineering Technology (IJRASET)

from Raspberry Pi and IoT Based Data Acquisition and Real Time, Remote Data Monitoring System
by IJRASET

ISSN: 2321-9653; IC Value: 45.98; SJ Impact Factor: 7.538
Volume 11 Issue III Mar 2023- Available at www.ijraset.com
Advertisement
Then, necessary python libraries are installed in order to achieve the given task Raspberry Pi is python programmed in which -
1) The SDA and SCL pins of Raspberry Pi are configured to enable I2C interface between Raspberry Pi and BMP180 sensor module.
2) The Beebotte account and channel created for the system “Monitoring Temperature and Barometric Pressure” are accessed through this program by providing necessary login credentials, like secret key and token
3) The sensor output of BMP180 is read and this output or data is temporarily stored in respective variables, like, “temperature_rd” and “pressure_rd”.
4) This acquired data is uploaded and stored to respective resources
“Temperature” and “Barometric_Pressure” of the Beebotte channel – “Monitoring Temperature and Barometric Pressure”. This step takes almost 15 seconds to execute.
5) Steps iii) and iv) are repeated after interval of 30 seconds by considering time taken to read data from sensors and time taken to upload data as mentioned in step iv).
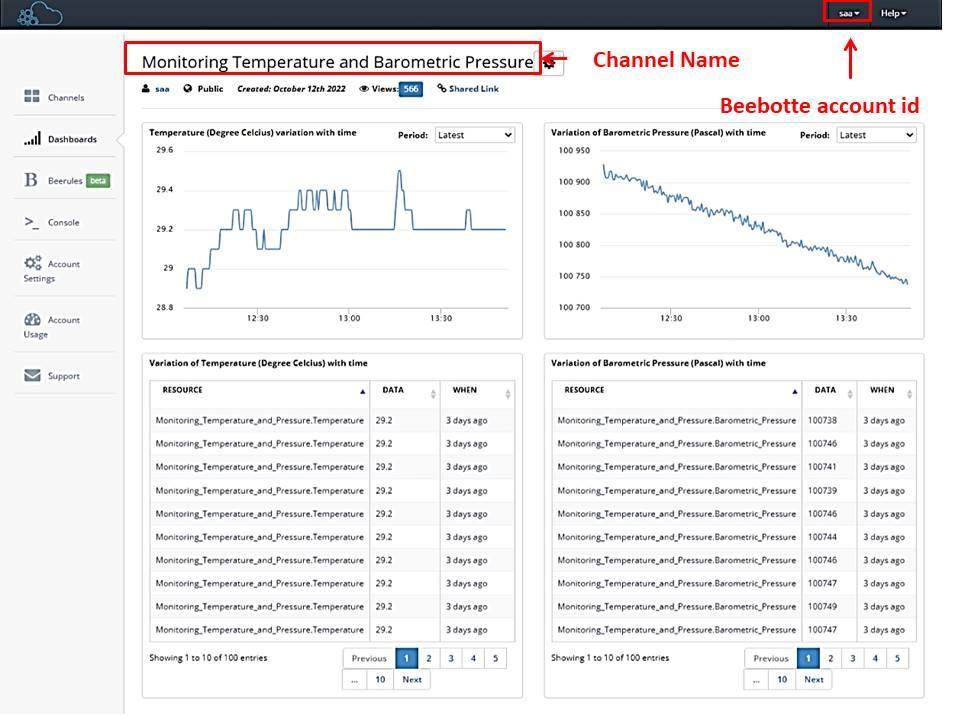
In this way, acquired data, i.e., temperature and barometric pressure is uploaded to the cloud server. This data can be visualized on dashboard of system in the form of table chart and timeline chart as shown in Fig. (3).
This channel’s dashboard link can be shared through any message sharing platform and as this channel is “public”, the uploaded data can be observed from anywhere at real time. Data modification will not be allowed to the observer. It is only allowed to the Beebotte account holder.
III. RESULTANDANALYSIS
Fig. (3), Fig. (4), Fig. (5), Fig. (6) and Fig. (7) shows screenshots of dashboard of system. After every data acquisition step, the acquired data, i.e., temperature and barometric pressure is uploaded to the respective resources created for the channel “Monitoring Temperature and Barometric Pressure” The uploaded data to cloud server is available on Beebotte dashboard in table chart format and in timeline graph format as shown in Fig. (4), Fig. (5), Fig. (6) and Fig. (7).
Fig. (4) is the screenshot of dashboard of system which shows timeline chart for temperature resource, where graphical variation of temperature in °C with time is shown Following data is the latest collected data. Previously collected data is also available on dashboard. By selecting appropriate option from dropdown list of ‘Period’ option, previously uploaded data can be observed.