1 minute read
International Journal for Research in Applied Science & Engineering Technology (IJRASET)

from Predicting Stability of Slope by Amplitude and Coherence Using a Naïve Bayes Classifier
by IJRASET


ISSN: 2321-9653; IC Value: 45.98; SJ Impact Factor: 7.538
Advertisement
Volume 11 Issue III Mar 2023- Available at www.ijraset.com
B. Training Gaussian Naïve Bayes Classifier
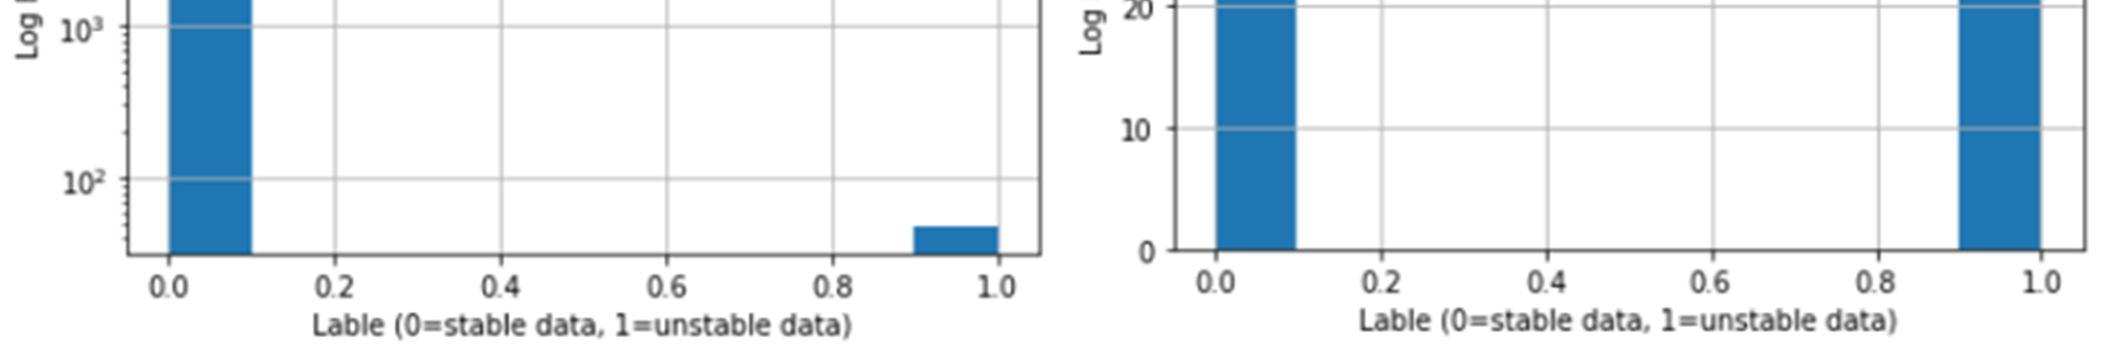
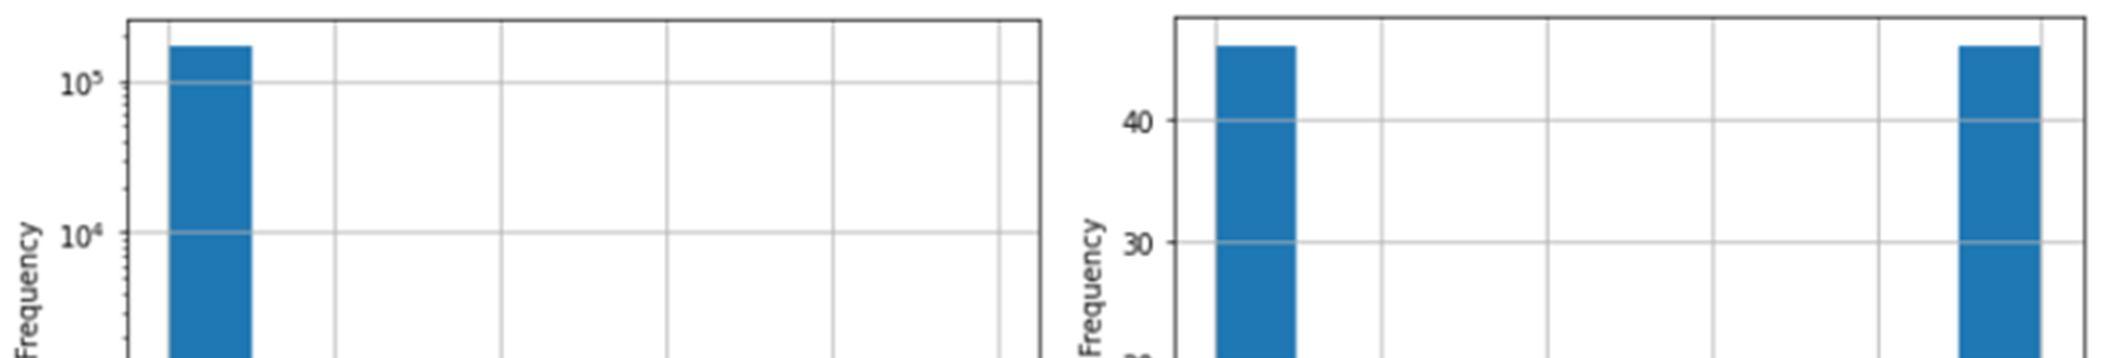
80 percent of the data were used as a training set, and 20 percent for testing the model. The model was trained based on the value of coherence and amplitude. This research claims that if the coherence valueis between 0.2and 0.5, andtheamplitudevalue is greater than 53, the slope is most likely in the failure zone and is not stable. Although they are many stable data with an amplitude of more than 53, or with a coherence between 0.2 and 0.5, when either the coherence or amplitude values satisfy the above conditions, they are classified in the unstable data category. For training the model, all coherence and amplitude values were concatenated, and the data were labeled based on their value. The data with coherence between 0.2 to 0.5 and amplitude of more than 53 were labeled 1 as unstable data and therest ofthe data werelabeled 0 as stable data. Fig. 5(A) shows the histogram of stable and unstable data after the labeling process. As can be seen, the results show that the size of the data are unequal and unbalanced. In other words, the stable dataset size is much larger than the unstable one. To balance the size between groups, we needed to decrease thesizeofstable data to the size of unstable data which is 48. Hence, a specific code in the Python environment was developed torandomly choose48 data fromagroupofstabledata andnormalize thesizeof stable and unstable data, 96 in total (Fig 6.(B)).
(A) (B)
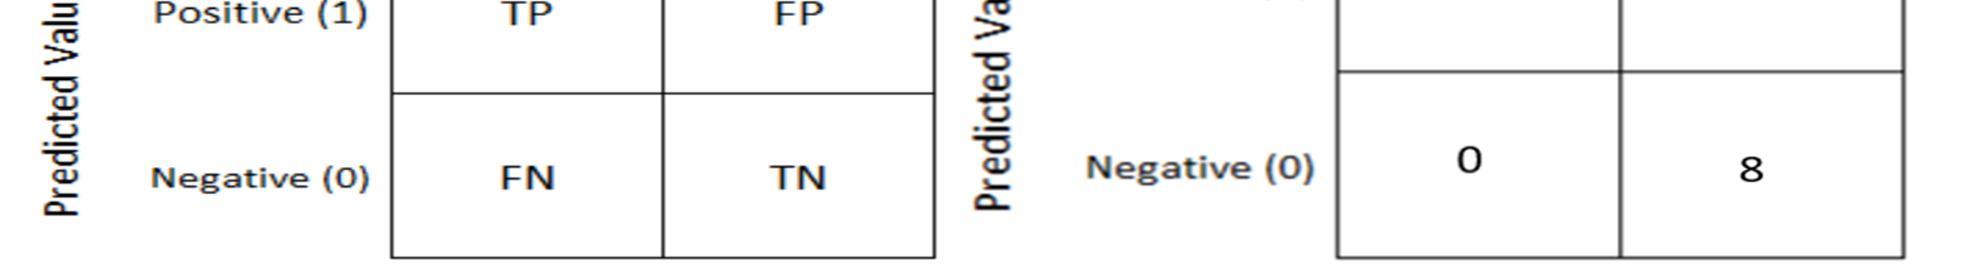
IV. RESULTS AND DISCUSSION
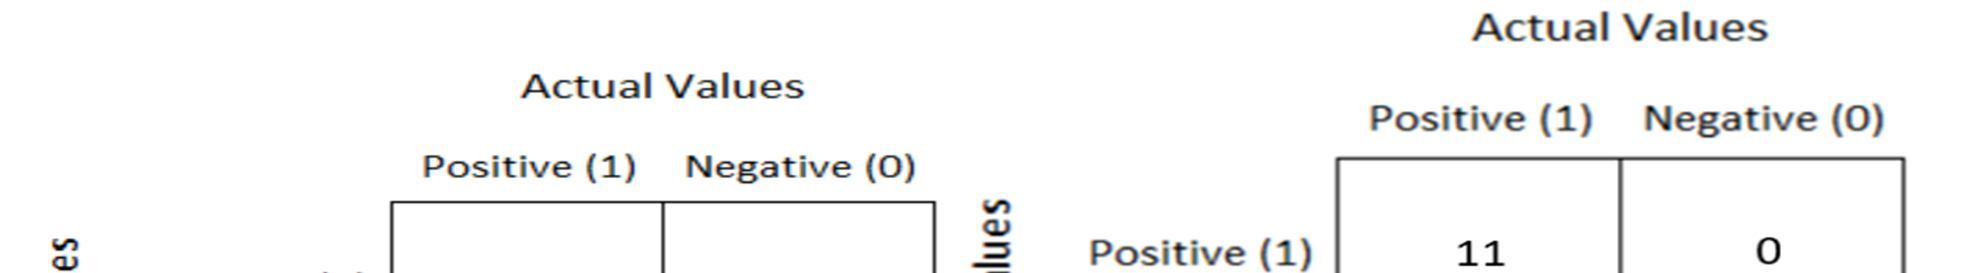
The NBG classifier was tested on 20 percent of the datasets which were a combination of stable and unstable data. The results show that the developed model classifies the data efficiently. The confusion matrix in Fig. 6 suggests that 11 data points were unstable and GNB could identify them as unstable data. Also, 8 data points were stable, and the model detected them as stable data correctly. The 48 data points that were classified as unstable data were tested using deformation values to determine if they belong to slope failure periods. The analysis revealed that 91 percent of the data belong to the slope failure category. In other word, this indicated that 91 percent of the data had a coherence between 0.2 to 0.5 and an amplitude of greater than 53 belong to a failed slope. However, this does not mean that when the slope fails, the amplitude and coherence value should be necessarilymore than 53 and between 0.2 to 0.5respectively.