5 minute read
International Journal for Research in Applied Science & Engineering Technology (IJRASET)


ISSN: 2321-9653; IC Value: 45.98; SJ Impact Factor: 7.538
Advertisement
Volume 11 Issue III Mar 2023- Available at www.ijraset.com
And the model is built for the prediction of the calculated results based on the testing and training data. The First step is Data gathering. This step is very important because the quality and quantity of the data gathered will directly affect the level of the prediction model. So this data is a list of over 332 records of laptops from laptop retailers. The dataset includes basic product information, price, ratings, and various hardware and software parts. The attributes such as Brand, Processor, Ram(GB), and Price plays a vital role in predicting the performance of the laptops Brand – The different brands of laptops with versions, Processor –Processing unit of laptops i.e memory, RAM – Random Access Memory in GB, Operating System – OS (Windows or MAC), Storage – Capacity of the laptops in SSD (Flash Based Memory), Frequency in HZ i.e., 1,2,3,4,5, Graphics Card – Visions for categories i.e. gaming- advanced and normal versions, Display – Inches of the screen in Centimeters, Warranty – Number of months or years and the type of warranty, Price – market price of the laptop from the retailers, Rating – customer ratings of the laptops.
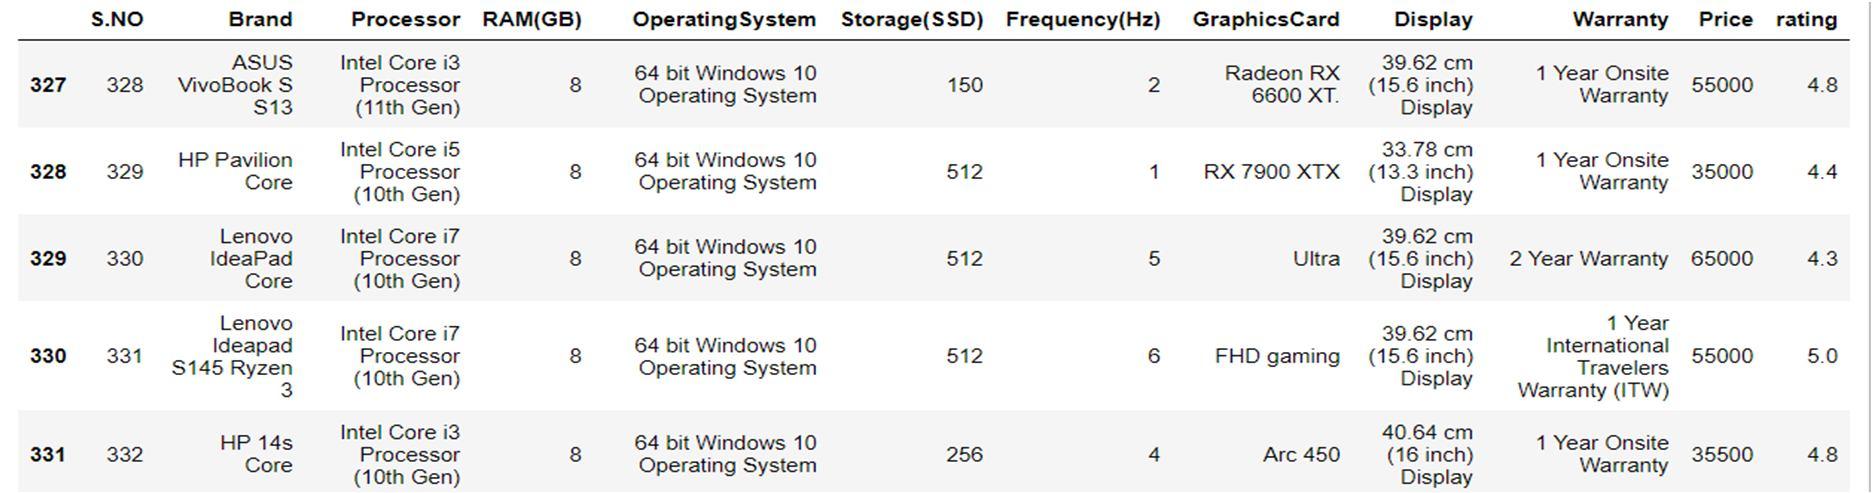
Dataset Description
V. DATA PREPROCESSING
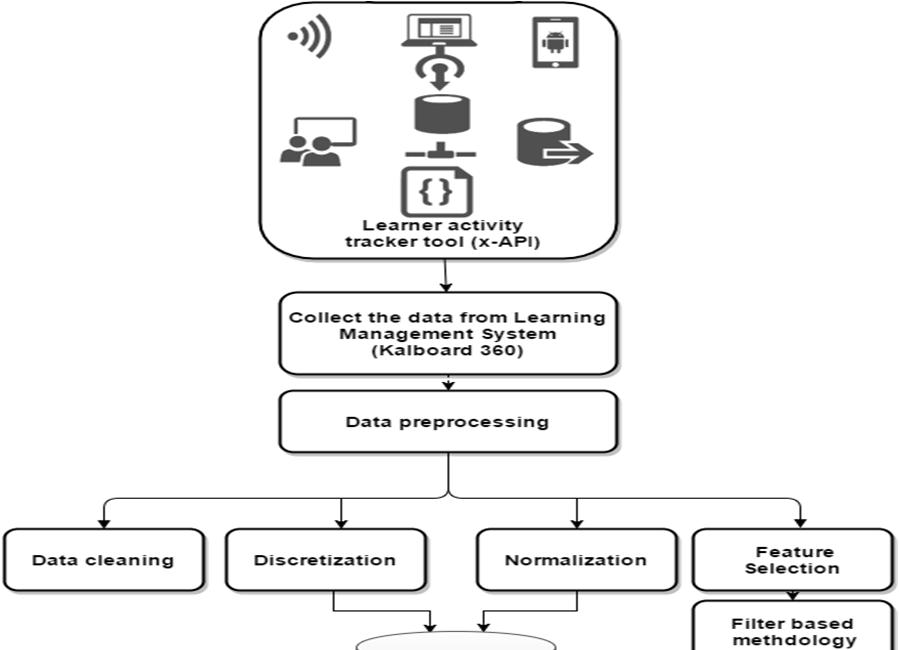
The data are cleaned and processed before sending it into a model. The null values are checked and either removed or replaced. In this dataset, no null values were found and the data consist of categorical and numerical values. Both the numerical and categorical values will be converted into 0 and 1 for the modeling process. As laptop data does not contain any null value so the data present over the records consist of numerical and categorical values which will be evaluated in the modeling process.
ISSN: 2321-9653; IC Value: 45.98; SJ Impact Factor: 7.538
Volume 11 Issue III Mar 2023- Available at www.ijraset.com
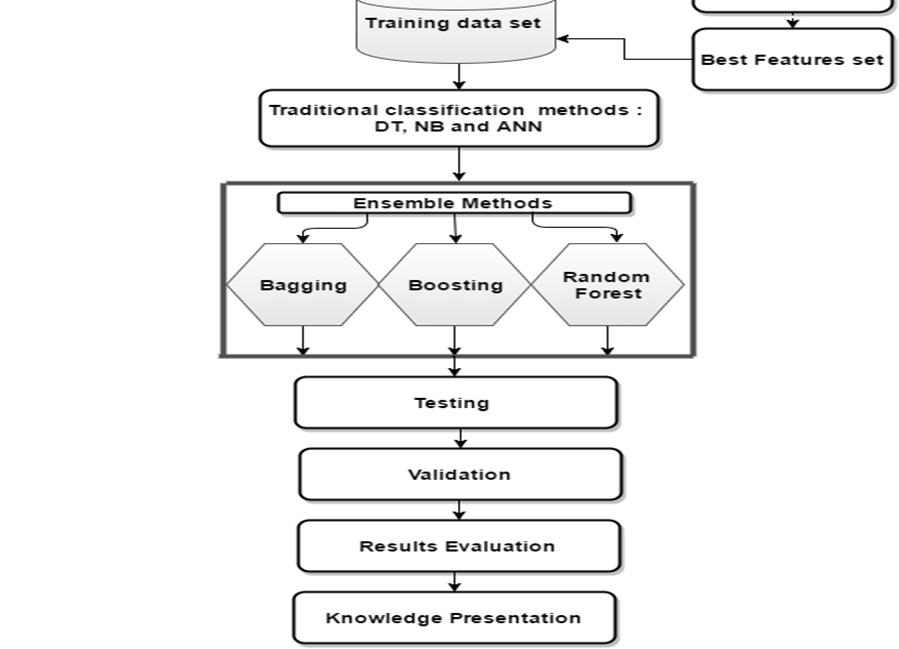
VI. PROCESS FLOW
As laptop data does not contain any null value so the data present over the records consist of numerical and categorical values which will be evaluated in the modeling process. As data consists of more categorical values than numerical values, Which is the biggest drawback of building a model. So by finding the correlation of the data set will give the skewness of the data. By using statistical function mode(). Those categorical values get replaced with the mode of the particular attribute. This statistical function is followed for three attributes such as brand, Processor, and display. The Operating system is of two types MAC and Windows OS. And the ratings and price of the laptops are categorized into a mean of two. They are turned into 0 and 1 during the manipulation process. The specifications of the users such as Students, Developers, Basic users, and Gamers are mentioned in the data that to be trained. All the categorical values are turned into numerical values.
VII. MODEL EVALUATION
Logistic Regression, Random Forest Classifier, and Extra tree classifier are implemented for training and testing the model For choosing a model we split our dataset into training and testing. Here data are split into a 3:1 ratio which means training data has 70 percent and testing data has 30 percent. In this split process performing based on the train_test_split model. After splitting we get x_train, x_test and y_train, y_test[3,7].
A. Logistic Regression
Logistic regression is a predictive analysis. Logistic regression describes data and explains the relationship between one dependent binary variable and one or more nominal, ordinal, interval, or ratio-level independent variables. Another important consideration is the model fit when selecting the model for the logistic regression analysis. Split our dataset to train and test set and fit the dataset to the Logistic regression model. The assumptions made by logistic regression about the distribution and relationships in your data are much the same as the assumptions made in linear regression.. The trained logistic regression model and applying to a testing data set. The dependent variable is binary (Boolean). For each sample in the testing data set, while applying the logistic regression model to generate an accuracy level of 80 percent.

Fig.3 Accuracy level of prediction using Logistic Regression
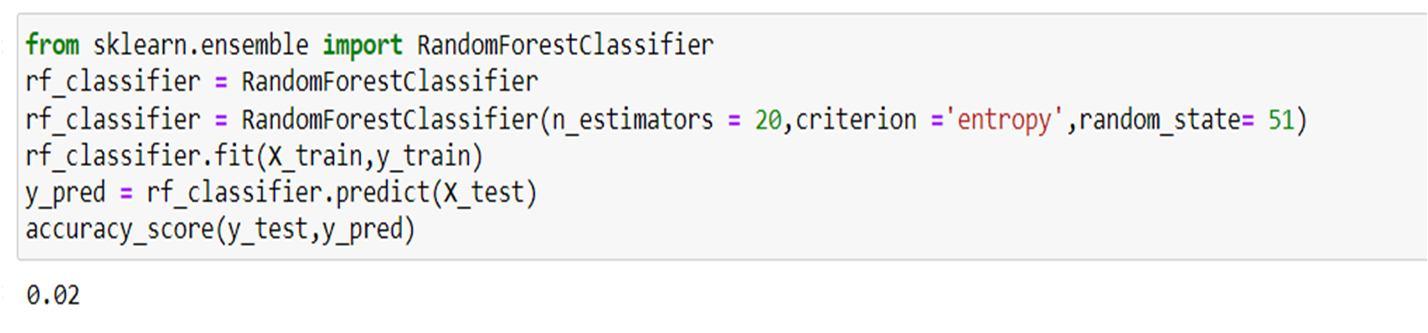
B. Random Forest Classifier
Random Forest is a flexible, easy-to-use machine learning algorithm that produces, even without hyper-parameter tuning, a great result most of the time. It is also one of the most used algorithms, because of its simplicity and diversity (it can be used for both classification and regression tasks). In random forest classification, multiple decision trees are created using different random subsets of the data and features. Each decision tree is like an expert, providing its opinion on how to classify the data. Predictions are made by calculating the prediction for each decision tree, then taking the most popular result.
ISSN: 2321-9653; IC Value: 45.98; SJ Impact Factor: 7.538
Volume 11 Issue III Mar 2023- Available at www.ijraset.com
C. Extra Tree Classifier
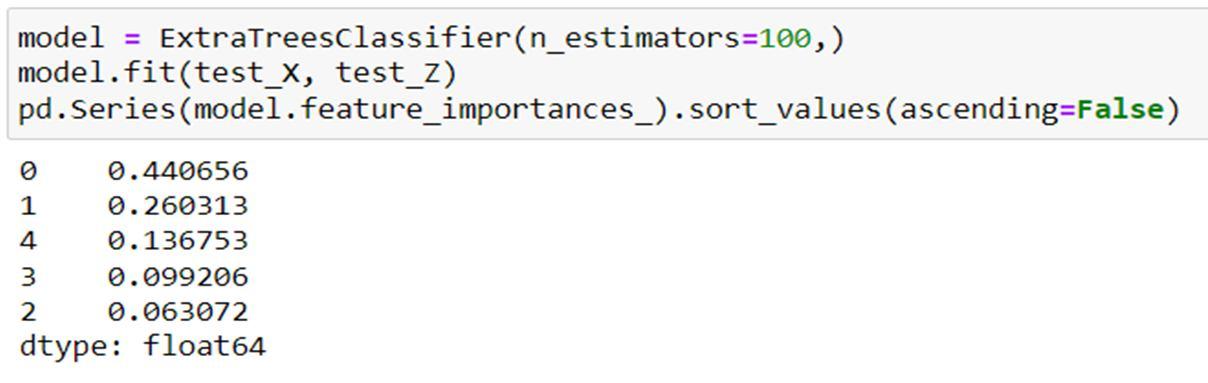
An extra tree is an algorithm used for classification and regression tasks. It works by randomly selecting a subset of features and then training a Decision Tree. The tree is then pruned only to contain the most important features for making predictions. The Extra tree algorithm is considered an efficient and accurate machine learning method. It is similar to other methods such as decision trees and random forests, but it uses extra information about the data to improve predictive accuracy. Additionally, the extra tree algorithm is faster and easier to implement than other methods. As a result, it is a powerful tool for data mining and predictive modeling.
Table I
Table 1.Comparison Of Prediction Accuracy of algorithms
VIII. RESULT
In classification, accuracy is an important evaluation parameter. Accuracy is the proportion of the total number of predictions that were correct. It can be obtained by the sum of true positive and true negative instances divided by 100. And Precision is fraction of true positive and predicted yes instances. The accuracy score of the three algorithms is evaluated and the prediction model is built using the CSV file by defining the object function and reading the file. The categories of the predictions were defined for Student, Developer, Gamer, and Basic. Based on the features and specifications of the laptops, the categories are trained into the model. By using the python modules, those values will get imported. The dataset consists of 332 records, Where the functions and the performance of each laptop will get evaluated. The input and output values are imported and when the specified categories are given in the input function then the laptops which will be performed well over the other laptops with different functions are shown. The laptops for the categories based on the prediction and performance value will be visualized as the output.
IX. CONCLUSION
As Extra Tree classifier gives greater accuracy at 85%. Extra tree classifier groups the data into clusters and the data are trained and tested in five different groups and classified. Based on the training and testing those data will get five parts of accuracy and predictions of the laptops are made by a grouping of provided data. Predicting something through the application of machine learning using the Extra Tree algorithm makes it easy for students and retail stores, especially in determining the choice of laptop specifications that are most desirable for students, and IT professionals to meet needs and in accordance with the purchasing power of people. Students, Gamers, Developers, and Basic users no longer need to look for various sources to find laptop specifications that are needed by students meeting the needs of students, because the laptop specifications from the results of the machine learning application have provided the most desirable specifications with their prices of laptops.
X. FUTURE WORK
The data which consists of eleven attributes could be increased and the number of records over the data could be more. The prediction of the data will be improved by implementing many other algorithms
1) Test more attributes and many categories of laptop users
2) Find a solvent feature extraction technique to improve results.
