
1 minute read
International Journal for Research in Applied Science & Engineering Technology (IJRASET)


ISSN: 2321-9653; IC Value: 45.98; SJ Impact Factor: 7.538
Volume 11 Issue IV Apr 2023- Available at www.ijraset.com
Advertisement
Furthermore, the analysis will also present the age-adjusted mortality of Madagascar thus presenting how poverty has affected mortality rates in the country. The use of tax to GDP ratio will determine the wage inequality aspect in Madagascar. This contributes to the income inequality significantly (Piketty, 2013). In general, this analysis will focus on regression analysis of the data and use available information on the economic status of Madagascar to give conclusions about the topic. The analysis used data obtained from different online sources such as macrotrends.com and the transparency International Website. The following table presents the data for the analysis
The above table presents the data that the analysis used to determine the relationship between the corruption perception index, the income inequality and mortality rate in Madagascar.
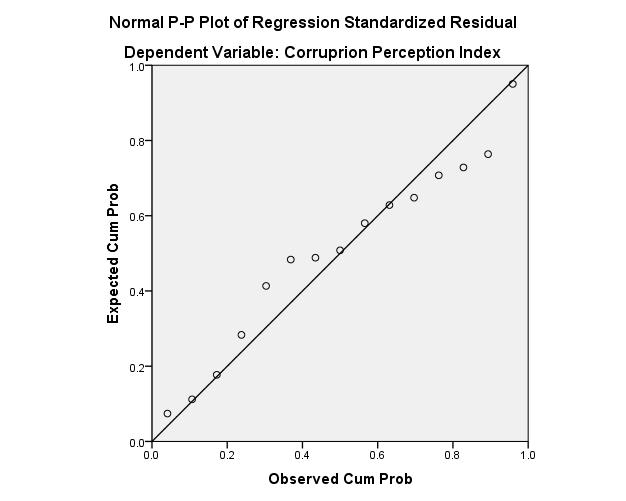
III.RESULTS
The analysis focused on the corruption perception index as the measure of the corruption rates in Madagascar across the years. The analysis then focused on the relationship between the Corruption perception index and the mortality rates in the country. The mortality rate was used to present the aspect of poor welfare in the population. The analysis then established the relationship between the Corruption perception index and the economic factors that affected income inequality such as healthcare expenditure, education expenditure, GDP per capita, and tax-to-GDP ratio in Madagascar. First, the ANOVA analysis of the model presented a significant value of 0.012 showing that the model is significant. The following table presents the regression analysis between the corruption perception index and the mortality rates in the country:

