7 minute read
International Journal for Research in Applied Science & Engineering Technology (IJRASET)

from Experimental Analysis of Charging and Discharging Characteristics of Sensible Energy Storage System
by IJRASET


ISSN: 2321-9653; IC Value: 45.98; SJ Impact Factor: 7.538
Advertisement
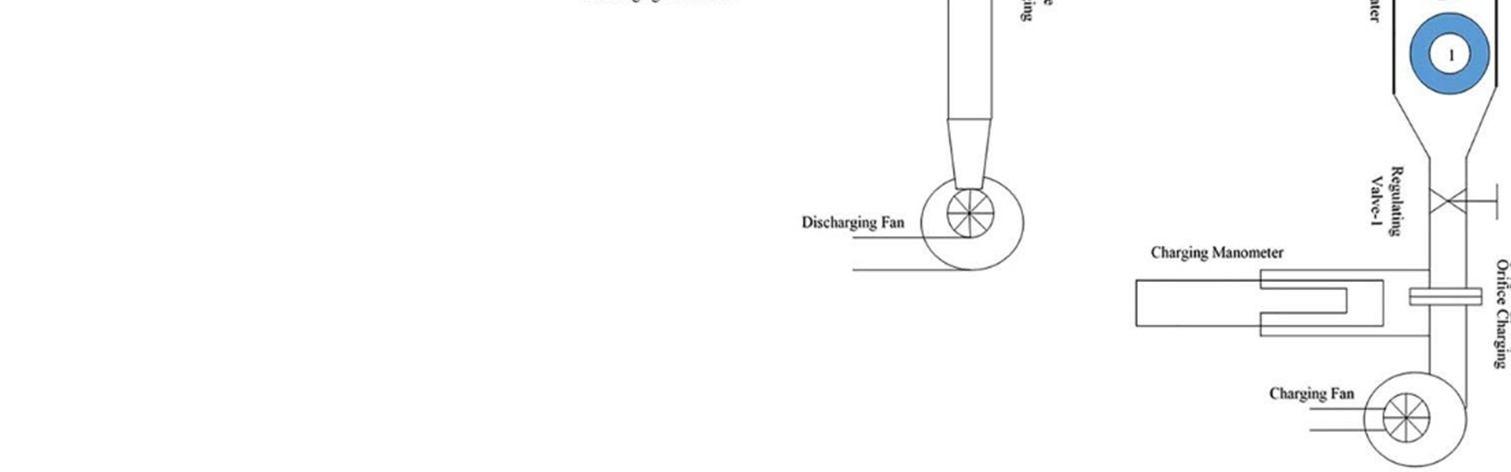
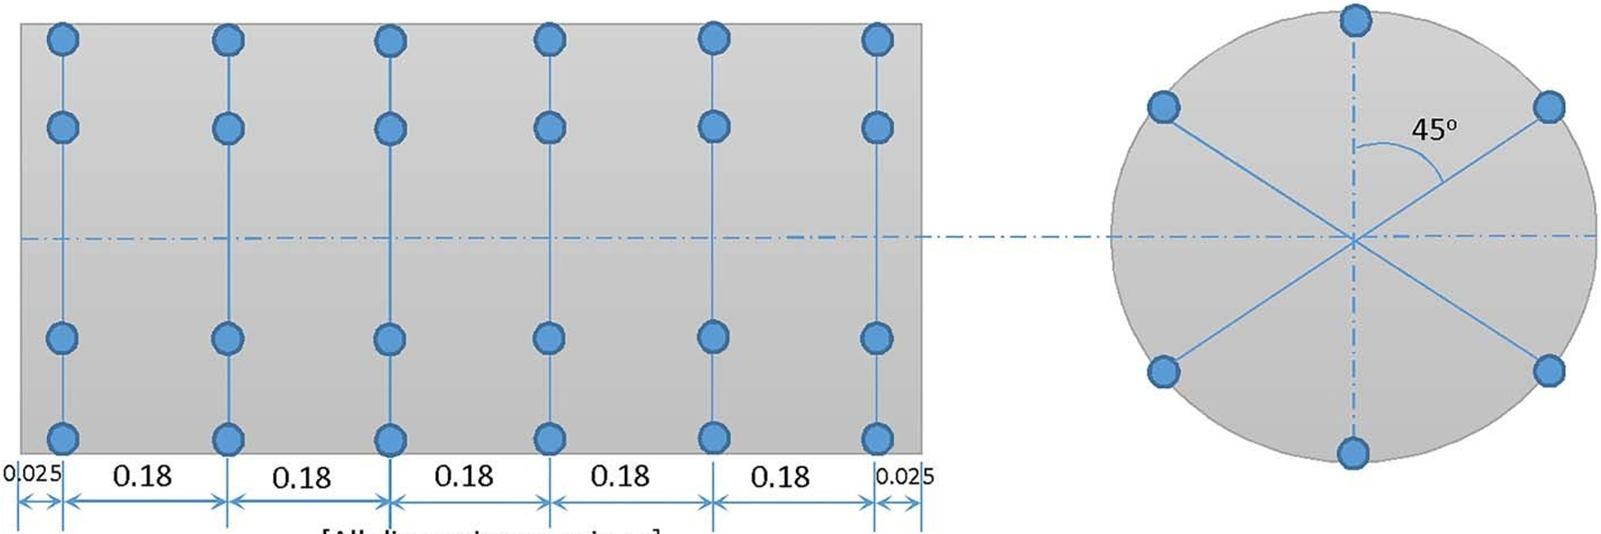
Volume 11 Issue II Feb 2023- Available at www.ijraset.com the test rig's many components in a schematic form. Separate blowers with a 3 HP capacity connect the charging and discharging loops. Fig. 5 shows where the thermocouples are located on the SESS.
A heater chamber that is attached to the variac has ceramic heating elements with a 3 KW rating. The heating elements are positioned so that as air passes through the heater chamber, it absorbs the most thermal energy possible. A circuit breaker mechanism supplies the heating elements with electrical energy, and separate switches are used to control the functioning of each heating element. A digital Voltmeter and Ammeter are used to measure the voltage and current flowing through the circuit. To isolate the system from its surroundings, cement sheets are placed over the heater chamber and are followed by glass wool insulation.
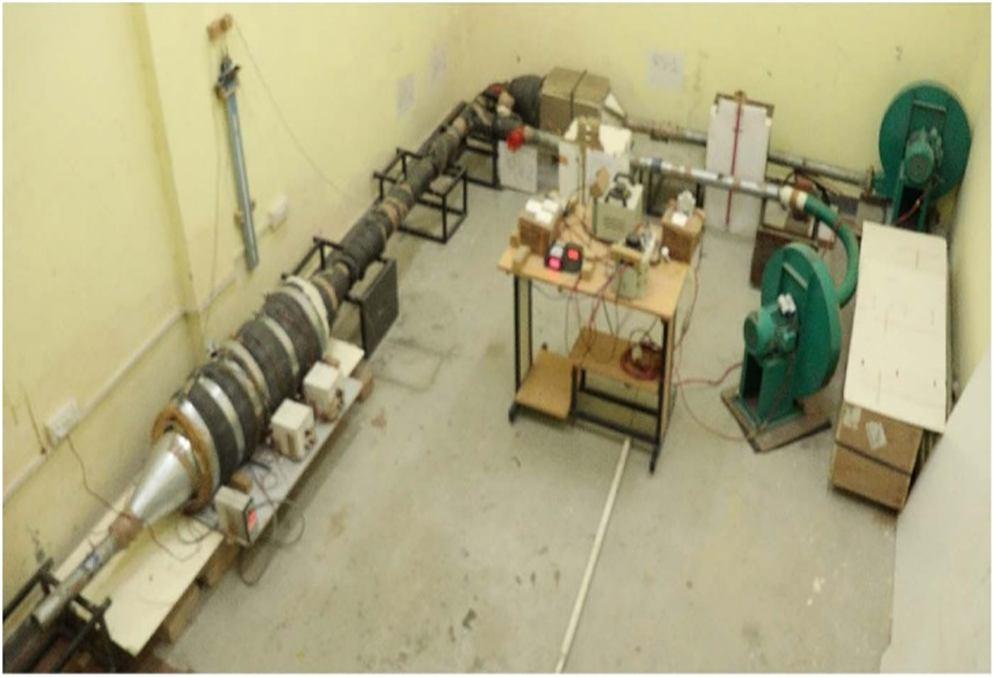
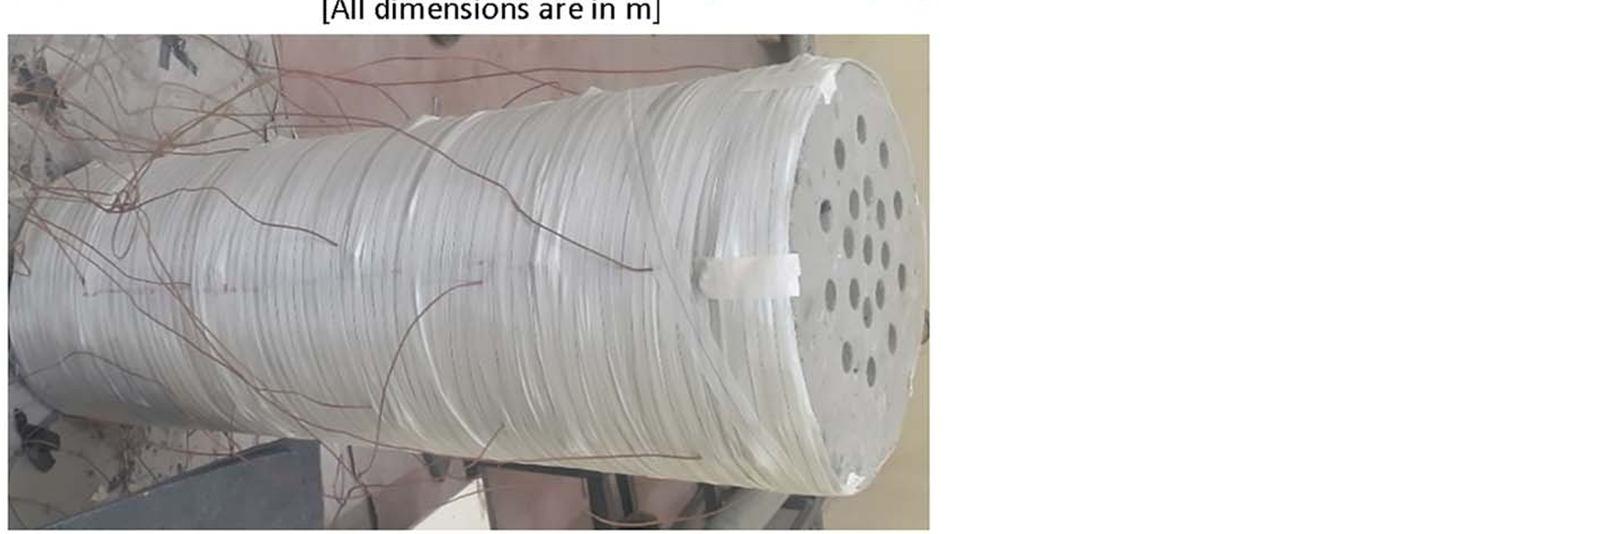
The storage system is created by filling it with M30 grade concrete, which has a specific heat capacity of 850 J/kg/K and a density of 2200 kg/m3 [2]. The test rig utilised for data gathering in this investigation is depicted in real life in Figure 3. Fig.
ISSN: 2321-9653; IC Value: 45.98; SJ Impact Factor: 7.538
Volume 11 Issue II Feb 2023- Available at www.ijraset.com
To collect data at various mass flowrates of heat transfer fluid, experimental test runs are undertaken. A charging fan is used to pump atmospheric air into the charging loop to start the charging process. Using the regulating valve, the mass flowrate of air through the storage system is controlled (RV1). Via a variac, the electrical energy is delivered to the heating components at the desired pace. By opening the stop valve (SV1), the air is heated in the heater chamber to the necessary input temperature and bypassed to the atmosphere through stop valve (SV3), with the stop valves (SV2) and (RV2) remaining closed during this process. By opening the stop valves (SV2) and (SV1) and closing the stop valves (SV3) and (RV2), the hot air at the desired temperature is fed to the sensible energy storage system. A data-logging system is used to record the storage temperature as well as the air temperatures at the intake and exit of the storage system. When the air temperature at the entry and the exit of the test segment are confirmed to be equal, the charging cycle comes to an end.

ISSN: 2321-9653; IC Value: 45.98; SJ Impact Factor: 7.538
Volume 11 Issue II Feb 2023- Available at www.ijraset.com
The discharge procedure comes next, for which the stop valves (SV1), SV3, and SV2 are opened and the stop valves (SV1) and SV3 are closed. The discharge fan is turned on to create atmospheric air in the test area, and the regulating valve is used to change the mass flowrate of air (RV2). The storage mechanism releases thermal energy during the discharging phase until the air's exit temperature reaches the inlet temperature.
By delivering the heat transfer fluid at various flowrates as the temperature varied from 45 to 75 °C, the SESS stores the thermal energy.
“The thermal energy saved or released during the charging or discharging phase in the concrete bed at any instant (t) is given as follows: where T(t) is the temperature of the time-dependent SESS and (Ti) is the initial temperature. The storage system's volume (Vss) is provided as follows:
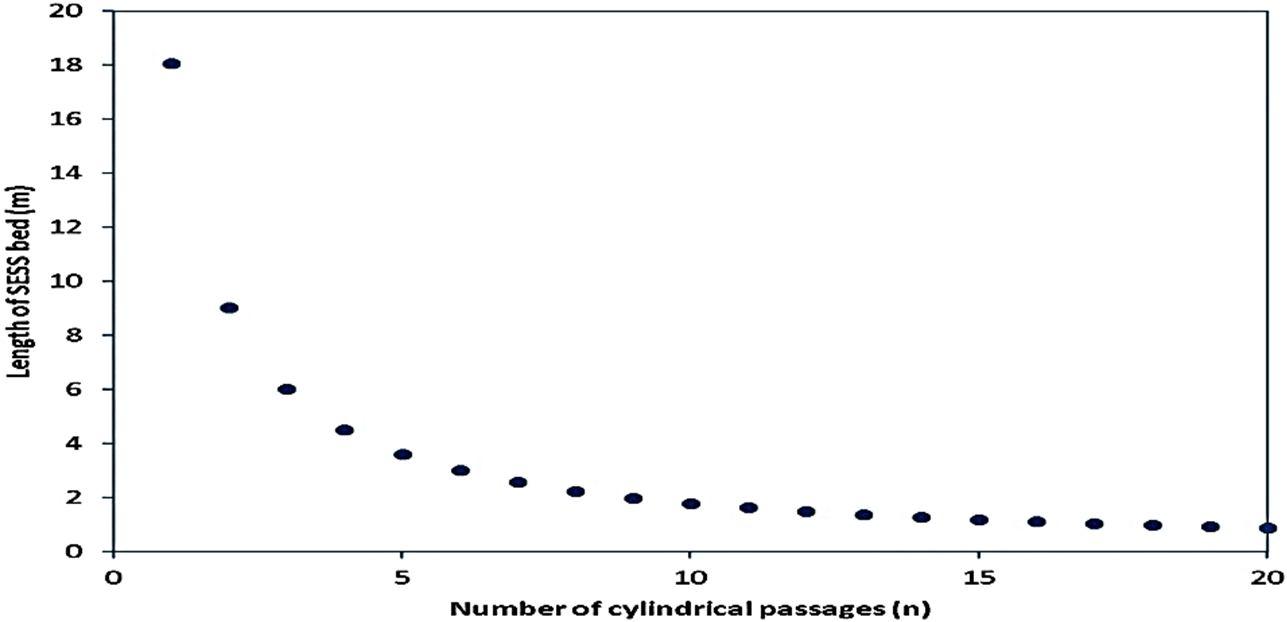
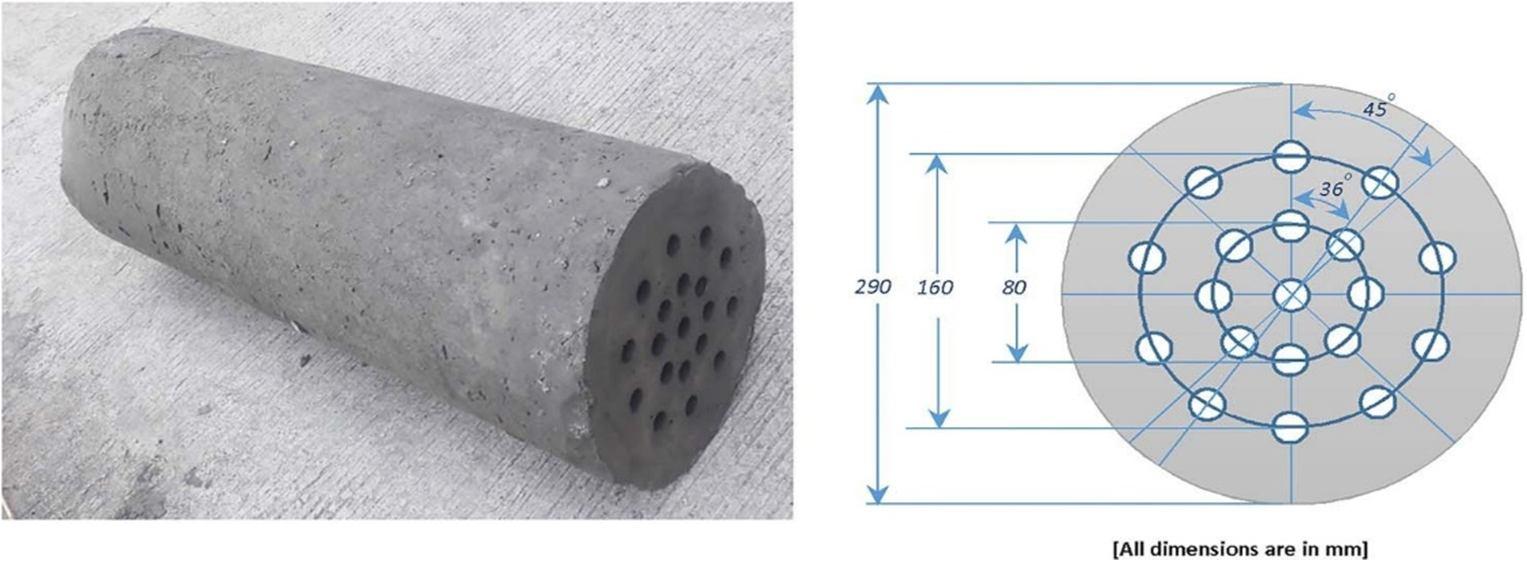
Vss = = [D2 n(d)2] L (3) where D is the concrete bed's diameter and d is the cylindrical passage's inner diameter. Following is a definition of the total thermal energy input over a specific period of time:
Ec,inp = ∫ d + ∫ d + ∫ d + … (4) where q= mC pa(Tin Tout) (5)
The total thermal energy retrieved in certain duration is defined asfollows:
Ed,ret = ∫ ˙d + ∫ ˙d + ∫ ˙d + …. (6) where q= mC pa(Tout – Tin)”[1] (7)
The following definitions apply to the charging/discharging energy efficiency at the specified time. [3]:
Ƞc= , (8)
Ƞd= , (9)
The results of the uncertainty are displayed in Table 1
III. RESULTS AND DISCUSSION
A. Transient Temperature Distribution of SESS
SESS Transient Temperature Distribution. The energy storage system's transient response reveals the thermal properties of the charging and discharging processes at various temperatures as well as the mass flow rate of air.
Table. 1 Experimental Uncertainties
Fig. 6 displays the localized temperature variation of the SESS with respect to time for an intake air temperature of 45 °C and an air mass flowrate of 0.031 kg/s (a). In the charging phase, it can be seen that the spatial temperature of the SESS falls as the dimensionless length (x/L) gets closer to 1, whereas in the discharging process, the temperature of the SESS slightly increases up to (x/L) of around 0.2 and then decreases. With the development of the charging and discharging processes, the spatial temperature variation of SESS becomes negligible. This trend is explained by the high heat transfer zone produced at the SESS entry, which causes the SESS inlet temperature to decrease during charging and increase during discharging. For 75 °C inlet air temperature and 0.031 kg/s mass flowrate of air throughout both the charging and discharging processes, Figure 6(b) illustrates a significant temperature change of SESS in the longitudinal direction, notably near the inlet. Figures 6(b) and 6(c) show that there is no clear correlation between the temperature variation of SESS and changes in the mass flowrate of air.
ISSN: 2321-9653; IC Value: 45.98; SJ Impact Factor: 7.538
Volume 11 Issue II Feb 2023- Available at www.ijraset.com
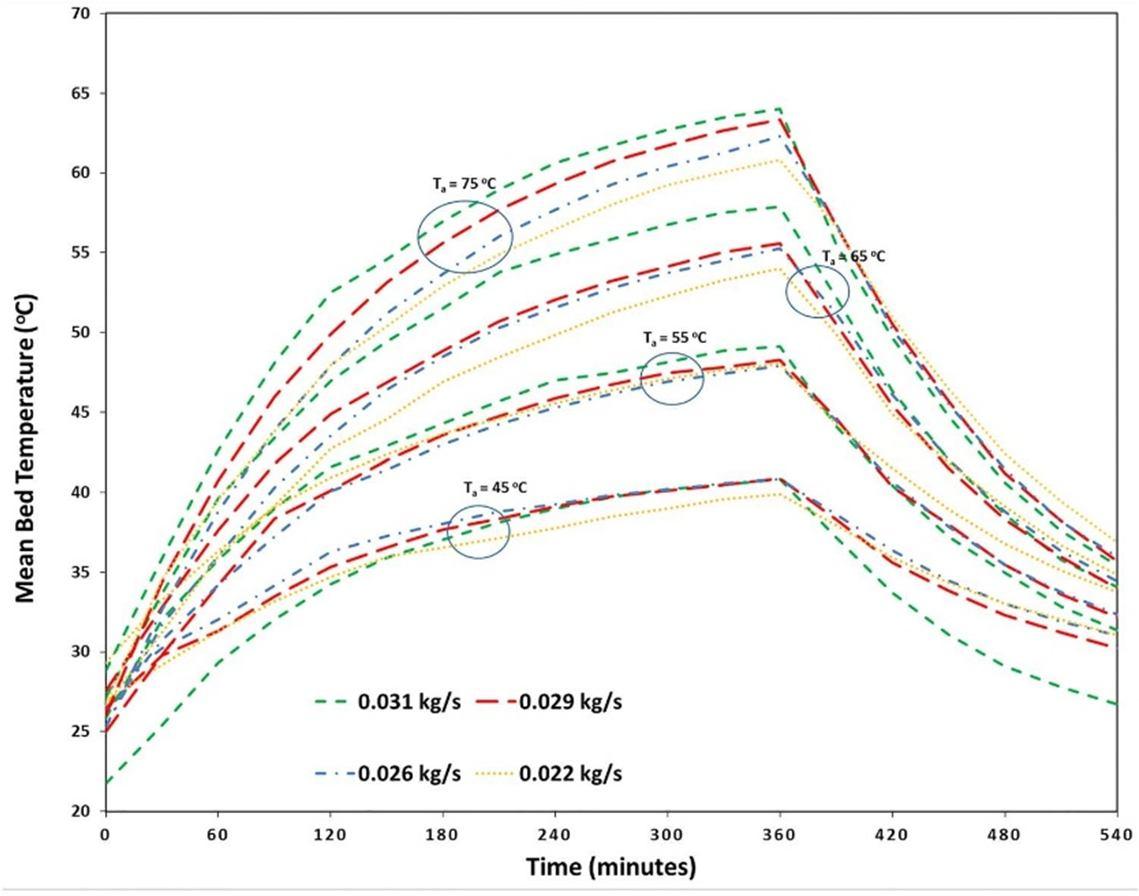
For a full charging-discharging cycle, Figure 7 depicts the fluctuation of the mean temperature of SESS as a function of time. The plot shows that with the higher air inlet temperature, the mass flowrate has a stronger impact on the temperature rise. Due to the greater temperature difference between the fluid and the storage material, the temperature of SESS increases more quickly during the initial charging phase. Similar to this, throughout the first 120 minutes of the discharging process, a higher drop in SESS temperature is seen.


B. Energy And Efficiency Characteristics
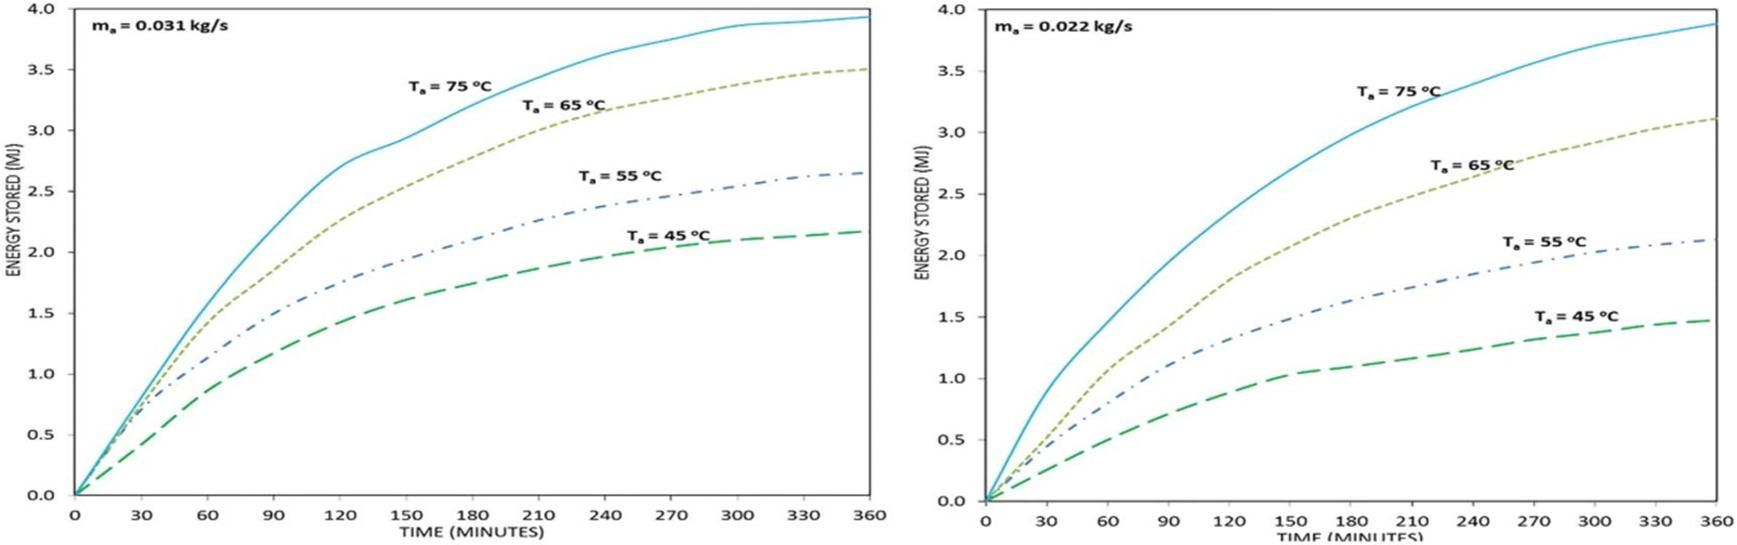
By adjusting the mass flow and air temperature at the air inlet over time, the amount of energy stored in the SESS is assessed. Fig. 8 illustrates a clearly discernible impact of the mass flowrate of air at lower inlet temperature. However, it becomes less significant as the temperature of the input air rises.
ISSN: 2321-9653; IC Value: 45.98; SJ Impact Factor: 7.538
Volume 11 Issue II Feb 2023- Available at www.ijraset.com
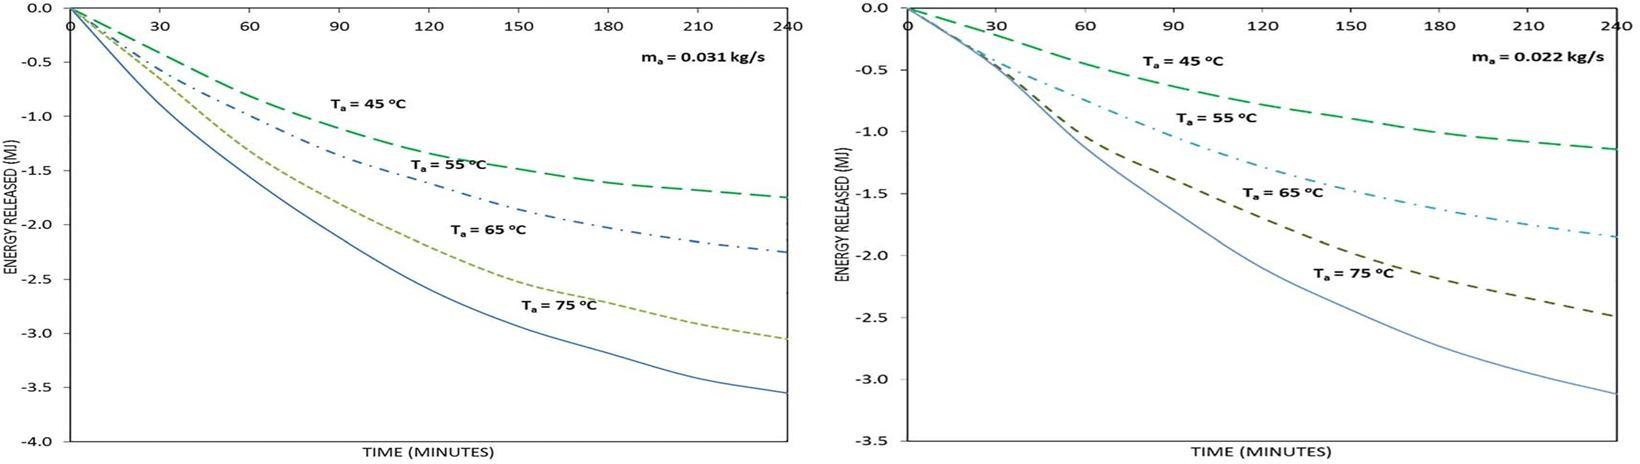
Due to greater heat penetration in the presence of multitubular cavities in general and in particular at lower inlet air temperatures, it appears that an increase in mass flowrate causes a greater increase in the internal energy of SESS. As depicted in Fig. 9, a comparable occurrence is seen during the discharge process.
ISSN: 2321-9653; IC Value: 45.98; SJ Impact Factor: 7.538
Volume 11 Issue II Feb 2023- Available at www.ijraset.com
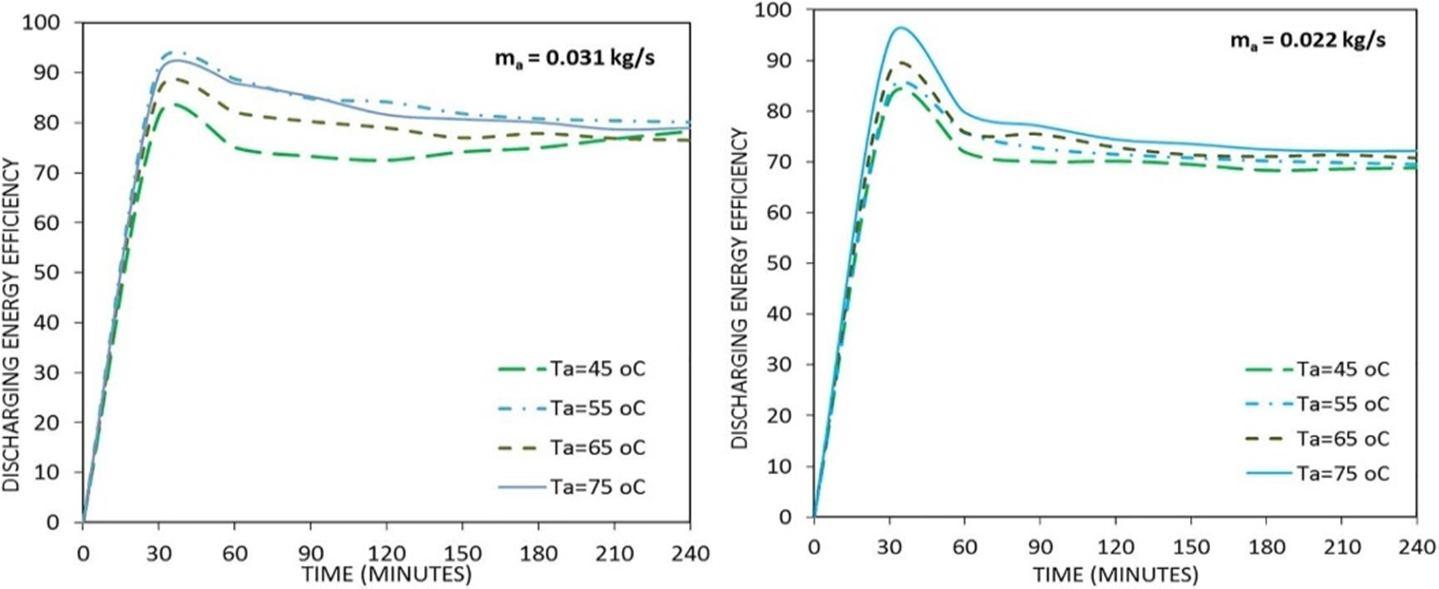
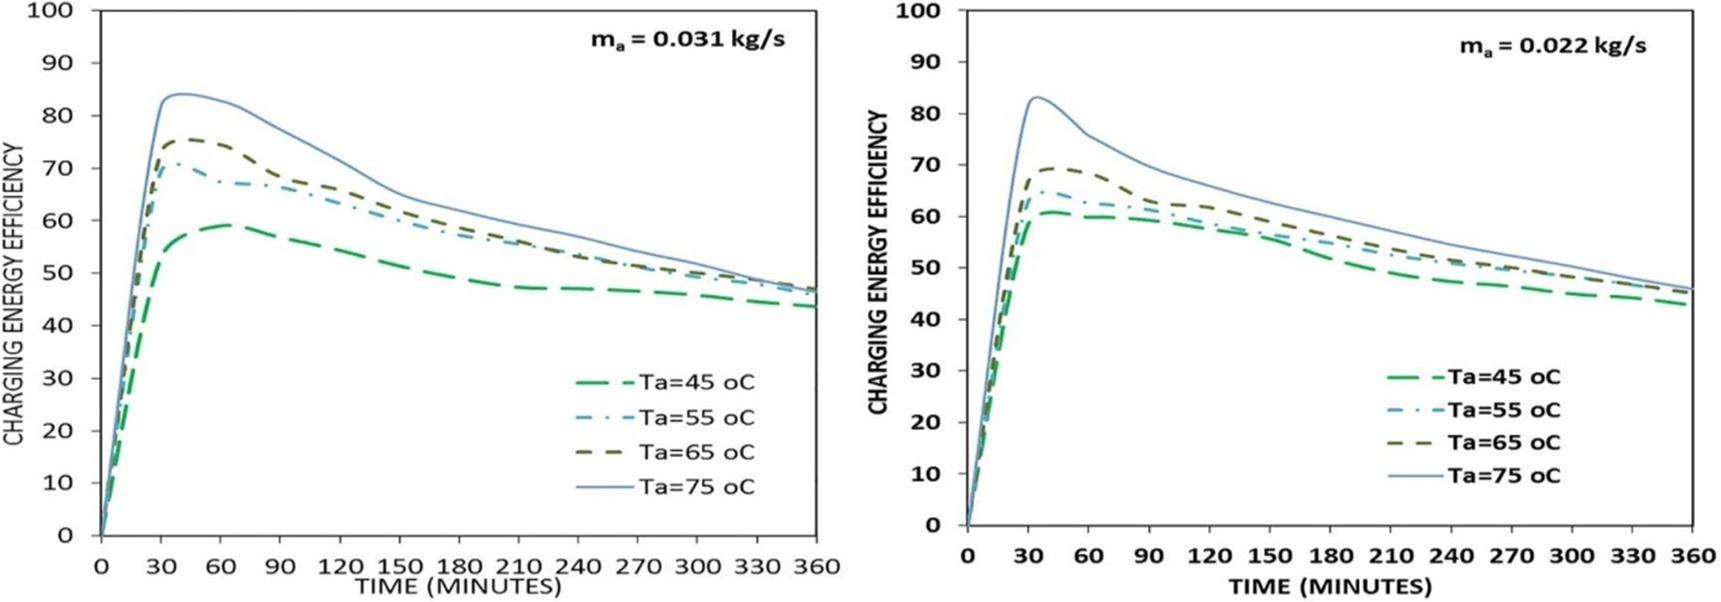
The charging and discharging efficiencies are analyzed with regard to time in Figs. 10 and 11, respectively, to evaluate the SESS's ability to store energy. As observed in Fig. 10, the charging energy efficiency of SESS rises over time, reaches a maximum between 30 and 60 minutes, and then consistently falls off after that. Regardless of the change in air mass flowrate, the SESS's charging energy efficiency rises as the inlet air temperature does. The highest energy efficiency for charging is discovered to be 81.7% and 82.8%, or 75 °C inlet temperature and 0.022 kg/s and 0.031 kg/s, respectively, of air mass flowrate. Similar to charging energy efficiency, discharging energy efficiency varies with regard to time. The maximum energy efficiency for discharging is determined to be 94.1% and 89.8%, respectively, for an input temperature of 75 °C and an air mass flowrate of 0.022 kg/s and 0.031 kg/s. Figures show that over the first 60 minutes, there are noticeable fluctuations in the charging or discharging energy efficiencies.
IV. CONCLUSION
The following findings are the result of the experimental inquiry into the practical energy storage system with numerous cylindrical passages:
1) The sensible energy storage system's temperature variation investigation reveals that during charging and discharging cycles, the greatest spatial temperature differences occur close to the inlet section.
2) The temperature variation of SESS is moderately influenced by the mass flowrate of air, and a higher rise in temperature is seen during the early charging period.
3) For SESS at a higher inlet temperature, the mass flowrate of air has very little bearing on the amount of energy storage and energy release. However, by increasing air mass flowrate at lower air inlet temperatures, the energy storage increases.
4) The existence of multitubular cavities allows the system to diffuse a significant quantity of energy in a shorter length of time with a higher mass flowrate.
5) It is discovered that the highest charging energy efficiency is 82.8% at an intake temperature of 75 °C and an air mass flowrate of 0.031 kg/s.
6) It is discovered that the highest discharging energy efficiency is 94.1%, which corresponds to an air mass flowrate of 0.022 kg/s and an inlet temperature of 75 °C.
7) During the first 60 minutes, there are significant variations in the charging and discharging energy efficiencies.
References
[1] Ravi Kumar, Anil Kumar Patil and Manoj Kumar, 2021, “Charging and Discharging Characteristics of Sensible Energy Storage System with Multiple Cylindrical Passages”
[2] Prasad, L., and Muthukumar, P., 2013, “Design and Optimization of Lab-Scale Sensible Heat Storage Prototype for Solar Thermal Power Plant Application,” Sol. Energy, 97, pp. 217–229.
[3] Kalapala, L., and Devanuri, J. K., 2020, “Energy and Exergy Analyses of LatentHeat Storage Unit Positioned at Different Orientations An Experimental Study,” Energy, 194, p. 116924.
[4] Alva, G., Lin, Y., and Fang, G., 2018, “An Overview of Thermal Energy StorageSystems,” Energy, 144, pp. 341–378.
[5] Heier, J., Bales, C., and Martin, V., 2015, “Combining Thermal Energy Storage with Buildings A Review,” Renewable Sustainable Energy Rev., 42, pp. 1305–1325.
[6] Fleuchaus, P., Godschalk, B., Stober, I., and Blum, P., 2018, “Worldwide Application of Aquifer Thermal Energy Storage A Review,” Renewable Sustainable Energy Rev., 94, pp. 861–876.
[7] Tatsidjodoung, P., Le Pierrès, N., and Luo, L., 2013, “A Review of Potential Materials for Thermal Energy Storage in Building Applications,” Renewable Sustainable Energy Rev., 18, pp. 327–349.
[8] Novo, A. V., Bayon, J. R., Castro-Fresno, D., and Rodriguez-Hernandez, J., 2010, “Review of Seasonal Heat Storage in Large Basins: Water Tanks and Gravel–Water Pits,” Appl. Energy, 87(2), pp. 390–397.
[9] Schmit, H., Pfeffer, W., Rathgeber, C., and Hiebler, S., 2016, “Calorimetric Investigation of the Concentration Dependent Enthalpy Change Around Semicongruent Melting CaCl2.6H2O,” Thermochim. Acta, 635, p. 26e33.
[10] Cabeza, L. F., Svensson, G., Hiebler, S., and Mehling, H., 2003, “Thermal Performance of Sodium Acetate Trihydrate Thickened With Different Materials as Phase Change Energy Storage Material,” Appl. Therm. Eng., 23(13),p. 1697e704.
[11] Mehling, H., and Cabeza, L. F., 2008, Heat and Cold Storage with PCM,Springer, Berlin.
[12] Pielichowska, K., and Pielichowski, K., 2014, “Phase Change Materials for Thermal Energy Storage,” Prog. Mater. Sci., 65, p. 67e123.
[13] Elouali, A., Kousksou, T., El Rhafiki, T., Hamdaoui, S., and Zeraouli, Y., 2019, “Physical Models for Packed Bed: Sensible Heat Storage Systems,” J. Energy Storage, 23, pp. 69–78.
