7 minute read
Chest X-ray Analysis using Deep Learning


Prof. Nisha P. Tembhare1 , Prof. Puneshkumar U. Tembhare2, Prof. Chandrapal U. Chauhan3
1Assistant Professor, Department of Computer Technology, Yeshwantrao Chavan College of Engineering, Nagpur, Maharashtra, India
Advertisement
2Assistant Professor, Department of Computer Technology, Priyadarshini College of Engineering, Nagpur, Maharashtra, India

3Assistant Professor, Department of Computer Science and Engineering, Government College of Engineering, Chandrapur, Maharashtra, India
Abstract: Automatic recognition of key chest X-ray results to help radiologists with clinical workflow tasks like time-sensitive triage, pneumothorax (CXR) case screening and unanticipated discoveries. Deep learning models have become a promising prediction technique with near human accuracy, but usually suffer from a lack of explain ability. Medical professionals can treat and diagnose illnesses more precisely using automated picture segmentation and feature analysis. In this paper, we propose a model for automatic diagnosis of 14 different diseases based on chest radiographs using machine learning algorithms. Chest X-rays offer a non-invasive (perhaps bedside) method for tracking the course of illness. A severity score prediction model for COVID-19 pneumonia on chest radiography is presented in this study.
Keywords: Chest X-ray Analysis, Deep Learning
I. INTRODUCTION
In many therapeutic applications, automated identification of significant abnormalities such as pneumothorax (PTX), pneumonia (PNA), or pulmonary edema (PE) on inch radiography (CXR) is an extensively explored area[1]. The Convolutional Neural Network is one of the most often used deep neural networks for image categorization (CNN). By using joint localization and classification algorithms to explicitly implement localization without the use of local annotation to direct image-level classification, we both address the current drawbacks, including the lack of interpretability and the requirement for costly local annotation, in this work. The respiratory system's key organ, the lung serves as an organ for exchanging oxygen from the air and carbon dioxide from the blood. As a result, they are crucial parts of the respiratory system in humans. The respiratory system is immediately impacted by lung injury, which has the potential to be fatal. Pleural effusion alone accounts for 2.7% of other respiratory disorders in Indonesia, with an estimated global frequency of more than 3,000 cases per million people annually. As the first nation examines stay-at-home strategies [1], deaths from COVID-19 continue to rise [2]. The growing pressure of the pandemic on health systems around the world Many doctors have turned to new strategies and techniques. Chest x-ray (CXR) provides a non-invasive (potentially bedside) tool for monitoring disease progression [3]. In early March 2020, Chinese hospitals used artificial intelligence (AI)-assisted computed tomography (CT) image analysis to screen for COVID-19 cases and simplify diagnosis [4]. Since then, many teams have launched AI initiatives to help triage COVID-19 patients (i.e., discharge, general admission, or ICU care) and allocate hospital resources (i.e., from direct non-invasive ventilation to invasive ventilation). [5,6]. Although these latter tools use clinical data, there is still a lack of practically deployable CXR-based prediction models.
II. RELATED WORK
This section gives a quick explanation of the algorithms utilised in this work, CNN and its Component, as well as a review of various other studies that employed comparable algorithms to complete a goal, such as classifying chest radiographs.
A. Classifying Chest X-ray Images on CNN
In the medical area, particularly in the identification of anomalies based on X-ray pictures, machine learning techniques, particularly deep learning, have gained popularity recently. One of the experiments examined the accuracy of the rice field in 10 situations for the diagnosis of 14 illnesses based on chest radiography and CNN, as carried out by [6]. (Including edema, pleural effusion, pneumonia, etc.) Radiation exposure (after special test). Similar work was done by [7] and [8] and these were also obtained. Reliable accuracy for 14 diseases.
ISSN: 2321-9653; IC Value: 45.98; SJ Impact Factor: 7.538
Volume 11 Issue I Jan 2023- Available at www.ijraset.com
B. Convolutional Neural Network
Artificial neural networks (ANNs), sometimes referred to as neural networks or CNNs, are one form of ANN (NN). It is a machine learning method that draws inspiration from the organisation of the human brain (also known as deep learning because it often includes numerous layers). network of neurons. CNNs and standard NNs are quite similar. In contrast to a standard NN, a CNN has a specific initial layer called the convolution layer that harvests data, particularly picture characteristics. As a result, tasks including image classification, object identification, and picture segmentation are frequently carried out using CNNs. Using Computer Vision, the unstructured data seen in photos and other unstructured data is where this algorithm excels [9]. CNNs are generally divided into convolution layers, combination layers and fully connected layers [10]
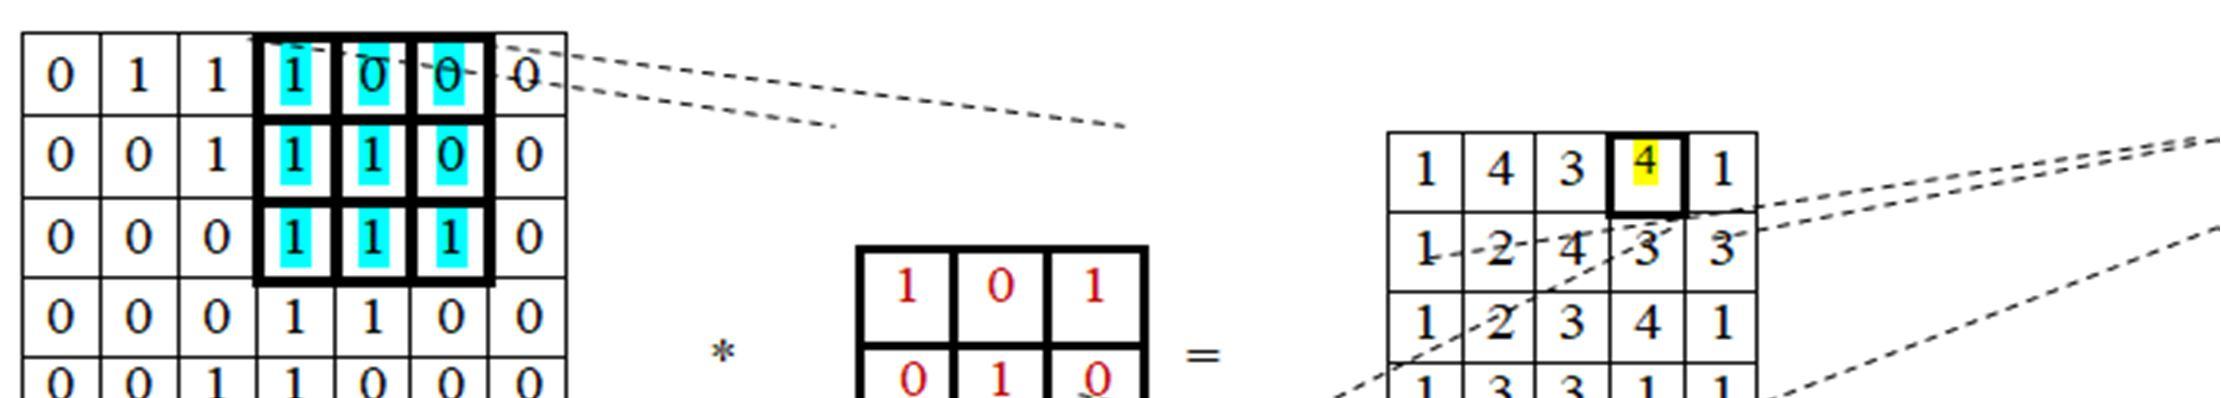
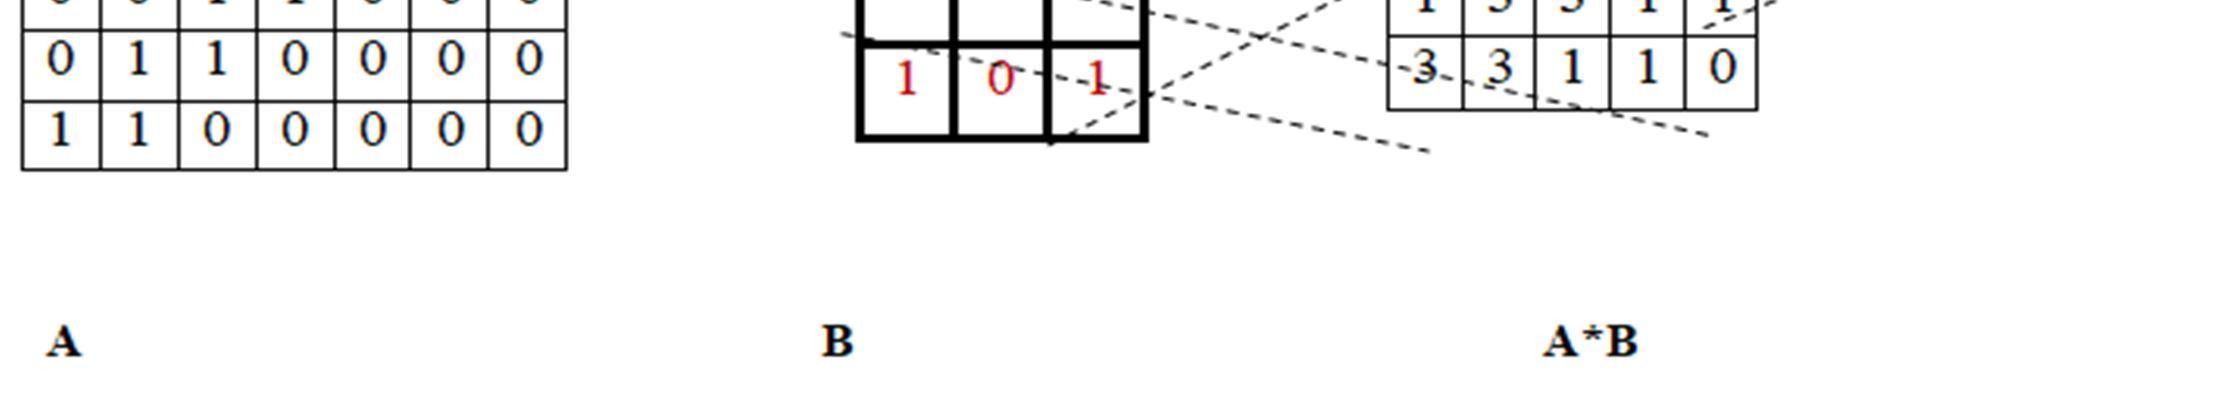
Figure
An example of how convolution works
The feature maps can be nonlinearly transformed by applying a nonlinear activation function to this layer [12]. The ReLU is a typical nonlinear activation function (Revised Linear Unit), Shown in equation (1)
( ) = ( , ) (1)
Where is the output of the neuron (or value in the future map), if ≤ 0, then = 0 and if > 0, then =
A CNN's fusion layer, also known as a subsampling layer, lowers the dimensionality of feature maps by choosing pixel values in accordance with predetermined criteria. Maximum pooling and average pooling are two frequently used pooling layer methods [13]. By maintaining the greatest value in the feature map, maximum merging operates (as shown in Figure 2). In contrast, the average merge searches for the feature map's average value (it is called a global merge if it returns only one value per feature map, or it can also use a kernel configured to return multiple values).
ISSN: 2321-9653; IC Value: 45.98; SJ Impact Factor: 7.538

Volume 11 Issue I Jan 2023- Available at www.ijraset.com
III. METHODOLOGY
There are many steps in this section. We first provide a brief description of the pre-processing methods employed on the data in this work before moving on to the CNN architecture and suggested meta-parameters. Finally, we discuss model implementation strategies, model interpretation methods, and performance measures at the end of this section.
A. Dataset
The biggest chest radiography dataset, Chest X-ray, has a total of 112,120 pictures from 30,805 patients with a variety of advanced lung illnesses. It was used in this study. taken from Kaggle: Chest CT Scan Images [7]. Based on the kind of sickness and the level of health, this dataset is classified into 14 groups. Images were resized to 1024 by 1024 pixels, saved in PNG format, then labelled with one or more tags (overlapping with other diagnoses). They were acquired by means of natural language processing methods from radiologist reports. 81,176 data samples from X-ray scans were used in the investigation. With 1250 photos per dataset and 14 distinct classes, it provides X-ray images of 14 different lung diseases.
B. Proposed CNN Architecture
The visual geometry group's VGG19 CNN model was utilised in this study [17]. A deep CNN model with 19 layers is called VGG19 (16 convolutional layers and 3 FC layers).
The ImageNet dataset served as the basis for the initial parameters of the VGG19 model, which was employed in this work (also called pre-trained model). a convolution layer modified to fit the applied data set in the model architecture's top layer (fully linked layer).
C. Performance Metrics for Evaluation
The model's performance on the test set is evaluated using the confusion matrix utilising several criteria, including accuracy, sensitivity, and specificity
Accuracy: It shows the accuracy of the model. It is the ratio of total actual predictions to total predictions = ( ) (2)
Sensitivity: Measurement using sensitivity (or true positive rate) The ability of the model to correctly classify positive samples. = (3)
Specificity: The model's ability to accurately categorise negative samples is measured by its specificity (also known as true negative rate). = (4)
ISSN: 2321-9653; IC Value: 45.98; SJ Impact Factor: 7.538
Volume 11 Issue I Jan 2023- Available at www.ijraset.com
D. Proposed & Comparative Architectures
1) Image Network: We tested various architectures to pre-process image networks with pre-trained weights from ImageNet. The architectures evaluated are as mentioned below: a) VGG 19: VGG 19 comprises two parts, VGG stands for Visual Geometry Group while 19 represents the deep architecture formed by 19 layers of convolutional neural networks. This is a pre-trained architecture that can classify 1000 different objects. VGG 19 accepts RGB input in the 224 by 224 resolution. The pre-processing that the input image in VGG 19 goes through is subtracting the mean RGB value from every pixel. The VGG deep layer network consists of 16 layers of CNNs along with three complete layer connections ending with a softmax layer.[18] The width of the convolution layer in the starting is 64 channels which increase by a factor of 2 till it reaches 512 channels. The initial two fully connected layers are made up of 4096 channels while the last one performs the ImageNet Large Scale Visual Recognition Challenge (ILSVRC) classification, so this has a thousand channels.[18] The architecture also uses ReLu to bring in non-linearity and decrease the computational time and improve the accuracy. b) Inception V3: Inception V3 is constructed by making some changes in the Inception V2 architecture. The first change is that the starting two 7*7 convolution layer is factored into multiple 3*3 convolution layers. This model is made up of multiple convolutional layers, average and max pooling, dropout, and concat along with fully connected layers. It also uses batch normalization in the model and also to activates the inputs.[19] On the ImageNet dataset, this architecture gained an accuracy above 78.1%. This was developed by Google. Inception V3 has 42 layers but still, its computational time is very less.[19] c) ResNet 50v2: ResNet development was inspired by the VGG networks. This is developed by changing the 34-layer net to the 3layer bottleneck which forms the 50-layer ResNet structure. This is a deep structure consisting of 50 layers. Similar to VGG it can classify 1000 different objects and also accepts an input size of 224*224.[20] ResNet is less complicated than VGG as it has fewer filters. In this structure, the down sampling is done by a convolutional layer having 2 strides. It also has an average pooling layer and a softmax layer.[20] d) Inception-ResNet: It is a deep neural network architecture that is 164 layers deep and can classify 1000 different objects. This accepts an image as input in the resolution 299*299. This is different from traditional Inception as batch normalization is applied only on the top layer and not on the summation layers.[21] The filters used should be not above 1000 because it is noticed that it starts to show irregularities. It contains a convolution network, average pooling, softmax, dropout, stem, and reduction.[21]
E. Model Comparison
We ran various tests on the training set, training the suggested technique and benchmark models, and afterward validating the model with the validation set.
1) Validation Loss: While evaluating we observed that different architectures behave differently on being trained over multiple epochs. VGG 19 validation loss was minimum which reduced from 3 to 0.8. While the other two algorithm validation losses did not improve much and remained almost constant over entire training. ResNet 50 although improved drastically from 6.3 to 2, but could not improve further.
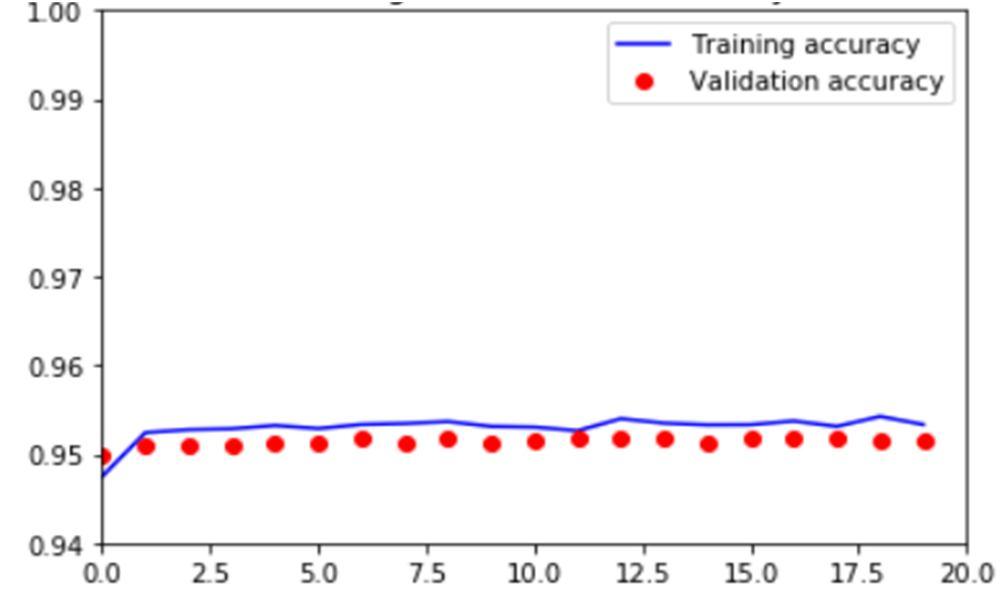
2) Validation Accuracy: The accuracy parameter portrays the model’s efficiency and performance. It is evident from the below graph that VGG19 achieved the best accuracy among the entire sets of architectures used.