
10 VIII August 2022 https://doi.org/10.22214/ijraset.2022.45919

International Journal for Research in Applied Science & Engineering Technology (IJRASET) ISSN: 2321 9653; IC Value: 45.98; SJ Impact Factor: 7.538 Volume 10 Issue VIII Aug 2022 Available at www.ijraset.com 1017©IJRASET: All Rights are Reserved | SJ Impact Factor 7.538 | ISRA Journal Impact Factor 7.894 | Building Predictive Models for Market Research Using Machine Learning Shreyas Mohapatra1 , Sujata Priyambada Mishra2 1ECE Department, RV College of Engineering, Bengaluru, Karnataka, India 2Assistant Professor, ECE Department, RV College of Engineering, Bengaluru, Karnataka, India Abstract: This paper describes the implications of using Machine Learning as a key facet of the methodology in Market Research. With the advent of machine learning and collection of large data sets by service providers, there is a dearth of observational and insightful knowledge of these data pools. Machine Learning and Advanced Quantitative Research are the most common methodologies around that are applied with the appropriate qualitative insights as a concomitant to establish an observational context and gain deeper insights in Market Trends. Several Market Research projects include demand estimation, forecasting models, choice modelling, conjoint studies are which are achieved using Machine Learning. Keywords: Machine Learning, Bayesian Models, Choice Modelling, Deep learning, resource constraints, Recurrent Neural Networks, Discounting Matrix, Overstatements, Open end coding, Optimalization, Regression, LSTM, Logit regression
I. INTRODUCTION
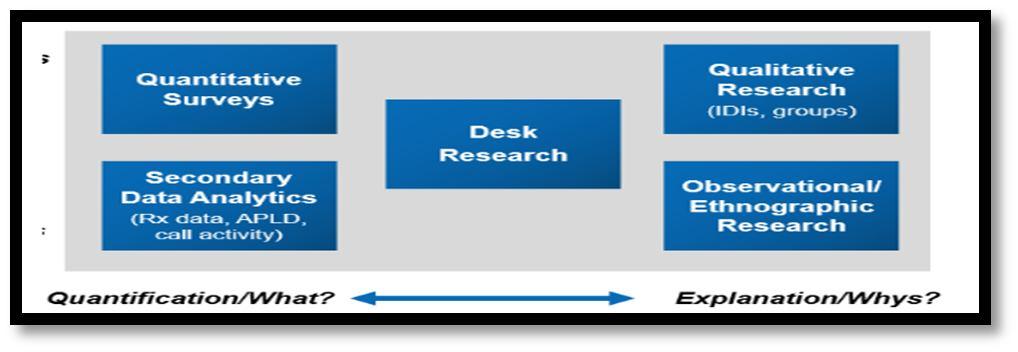
Market research connotes exploration of the market or universe in specific fields as per the requirements and objectives of the task. These include qualitative exercises and quantitative exercises as processes [4,5] for obtaining results. The application of data analysis is to improve accuracy and precision while simultaneously adapting this framework to large datasets as shown in figure 1. Market research overview
II. MARKETRESEARCH
Machine learning is an omnipresent principle used in data analysis for market demand estimation for a sundry of applications. This primarily delves into predictive analysis and model construction for forecasting studies. Choice sampling and trade off exercises are fields where data science comes in handy to provide deeper contextual insights and actionable product offers to clientele or market universe in which the study is implemented on. The utilization of data analysis for comprehension of trade off exercises and adjusted market share in future allocation models is delineated in this report. And the various steps involved to overcome outliers, curate possible scenarios for future market and sizing markets universes with the assistance of quantitative survey. Objectives mentioned in this report are implementation of demand estimation models, contextual insights gained from trade off exercises in conjoint exercise, market research on sample space universe with the assistance of quantitative surveys. Logit regression is computed with the help of R studio. Utilities are coefficients calculated for the multivariate equation that is generated using this machine learning, after full factorial tables are generated using an iterative process in R. All pertinent conceptual gaps are answered and simulated either on excel or on client specific proprietary tools which are developed for these fields of study. Trade off insights is learned after results are displayed. An error rate of 5 % is the norm because of vendor bias, survey bias, and questionnaire bias regardless of the accuracy of the study. And overstatements are a real limitation for the study[1,2,3] hence an adjusted future market share allocation is calculated to decrease the inflated values received in the processes prior to this. The likely hood of trade off exercises are set at 50%. These results are then presented to the client for further product development and implementation in pipeline. Ancillary data cuts are an extra feature that can be obtained by weighting the given segmented data against its sample space universe, which means the model can be stretched to provide results for a wide array of n which can handle a quite small minimum value. This makes the process to be widely applicable across industries and studies, hence is truly revolutionary.
Fig 1.


International Journal for Research in Applied Science & Engineering Technology (IJRASET) ISSN: 2321 9653; IC Value: 45.98; SJ Impact Factor: 7.538 Volume 10 Issue VIII Aug 2022 Available at www.ijraset.com 1018©IJRASET: All Rights are Reserved | SJ Impact Factor 7.538 | ISRA Journal Impact Factor 7.894 |
A[8,9,10]lotof statistical surveying charged today is distinct in nature rather than prescient. Spellbinding data is valuable to describe contours of sample space universe, use examples, and perspectives of people. Past illustrative data, managers need to review research apparatuses that can anticipate what customers will purchase when confronted with the range of brands accessible and horde item attributes. It is unequivocal because of this center that conjoint and trade off insights has become so well known throughout recent many years. Albeit the scores on the property levels offer critical benefit all by themselves, the genuine worth of conjoint examination comes from the imagine a scenario where market test systems that can undoubtedly be grown, frequently inside bookkeeping sheets. That's what it follows if, for every respondent, we can foresee the general allure for all conceivable item profile mixes (given the arrangement of quality levels we estimated), [11] we can likewise anticipate how every respondent could pick whenever confronted with a decision among at least two contending profiles. A proper balance between quantitative studies and qualitative insights are required to be found. Understanding the relationship between multivariate equations and dynamic [12] landscape changes in a market universe will help Market Research. The need for Demand Estimation in pharmaceutical clientele is quite common. [13] The are close tradeoffs amongst associated terms and how they independently and dependently are correlated into the decision making process and are amalgamated into making accurate predictions and attaining high value forecasting results as shown in figure 2.
III.
Figure of choice modelling exercise
2: Overview
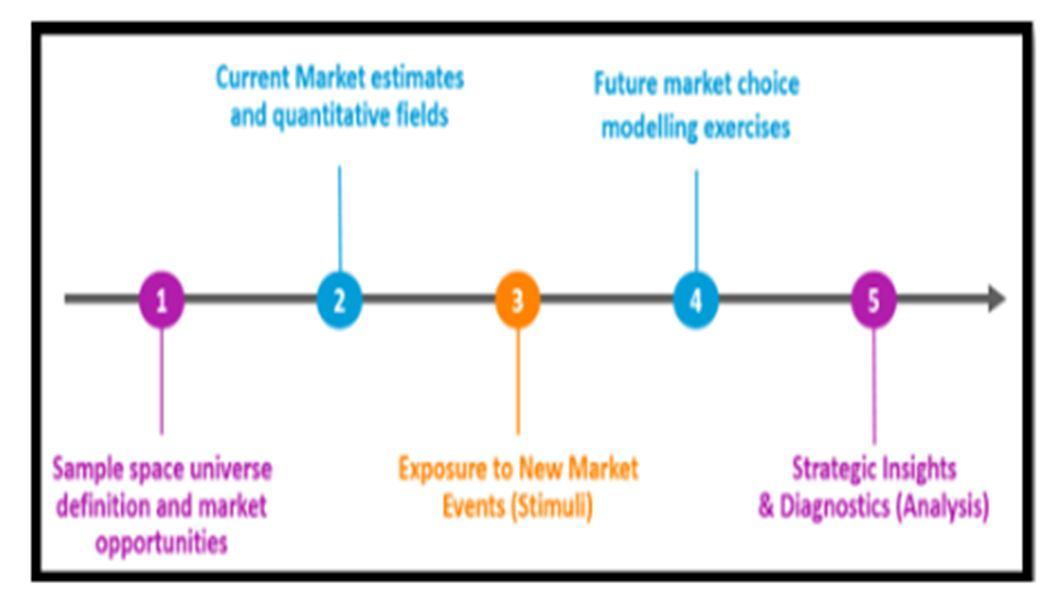
Market Research is coordinated work to accumulate data about on specific markets and clients, familiarizing them, beginning with what their identity is. It is a significant part of business methodology and central in keeping up with new age trends and dynamic changes in this industry. Market Research assists with distinguishing and examine the requirements of the market, the market size and opposition. Its procedures envelop both subjective strategies and objective exercises. Demand estimation is calculated by leveraging current market scenarios against the choices made in the trade off exercises in choice modelling. [6,7] .This would calculate allocation for the future. Subsequently this is done by introducing a stimuli, which means after current market universe is defined and allocations are locked in new scenarios are produced and allocations or a switch pick to the future scenario is done. There are different studies and exercises which can be leveraged for insights and conceptual gaps in Market Research. For demand estimation models, a conjoint study is introduced for future share allocation calculation. BASELINERESEARCH
The process of establishing a baseline for relative calculations and a datum level for forecasting estimates involve extensive research. Market research has extensive material available online but information on integration of data analysis into this iterative and age old process isn't as widely available as expected. A detailed exhaustive and holistic approach to reviewing these papers helped in deeper contextual understanding of the subject and clearing any conceptual gaps the existed in the past. The primary task was to understand the implication of mathematical analysis on demand estimation. How different exercises studies and surveys are leveraged against a specific targeted portion of the sample space universe and then they are introduced the stimuli or a questionnaire based on the requirement of fields. Material that reviewed also included the process and procedures involved in drafting a quantitative survey.
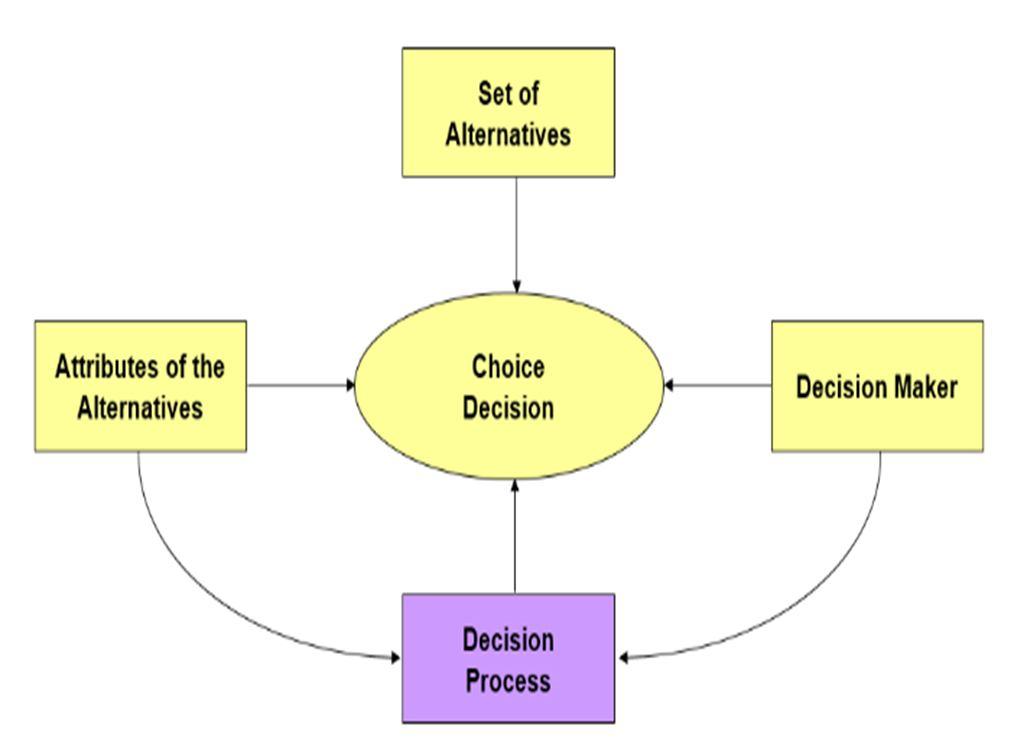
Figure 4: Choice Modelling variables
The integration of data analysis with the help of data science is crucial in this case. With the help of data analysis, we can scale similar procedures to bigger data sets and keep the accuracy and precision of this procedure to give us [15] deeper contextual qualitative insights and actionable quantitative numbers. Methodologies that are implemented for market research demand estimation procedures are as follows, first a quantitative survey or a questionnaire collecting quantitative objective data points is [16] drafted, which is then fielded into the sample space universe. This survey has several components in it. The process that is generally followed during demand estimation exercises is delineated in figure 3.
International Journal for Research in Applied Science & Engineering Technology (IJRASET) ISSN: 2321 9653; IC Value: 45.98; SJ Impact Factor: 7.538 Volume 10 Issue VIII Aug 2022 Available at www.ijraset.com 1019©IJRASET: All Rights are Reserved | SJ Impact Factor 7.538 | ISRA Journal Impact Factor 7.894 |
IV. METHODOLOGY
The survey starts off by a screener section, this cleaner section is responsible for filtering and eliminating around 75 to 80% of all possible respondents in the sample space universe has strict criterion through which a particular respondent gets cleared on to the next section of the survey. Then procedure is always followed up by remaining sections at like Diagnostics, Identifiers, Current market allocation and future market allocation sections which are an example of the choice modelling sampling exercise that was mentioned earlier. All pertinent insightful data is generated through the previous exercise are now presented Microsoft Excel, Python and AWS. [17,18] Some common results that are often represented include the sizing tasks that was completed using the quantitative questionnaire. Other crucial qualitative data is then integrated with quantitative output to provide a holistic view of the problem statement and its subsequent implementation in the pipeline in the resonant version of the solution that was estimated
For instance, we can reproduce what percent of the market would favor every one of POCs (portrayed utilizing the various brands and execution qualities we estimated) if accessible for procurement. These forecasts across an example of respondents are alluded to as portions of decision or portions of inclination. Holding cutthroat contributions consistent, supervisors can deliberately fluctuate the elements of their own item profile, (for example, valuing or execution ascribes) and see what percent of the market would favor their item under each condition. With conjoint test systems, administrators can appraise request bends and replacement impacts, addressing questions like, "From which contenders do we take the most offer assuming we speed up?" They can survey whittling down impacts: "What befalls our general offer in the event that we emerge with another item with lesser execution at a lower cost?" generally, directors can gauge the consequences of millions of conceivable idea/market tests based on information gathered in a solitary review research project among, commonly, 300 to 600 respondents [14]. On the off chance that extra data is incorporated, for example, include costs, PC search calculations can track down ideal item designs (holding a bunch of contenders consistent) to boost offer, income, or benefit.
Figure 3: Overview of choice modelling exercise
The Second Step in the Adjusting Future market shares is Overstatement Adjustment: The physician responses are then adjusted for overstatement using following guidelines: 1. Likelihood to Switch : Degree to which physicians claim they are likely to replace previous treatment recommendation with a new one. It should be >= 30 2. Treatment Goal Certainty Delta : Indication of certainty to achieve treatment goals for each patient in Present Market and Future Market. (FM >= PM +5) 3. Physician Innovativeness: [19] Self reported battery of questions groups physicians into five segments based on innovativeness scores.(Lower innovation = less likely to adopt a new product). Using above a probability of switch is switch is calculated which must be >=55. The final part of the analysis includes Outlier Analysis, here First the output file data processing serves as an input to run the outlier analysis code. After identifying the outliers, the respondents are deleted/removed at the end of the data processing code into the simulator outputs.
V. DATAPROCESSINGANDANALYSIS
The estimates are generated in the form of utility for given individual combinations of designs that are constructed by using full factorial for each of the products. A full factorial design combines the regression output for a given set of attributes and levels to provide a utility product of each combination and at the same time help project the incremental difference in the utilities that are projected as incremental share rise and incremental market share and SOW. (Share of business). [20] After calculating shares in the sample space universe, the industry weights which are a numerical constant and is a true representation is added as a multiplicative factor to the score universe outputs.
Starts with Cleaning data and defining dependent and independent Variables. Data processing is used to clean data and make it ready for further analysis The input are the following files are imported in the data processing step 1. Survey File: Physician specific variables (i.e., physician specialty/setting), innovativeness, and survey specific variables 2 Present Market File: Patient variables, current treatment, choices made by physician from the existing offerings in the present market, PM certainty. 3. Future Market File: Choices made by physician for future market which includes the new drug(s) or existing drug(s) with new indications, product variables, FM certainty etc. Define Independent variables (patient and physician attribute, scenarios) such that it aligns with the patient design. Define Dependent Variables: What choices are to be modeled, and therefore what preference shares can be output from the choice model. The entire sequence and flow of work is is mapped in the figure 5.
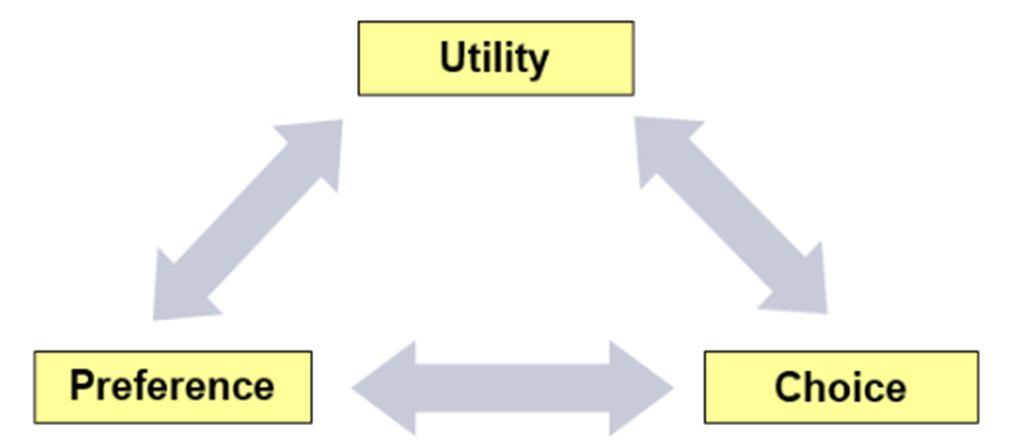
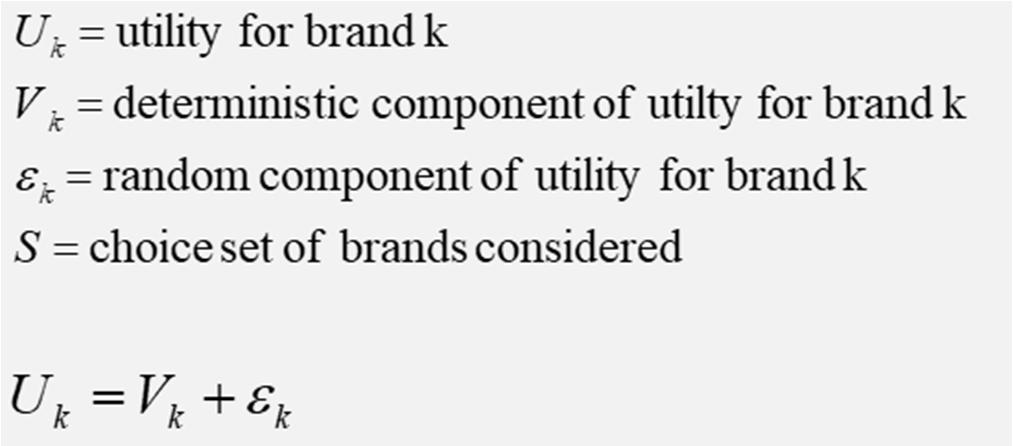
Figure 4 elucidates the correlation between utility, preference and choice. There are several crucial assumptions that are used define the sample space universe in which the exercise is conducted. They primarily revolve around the vendor bias and the inability to obtain a good mix of respondents in any study. The n size requirements are usually capped, but sometimes are treated as a flexible dimension, hence there are constraints that simultaneously exist, while making fundamental assumptions for our exercises. Just to list common constraints, they arise out of variables of assumptions that we have made in prior sections. Vendor bias which skews the data while consolidation Market research surveys are extremely narrow and objective, while making the survey this limits scope of our study hence the field and array of data collected is highly specific. Different types of outliers are very common, straight lining outliers, jumpers, rational but inconsistent data are the most important ones.
VI. SCOREUNIVERSE&WEIGHTING
International Journal for Research in Applied Science & Engineering Technology (IJRASET) ISSN: 2321 9653; IC Value: 45.98; SJ Impact Factor: 7.538 Volume 10 Issue VIII Aug 2022 Available at www.ijraset.com 1020©IJRASET: All Rights are Reserved | SJ Impact Factor 7.538 | ISRA Journal Impact Factor 7.894 |
Figure 5: Flow of data processing
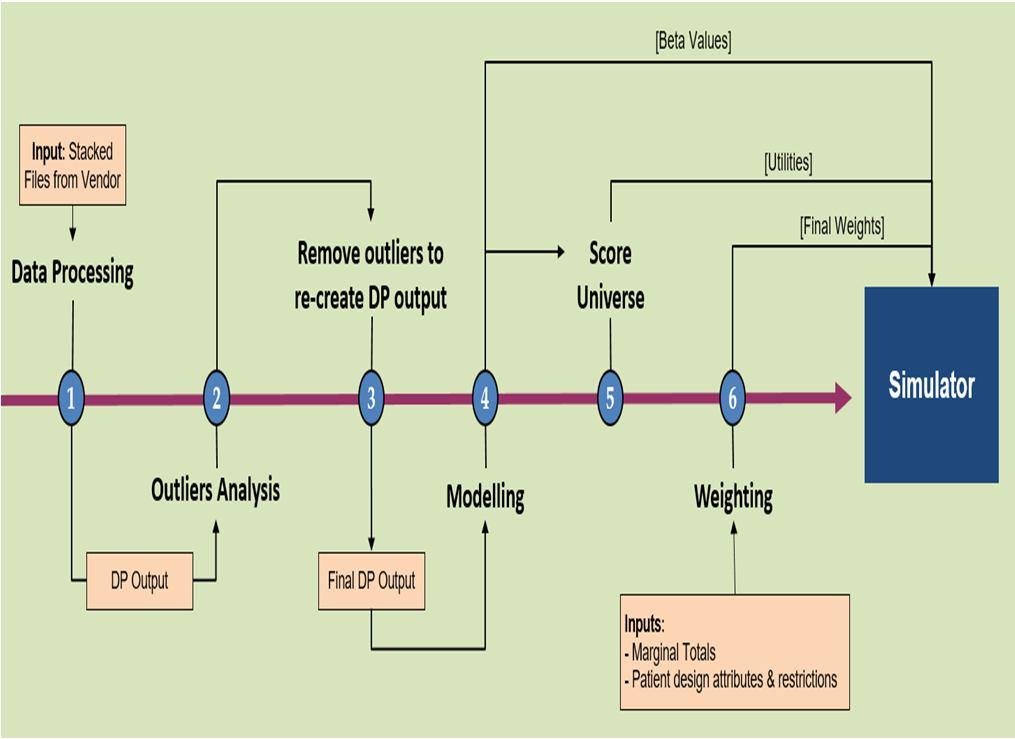
Figure 6: Multinomial Logit Model Here Vk Represents utility that can be predicted by observed factors. The approach of logit models is to expand V as a function of measurable factors. ℇk is the random component can consist of unobserved factors that we could not quantify and truly random factors such as individual mood.
VII. RESULTS&INFERENCE
[21,22]
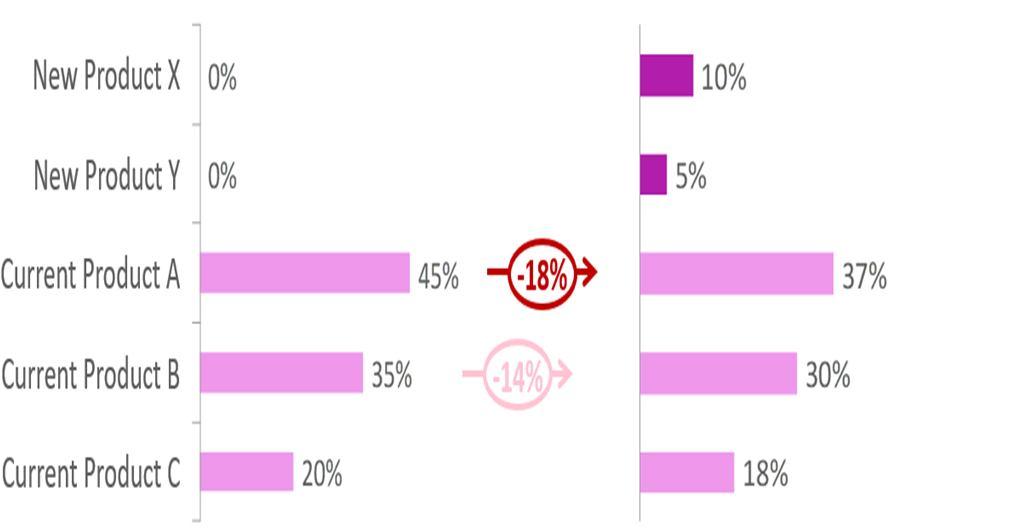
Figure 7: Estimated change in Shares from Current Market to Future Market Machine learning and market research in the future can simultaneously help the gap between the qualitative and quantitative approaches. Machine learning can make the market research domain, which isn’t a pure science and is more then skewed in its assumptions and deliverables can become more accurate. With the advent of data sets being stored by service providers and other institutes, it’s efficacy and knowledge insights can be achieved with the help of the methodology discussed in this paper.
VIII. ACKNOWLEDGMENT
[1] KaiserFoundation.Trendsinpromotionalspendingforprescriptiondrugs,19962007,http://facts.kff.org/chart.aspx?ch=225;2009. pharmaceuticalindustry 2001;110:5517. Survey, U. S. G. (2022, January 31). Mineral Commodity Summaries 2022. Mineral Commodity Summaries. Retrieved July 23, 2022, from https://pubs.er.usgs.gov/publication/mcs2022
International Journal for Research in Applied Science & Engineering Technology (IJRASET) ISSN: 2321 9653; IC Value: 45.98; SJ Impact Factor: 7.538 Volume 10 Issue VIII Aug 2022 Available at www.ijraset.com 1021©IJRASET: All Rights are Reserved | SJ Impact Factor 7.538 | ISRA Journal Impact Factor 7.894 |
I thank Sujata Priyambada Mishra for providing useful insights and comments on the manuscript as well as overall construction of the work. I thank R.V College of Engineering for continued support.
REFERENCES
The output of the score universe after weighting is used as inputs into a dynamic simulator tool. Each attribute of each of the initial patient design code, hence a share component is calculated against each level. Now the future market demand estimation can be calculated against each combination of profiles and each correlation of attributes and levels can be found as per the new shares that was calculated. In figure 7, we can see after the choice modelling exercises where performed, we can forecast future market shares using logit regression, and source of business can also be achieved using a matrix solver.
[2] MelanderH,hlqvistRastadJ,MeijerG,BeermannB.Evidencebasedmedicine selectivereportingfromstudiessponsoredbypharmaceuticalindustry: reviewofstudiesinnewdrugapplications.BMJ2003;326:1171 3. [3] SteinmanMA,ShlipakMG,McPheeSJ.Ofprinciplesandpens:attitudesandpracticesofmedicinehousestafftoward
promotions.AmericanJournalofMedicine
[4] 2022.[online]Availableat:https://pubs.usgs.gov/sir/2004/5217/ [5]
[21]
[20]
Medical Marketing in the United States: A prescription for reform. (n.d.). Retrieved July 22, 2022, from https://www.researchgate.net/publication/228234698_Medical_Marketing_in_the_United_States_A_Prescription_for_Reform https://www.academia.edu/83543915/mixl_An_open_source_R_package_for_estimating_complex_choice_modelsRetrievedAxhausen,K.(2022,July22).Mild:AnopensourceRpackageforestimatingcomplexchoicemodelsonlargedatasets.JournalofChoiceModelling.July23,2022,from_on_large_datasets?f_ri=1137643 Medical Marketing in the United States: A prescription for reform. (n.d.). Retrieved July 22, 2022, from https://www.researchgate.net/publication/228234698_Medical_Marketing_in_the_United_States_A_Prescription_for_Reform [22] Axhausen,K.(2013,January1).Statedresponseandmultiplediscretecontinuouschoicemodels: Analysesofresiduals.JournalofChoiceModelling. Retrieved July 23, 2022, from https://www.academia.edu/83543669/Stated_response_and_multiple_discrete_continuous_choice_models_Analyses_of_residuals?f_ri=1137643
International Journal for Research in Applied Science & Engineering Technology (IJRASET) ISSN: 2321 9653; IC Value: 45.98; SJ Impact Factor: 7.538 Volume 10 Issue VIII Aug 2022 Available at www.ijraset.com 1022©IJRASET: All Rights are Reserved | SJ Impact Factor 7.538 | ISRA Journal Impact Factor 7.894 | [6] RetrievedremovalSotto,R.D.,Lee,X.J.,&Bae,S.(2021,December9).Acuteexposureeffectsoftetracycline,ampicillin,sulfamethoxazole,andtheirmixtureonnutrientandmicrobialcommunitiesintheactivatedsludgeofairscouringandreciprocationmembranebioreactors.JournalofEnvironmentalManagement.July23,2022,fromhttps://www.sciencedirect.com/science/article/pii/S0301479721022271 [7] Survey, U. S. G. (2022, January 31). Mineral Commodity Summaries 2022. Mineral Commodity Summaries. Retrieved July 23, 2022, from https://pubs.er.usgs.gov/publication/mcs2022 [8] pharmaceuticalVarley,C.K.,Jibson,M.D.,McCarthy,M.,&Benjamin,S.(2005,February28).Asurveyoftheinteractionsbetweenpsychiatryresidencyprogramsandtheindustry.AcademicPsychiatry.RetrievedJuly23,2022,fromhttps://eric.ed.gov/?id=EJ808554 [9] DatavisualizationsystembasedonBigDataAnalysis.IEEEXplore.(n.d.).RetrievedJuly23,2022,fromhttps://ieeexplore.ieee.org/document/9523950 [10] hRetrievedGiannakakis,I.(2000,January1).Arabiannights1001talesofhowpharmaceuticalcompaniescatertothematerialneedsofdoctors:Casereport.BMJ.July23,2022,fromttps://www.academia.edu/61056189/Arabian_nights_1001_tales_of_how_pharmaceutical_companies_cater_to_the_material_needs_of_doctors_case_report [11] Gagn%C3%A9/40abf4b8d7b25152231ee2b72e81a7432f51acf8https://www.semanticscholar.org/paper/AninQuinn,B.,Gagné,F.,&Blaise,C.(1970,January1).Aninvestigationintotheacuteandchronictoxicityofelevenpharmaceuticals(andtheirsolvents)foundwastewatereffluentonthecnidarian,HydraAttenuate.:Semanticscholar.undefined.RetrievedJuly23,2022,frominvestigationintotheacuteandchronicof(andQuinn [12] PDF implementing AI Vision for quality inspection within a ... (n.d.). Retrieved July 22, 2022, from xplore_the_Functionality_of_Detecting_Deviations_in_Manual_Assemblyhttps://www.researchgate.net/publication/358622975_Implementing_AI_vision_for_Quality_Inspection_within_a_Manufacturing_Environment_A_study_to_E [13] https://www.sciencedirect.com/science/article/pii/S2667096820300021InternationalVerma,S.,Sharma,R.,Deb,S.,&Maitra,D.(2021,January28).ArtificialIntelligenceinMarketing:SystematicReviewandfutureresearchdirectionJournalofInformationManagementDataInsights.RetrievedJuly23,2022,from [14] Current statusandanalysisof my country'secommercemarketingresearchbasedonCiteSpace.IEEE Xplore.(n.d.).RetrievedJuly23,2022,from https://ieeexplore.ieee.org/document/9759219 [15] Huang/8a88e9710ad9b4cb8db6a3086ede9c531d9949172022,Rust,R.,&Huang,M.(1970,January1).Theservicerevolutionandthetransformationofmarketingscience:Semanticscholar.undefined.RetrievedJuly23,fromhttps://www.semanticscholar.org/paper/TheServiceRevolutionandtheTransformationofRust [16] JulyArtificialIntelligenceParadigmforcustomerexperiencemanagementinnextgenerationnetworks:Challengesandperspectives.IEEEXplore.(n.d.).Retrieved23,2022,fromhttps://ieeexplore.ieee.org/document/8642802 [17] Login.ZSpace.(n.d.).RetrievedJuly23,2022,fromhttps://zspace.zs.com/docs/DOC52473 [18] Theethicsofconsultingwithpharmaceuticalcompanies|RequestPDF(researchgate.net) [19]