2 minute read
International Journal for Research in Applied Science & Engineering Technology (IJRASET)


ISSN: 2321-9653; IC Value: 45.98; SJ Impact Factor: 7.538
Advertisement
Volume 11 Issue IV Apr 2023- Available at www.ijraset.com
III. RESULTSANDDISCUSSION
A. pH and Alkalinity
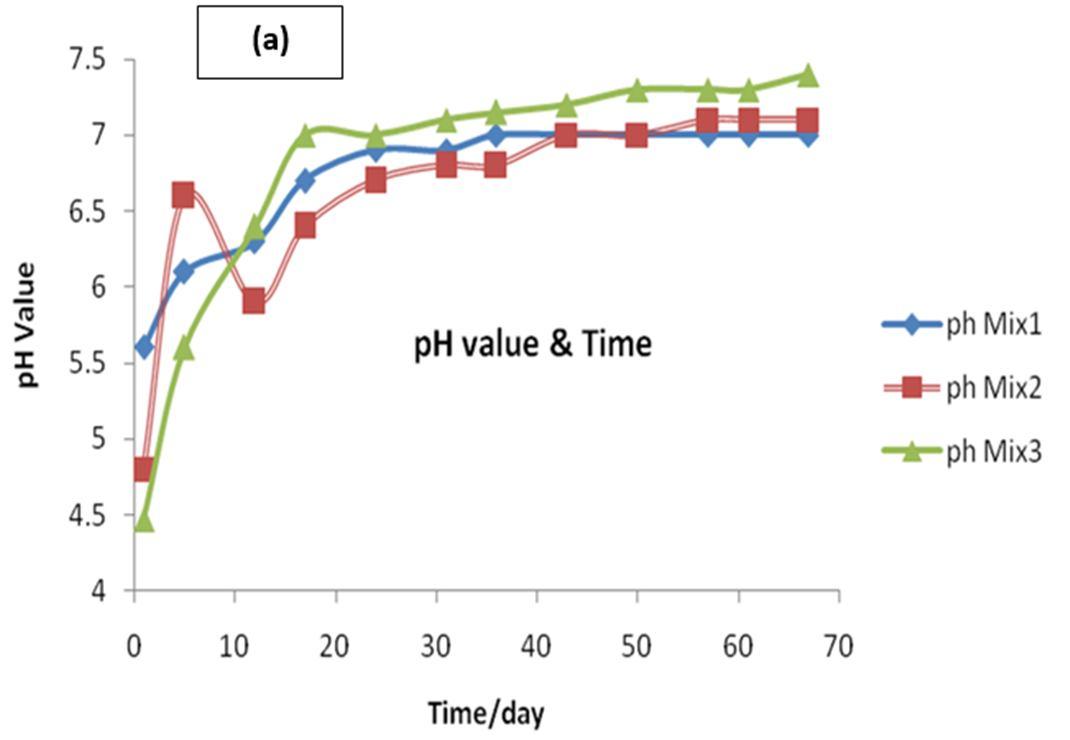
Monitoring of pH shows that the best production of biogas was found at pH 7.0 the kitchen wastes and cattle dung mixtures. This agrees with the results that the optimum pH for anaerobic digesters is ranged from 6.6 to 7.4 [4-6]. The measured pH values for anaerobic digestion of three mixtures at experimental intervals are shown in Figure 2a. The measured pH values for anaerobic digestion of mixture 1 (25% Kit.:75% dung), mixture 2 (50% Kit.:50% dung) and mixture 3 (75% Kit.:25% dung) at experimental intervals are shown in Figure 2a. The pH for mix. 1 started from 5.6 and then increased up to 7.0, for second mix. 2 pH started from 4.8 increased slightly after that decreased to 5.9 and raised again to 7.1, while in the case of mixture 3 the pH started from 4.47 and raised gradualy to 7.3 up to the end Generally, degradation of substrates starts between day one to five and twelve days for mixture3 and mixture 2, respectively, before it commences the production of biogas in the batch operation. This elevation interprets the high quantity of biogas produced from mixture 3 as we will see it after that in biogas estimation experiments. It was noted that when the pH value gradually increases, the biogas production increases gradually. It is known to influence enzymatic activity because each enzyme has a maximum activity within a specific and a narrow pH range. The pH of the digestion liquid material and its stability as well comprise an extremely important parameter. Since, methanogenesis only proceeds at high rate when pH is maintained in the neutral range [7]. Most methanogenic bacteria function optimally at pH 7.0 to 7.2, and the rate of produced gas declines at pH values below 6.3 or exceeding 7.8 [8,9]. The change in pH values for the three experiments at different intervals with hydraulic retention times (HRT) per day are represented in Fig. 2a. It is clear that there is change in pH values for the three experiments at different intervals.
The result of alkalinity has great role for the proper control of pH. For the mixture experiment, total alkalinity at the beginning was 5500 mg/L, reached 6700 mg/L at the end of the experiment. Also, for first experiment, total alkalinity was 4800 mg/L at the beginning reached 5950 mg/L at the end of the experiment. For second mix., the alkalinity was 5900 mg/L at the beginning reached 6810 mg/L at the end of experiment.
These results illustrated in Figure 2b exemplifies and agree that the components most affecting the alkalinity of a digester are the equilibrium between carbon dioxide and bicarbonate and that between ammonia and ammonium, with the most dominant determined by the substrate [10].
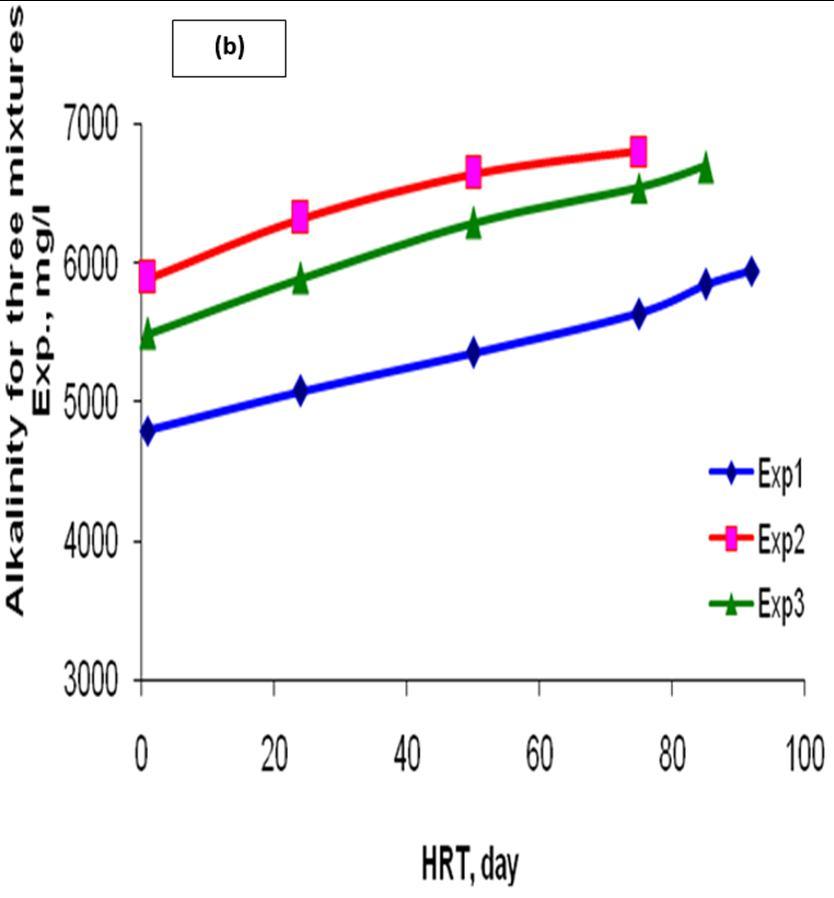
For instance, a first mix. Substrate high in proteinaceous wastes is associated with high alkalinity due to the release of amino groups and ammonia production. Therefore, alkalinity is mostly present in the form of carbon dioxide in the gas phase and bicarbonate in the liquid phase. Carbon dioxide is released through the degradation of organic compounds and both CO2 and ammonia are released through the breakdown of amino acids and proteins. There are some differences among alkalinity value for the first experiment, second experiment, and the last experiment for mixture three.


