17 minute read
International Journal on Cybernetics & Informatics (IJCI) Vol. 12, No.2,April 2023

The correlation coefficient is treated by measuring distance to make it conform to the European distance axiom: (1) ������ =0if and only if�� =��; (2)������ =������;(3)
The ������is the distance between the assets �� and ��. [15]
Advertisement
The MST is mainly used to filter the network for redundant links, extract important link information from the financial market.[15] For a financial market network with N nodes, all possible links are ��(�� 1)/2. The MST selects the �� 1 stronger link, which corresponds to the shortest path of all vertices on the graph, redundant links do not appear in the MST. In this paper, Prim algorithm is used to construct the MST.
3.2. Network Centrality of the Stock Market Volatility
Network centrality is a key index to measure the statistical characteristics of the network, which can quantify the importance of nodes in the network. According to the 3.1section, the volatility network with ��share indexes can be expressed as�� ={��,��}, which is composed of nodes �� and edges ��, ��is the set of share index volatility If the volatility of the node �� and �� have relation, then there is (��,��)∈��. In order to extract the information of the volatility network, converting it into the adjacency matrix�� =[������]. As the non-weight undirected network, there is �� ∈[0,1]. When (��,��)∈��, there is ������ ≠0. Since (��,��)∈��
, there is �� =���� .
The index of network centrality measurement mainly includes degree centrality, betweenness centrality, closeness centrality and eigenvector centrality. The degree centrality is used to calculate the number of share indexes that linked to a country's share index, which reflecting the position of the country's share index in the global stock market. The meaning is intuitive, the larger the value of nodes the more share index relation to it. Betweenness centrality is a key index. The larger value, the higher the central position of the share index in the network. Closeness centrality index is the reciprocal of the sum of the shortest distances from the share index to all other share indexes multiplied by the number of other share index nodes. The higher value, the closer to the central of the network, the more important it is in the network. The eigenvector centrality is defined as the proportion sum of the centrality of adjacent node��, which is expressed as���� =�� 1��������������, node�� acquires a highereigenvector centrality by connecting to many other nodes or nodes with a high centrality. Since the centrality of eigenvector can absorb the quantity and quality information of adjacent nodes. Eigenvector centrality can most accurately reflect the key nodes of the market
3.3. Dynamic Network of Stock Market
In the past ten years, stock markets both of China and ASEAN have been affected by sudden shocks. Thus, the structure of the volatility network of it is not stable and has characteristics of changing over time. In order to study the evolution characteristics of the network structure, by the cross-correlation matrix, we use the sliding time window to calculate the mean, standard deviation and other indexes, and the performance change over time for the network average degree and other statistical characteristics. The specific procedures are: 100 observations are calculated each time, measuring them recursively, moving along the time scale, and the window step is 1. Then, we get a total of 1415 windows as the complete example.
International Journal on Cybernetics & Informatics (IJCI) Vol. 12, No.2,April 2023
We calculate moments of the correlation matrix for each time window, mainly evaluating the mean value and the standard deviation of the correlation matrix and the statistical characteristics of the generalized time-varying correlation matrix of the stock market network, and then evaluating the network evolution and stability. The moment of the correlation matrix is defined as follows:
Similar with the definition of mean value of correlation coefficient, the definition of variance, skewness and kurtosis is as follow:
Where in, ��(��)is the average value of the correlation matrix on the�� trading day, and ������(��)is the correlation coefficient of assets �� and assets ��on the �� trading day.
4. DATA DESCRIPTION AND DESCRIPTIVE STATISTICS
Our research object is the stock market index of China and ASEAN-9 (see Table 1), which have the time range from March 1, 2016 to November 22, 2021,with a total of 1515 observations, and the research scope includes 10 countries’ stock market indexes: China (CSI300), Laos (LXS), Singapore (SGX), Thailand (SET), Vietnam (VN), Malaysia (FTSE), the Philippines (PSEI), Cambodia (CSX), Japan (N225), and South Korea (KRX). The reasons for choosing them are mainly based on the availability of data and the closeness of various countries’ stock markets. As some of theASEAN-9 lack of stock market indexes, and considering Japan and South Korea are geographically close to China and ASEAN, they may be closely related to the stock markets of China and ASEAN, this paper brings them into the scope of research. The closing price and trading volume of share indexes of various countries are from Wind Financial Terminal. The trading time of share indexes in those countries does not correspond to each other. If we simply adopt the "common time window" method to process data, namely, deleting the share index data that cannot be matched by the trading time, and a large amount of data will be lost. Therefore, we use the moving median with a window length of 10 trading days to replace and complete the missing values of share indexes in those countries

In order to further study the changes in the volatility correlation of the stock markets of China and ASEAN by the impact of major emergencies, we used the idea of event research method to analyse the COVID-2019. We use the dataset we mention above with difference time range which October 15, 2019 to January 5, 2021, and divide it to 3 sub-sample by time. Due to the widespread impact of the COVID-2019on the world, the World Health Organization (WHO) declared it as a global pandemic on March 11, 2020. Based on this, the 3 sub-sample is divided as follow: (1) Before the outbreak: October 15, 2019 to March 10, 2020; (2) Outbreak period: March 11, 2020 to August 7, 2020; (3) Duration of epidemic: August 10, 2020 to January 5, 2021. All of the sub-sample have 102 trading days.
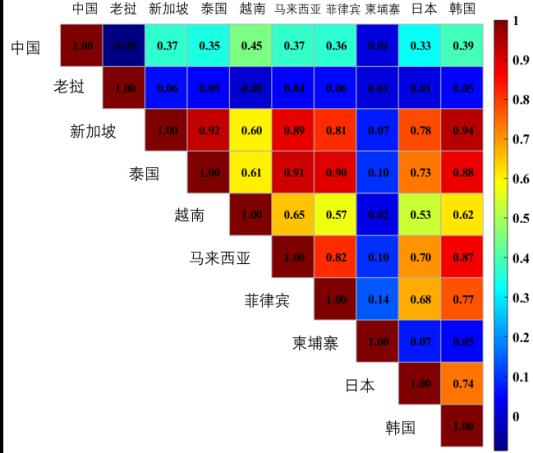
As shown in Figure 1, selected the trend of share index volatility of China and ASEAN-9 in the whole sample. In the first half of 2020, the wave of share index volatility of almost all countries were amplified, and China, South Korea, Singapore and the Philippines leading the way among all countries, that is closely related to the epidemic situation. Figure 2 shows the correlation chart of the stock index volatility of China and ASEAN-9 The share index volatility of countries which have more developed stock market among them, under the full sample state, have close relation with the other country in static linkage of the share index volatility In the correlation chart, the share index volatility of Singapore, Japan and South Korea with other countries fall into a red block which is strong correlation block. In addition, the linkage between stock markets of ASEAN is generally obvious, but the static linkage of the share index volatility between China and the other 9 countries is not close.
5. EMPIRICAL TEST
5.1. Static Structure of Share Index Volatility Network
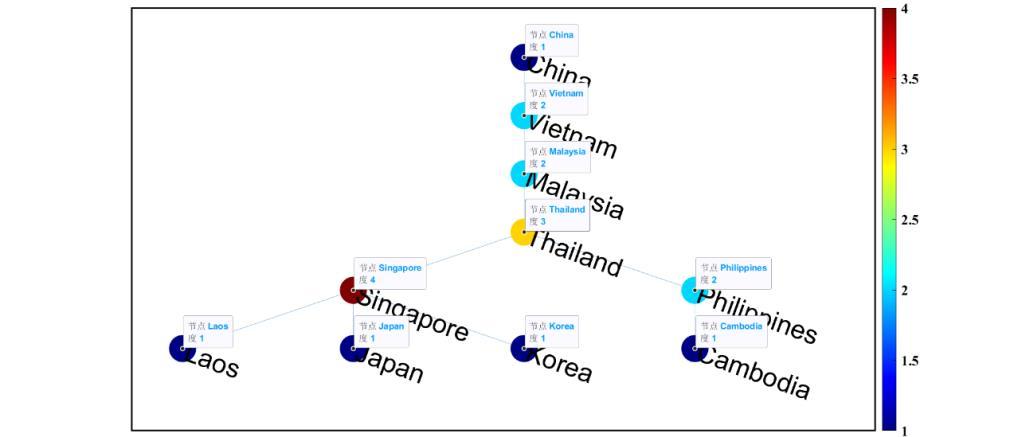
Firstly, investigating the overall structure of the share index volatility network which reflects the correlation structure of share index volatility. We gave the MST of the share index volatility network of China and ASEAN-9 under the full sample in Mar 1, 2016 to Nov 22, 2021. In the MST, the link mode of the market intuitively reflects the connection and tightness between the markets, and the link presents a clustered correlation structure of the stock market. Specifically, China, Vietnam, Malaysia and Thailand form Group 1, Philippines and Cambodia form Group 2, and Singapore, Laos, Japan and Korea form Group 3. The stock market of countries in the group are more likely to influence each other It is easy to find that those groups are related to the level of national economic development and the stock market development The stocks markets of
International Journal on Cybernetics & Informatics (IJCI) Vol. 12, No.2,April 2023 relatively developed countries tend to form clusters, such as Japan and Singapore. The stock markets of developing countries with a relatively high level of economic development, such as China, Vietnam, Malaysia and Thailand, belong to the same group. The most backward markets in the sample form a group.
Secondly, as a further study, we investigated the difference in the overall structure of the share index volatility network before, during and after the COVID-2019. The average cross correlation coefficient is given in Table 1. Table 1 shows that the COVID-2019 made the overall correlation of the stock market between China and ASEAN-9 have significantly increased. Also, during the outbreak, the average cross correlation was about 42% higher than before, and about 132% higher than after. This means that the convergence tendency of the behavior patterns for the share index in the 10 countries increased significantly under the sudden impact. That highlight the importance of the major sudden emergencies research on the research of the overall structure in stock market. The impact is basically within the time range of the epidemic outbreak defined in this paper The average cross correlation falls rapidly after the event, even lower than the level before the event.
5.2. Impact of Stock Market Volatility Network
The network centrality of share index volatility network reflects the importance of nodes. We first analysed the degree centrality. A degree is defined as the number of links of a given node. The higher degree, the higher amount of correlation markets, the higher importance. As the Figure 3, we used different colour to represent the degree centrality of the node of the share index volatility network in the MST of 10 countries. As the results, the key node was Singapore (��=4), and the secondary key node was Thailand (��=3). The centrality of the volatility network is an important basis for identifying key nodes in the stock market. The more centrality of the share index, the deeper it is embedded into the market network, the greater the impact on the market. Then, the most central key node is the first to be impacted, which is the source of market risk and transmits the volatility information to the share index that are directly related to it.
Also, we investigated the betweenness centrality which provides different perspectives for measuring market centrality. The betweenness centrality for a node is defined as the number of shortest paths through it, which represents the transit effect of a market. Similar with the result of the degree centrality, the share index volatility of Singapore (��=21) and Thailand (��=26) had the largest betweenness centrality, and Thailand was the large stone That reflects that, in the share index volatility network, both Thailand and Singapore share indexes are the key role for link in the MST
Furthermore, we analysed the closeness centrality which is the reciprocal of the average distance between a node and all other nodes, and reflects the closeness of a node to other nodes in the network. The results similar with previous. Thailand (��=0.063) and Singapore (��=0.055) where the share indexes with the largest closeness centrality respectively.
Finally, in the share index volatility network, the importance of a node depends on the number of its neighbour nodes (namely, the degree of the node), and also depends on the importance of its neighbour nodes. The more important the neighbour nodes, the more important the node is. The eigenvector centrality can absorb the quantity and quality information of the neighbour nodes, which is just the important centrality index to describes the feature. The eigenvector centrality proved once again that Singapore (��=0.202) and Thailand (��=0.183) were the key nodes of the network.
From the geographical perspective, the share indexes of Singapore and Thailand ware the key nodes can be understandable. Singapore is the financial center and logistics center of Asia and even the world, and Thailand is the central region of the entire ASEAN. As the share index of key node, the systematic risk of the stock market generally spreads to the node with lower centrality through the key node with the highest centrality, and finally spreads to the nodes of peripheral countries. As the perspective of risk prevention and control, grasping this communication mechanism to track and monitor the high centrality share index nodes in a targeted manner during the outbreak of major sudden emergencies. These will help to mitigate the transmission risk of market fluctuations which caused by large fluctuations in other countries' markets.
Table 3. Topological characteristics of share index volatility networks in China and ASEAN-9
Generally, the financial market network belongs to scale-free network, which has the network characteristics follows the power law distribution. The degree of a node in the network is defined as the sum of the connected edges, which means if there are �� edges for a node, the degree is��. A degree distribution��(��) reflects the degree distribution of each node in the network structure. If the node degree distribution follows the Power-law distribution, then there is the distribution relation:��(��)∼�� �� , which indicate that the network is scale-free or has scale-free structure. There are some studies find the financial network is the scale-free structure. The topological properties of scale-free networks are related to the degree index. Generally, the degree index is less than 2is abnormal in network, and the number of links at the largest hub node grows faster than the size of the network. Also, when the degree index is between 2 and 3 and greater than 3, they are scale-free networks and random networks, respectively. In this case, the first and second moment of the degree distribution are limited. When the degree index is greater than 3, scale-free networks and random networks have no significant difference. In Table 3, the results shows that the degree index�� of China and ASEAN-9was in the range of [2.69, 3.5] before, during and after the epidemic, indicated that this was a scale-free network, and the degree index��of China and ASEAN-9 increased to varying degrees during the epidemic outbreak
5.3. Dynamic Structure of Stock Market Volatility Network
The evolution characteristic of the share index volatility network reflects that the overall risk of the volatility network changes with time. We use the sliding time window technology1 to calculate the time-varying mean, standard deviation, skewness and kurtosis of the time-varying cross correlation matrix for the share index volatility network of 10 countries, as well as the eigenvector centrality
1The size of the sliding time window is balanced between excessive noise and excessive smoothing. The window size is set to 100 days. 100 observations are calculated each time and these measurements are estimated recursively. The window moves along the time scale with a window step of 1.Atotal of 2092 observations were selected from Mar1, 2016 to Nov 22, 2021. According to the above procedures, we get a total of 1991 windows as the complete example.
As shown in Figure 4, dynamic network analysis shows that the overall risk is time-varying. The average cross correlation coefficient of the share index volatility risen rapidly in the major sudden emergencies. The more prominent is the Sino-US trade friction in 2018, the Brexit and the COVID-2019 around 2020 Especially, the impact of COVID-2019 was the biggest that reached the highest for the correlation of the share index volatility of 10 countries within the sample range The Sino-US trade friction in 2018 and the Brexit also led to turbulence in the stock markets of China and ASEAN, which was directly reflected in the sharp rise in the correlation of share index volatility. The facts above show that the information link structure of the market changed over time under the impact of COVID-2019. Since the network structure was affected by the source of the impact and the first affected share index, major sudden emergencies broke the original structure and triggered the information link in the market. As for the evolution of eigenvector centrality of China and ASEAN-9 over time, we focused on how the importance of share indexes of major countries changes during the COVID-2019. The more was key node of the market for a country, the more it can become the source of market risk under external shocks. The average time-varying eigenvector centrality (��) of each country was shown in Table 2.
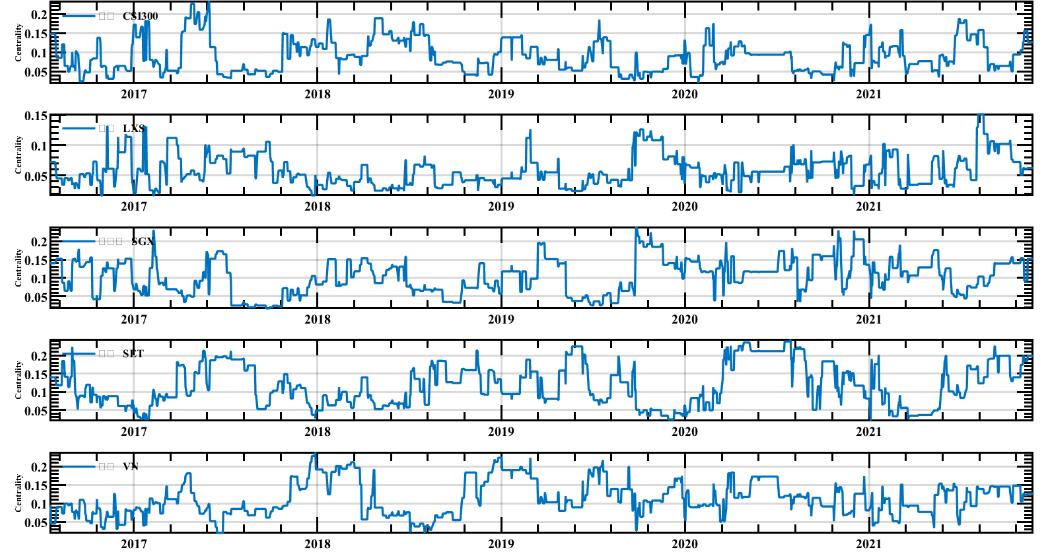
As shown in Figure 5 and 6, during the COVID-2019, the time-varying centrality of major countries evolved with the volatility of the share index risen. This indicated that the information link structure between share indexes is variable. During the outbreak of COVID-2019, the centrality of Singapore, Thailand and Japan increased significantly, which means that the market fluctuation information mainly came from these countries and played a leading role in influencing stock market volatility of other countries at that time. In addition, there were differences in the rhythm of the centrality evolution of major countries, such as Laos and Cambodia, had not significantly changed for their share index during the outbreak which defined in this paper But the centrality of them has increased significantly in the second half of 2020, which is related to the relative lag in the outbreak of the epidemic and the lag in the confirmation of the epidemic data. For example, China and Japan had earlier outbreak of the epidemic so the stock market is not closely linked to the other countries. The relative instability and the difference rhythm of the change of the stock market centrality in various countries in the network structure, that reflected the instability feature of the co-movement of the share index volatility network.

6. CONCLUSION
This paper constructs a volatility network of stock market indexes in China and ASEAN-9, takes the COVID-2019 as an example to investigate the impact of major sudden emergencies on the volatility network of share indexes, and analyses the mechanism of cross-border transmission of market risk and the characteristic of key nodes. The research conclusions are as follows:

First, the volatility network better depicts the link characteristics and tightness in share index volatility of various countries. The COVID-19 led to a significant increase in convergence of behaviour patterns of major country stock indexes, and significant differences in node changes and topological features of the volatility network. The share index volatility network of major countries reflects clustering and homogeneity based on geographical distribution. Singapore and Thailand's share indexes are key nodes and sources of market risk in cross-border stock markets. The risk spreads through the key nodes The most centrality key node is the first to be impacted by the sudden shock, which is the source of market risk and transmits the fluctuation information to the directly related share index. The above conclusions are helpful for market regulators to grasp key objects of the financial market to monitor the high centrality nodes and the nodes
International Journal on Cybernetics & Informatics (IJCI) Vol. 12, No.2,April 2023 connected of them. Deploying risk prevention measures that combinates with the law of network centrality, intervening in advance or even designing the "firewall" mechanism transmission path to prevent violent market shocks.
Secondly, the evolution of the share index volatility network reflects the overall risk of the volatility network change over time. The sharp rise and decline driven by "major events" is a typical feature. The information link structure of the market changes over time. Major emergencies broke the original structure and triggered information connection in the market. As major external shocks are easy to spread and pass on, the systematic risks of the stock market cannot be ignored. It is suggested that market regulators should always pay attention to the market dynamics, do an early warning and prepare a response plan as soon as possible to prevent risks spreading to other markets. Under the impact of emergencies, targeted risk management and risk management measures should be formulated.
Acknowledgements
Supported by National Social Science Foundation of China (No. 19XGJ017).
References
[1] Huang.B.N,C.W.Yang,Johan W.S.Hu, (2000) “Causality and Cointegration of Stock Market among the United States,Japan,and the South China Growth Triangle,” International Review of Financial Analysis, 3.
[2] Tatsuyoshi Miyakoshi, (2003)“Spillovers of stock return volatility to Asian equity markets from Japan and the US,” Journal of International Financial Markets, Institutions and Money, 13 (4) :383399.
[3] Hong quan Zhu,Zudi Lu,Shou yang Wang, (2004) “Causal Linkages among Shanghai,Shenzhen, and Hong Kong Stock Markets,” International Journal of Theoretical and Applied Finance,7(2).
[4] Wu Z,Xu N, (2004)“VAR Research on Interaction of Domestic Stock Market withInternational Stock Market,” Journal of North China University of Technology,(04):1-4.
[5] Zhang B, (2005)“Information Internationalization of China's Stock Market: A Test Based on EGARCH Model,” International Finance Research,(5):68-70.
[6] Wang Z, Zhang X, (2009)“Analysis of the Impact of the Subprime Crisis on the Linkage of China US Stock Markets,” Economic Forum,(09):33-35.
[7] Teng K T, Hwang Y S, Yean C S, (2013)“Synchronisation of Stock Market Cycles: The Importance of Emerging and Developed Markets to ASEAN-5,” Papers, 22(4): 435-458.
[8] Teng K T,Yen S H,Chua S Y, (2013)“The Synchronisation of ASEAN-5 Stock Markets with the Growth Rate Cycles of Selected Emerging and Developed Economies,” Margin the Journal of Applied Economic Research, 7(1):1-28.
[9] Mandigma MBS, (2014)“Stock Market Linkages among the ASEAN5+3 countries and US:Further Evidence,”Management &Adminidtrative Science Review,3(1):53-68.
[10] Lean H H,Smyth R, (2014) Stock Market Co-movement in ASEAN and China, Emerging Markets and the Global Economy, 603-622.
[11] Lei C,Mei L,Fei Y E (2015),“Dynamic Asian stock market convergence:Evidence from dynamic cointegration analysis among China and ASEAN-5,” Economic Modelling,51:84-98.
[12] Chien M S,Lee C C,Hu T C,et al., (2015)“Dynamic Asian stock market convergence:Evidence from dynamic cointegration analysis among China and ASEAN-5,” Economic Modelling,51:84-98.
[13] Teng K T, Yen S H, Chua S Y, et al., (2016)“Time-Varying Linkages of Economic Activities in China and the Stock Markets in ASEAN-5,” Social Science Electronic Publishing, 10(2):137-152.
[14] Mao W,Hao M, (2017)“Interaction between China and ASEAN-5 Stock Markets,” Journal of Guangxi University of Finance and Economics,30(02):44-55.
[15] Mantegna R N, (1999)“Hierarchical structure in financial markets,” European Physical Journal B, 11(1): 193-197.
International Journal on Cybernetics & Informatics (IJCI) Vol. 12, No.2,April 2023
[16] Engsted T, Tanggaard C, (2004)“The Comovement of US and UK Stock Markets,” European Financial Management, 10(4): 593-607.
[17] Vladimir Boginski, SergiyB, PanosM P, (2006)“Mining market data: A network approach,” Computers & operations research,33(11):3171-3184.
[18] Li P,Wang B H, (2006)“An approach to Hang Seng index in Hong Kong stock market based on network topological statistics,” Chinese Science Bulletin, 51(5): 624- 629.
[19] Huang W, Zhuang X, Yao S, (2008)“Analysis of Topological Properties and Cluster Structure of China's Stock Association Network,” Management Science, (03):94-103.
[20] Zhang H, Huang G, (2009)“Building channel networks for flat regions in digital elevation models,” Hydrological Processes, 23(20): 2879-2887.
[21] Aste T., Shaw W.,Di Matteo T, (2010) “Correlation Structure and Dynamics in Volatile Markets,” New Journal of Physics, 12(16):2498-2498.
[22] Namaki A, Shirazi A H, Raei R, et al., (2011)“Network analysis of a financial market based on genuine correlation and threshold method,” Physical A-statistical Mechanics and Its Applications, 390(21): 3835-3841.
[23] Nobi A, Lee S, Kim D H, et al., (2014)“Correlation and Network Topologies Local Stock Indices,” Physics Letters A, 378(34): 2482-2489.
[24] Deng C, Chen X, (2014)“Research on financial contagion risk model based on complex networks,” China Management Science, 22(11):11- 18.
[25] Ouyang H, Liu X, (2015)“Analysis on the Systemic Importance and Systemic Risk Infection Mechanism of Chinese Financial Institutions,” China Management Science,23.(10) :30- 37.
[26] Liu W, Zhang W, (2014)“Analysis of Global Share index Network Characteristics under the Financial Crisis,” Journal of Shandong University of Finance,(03):11-17.
[27] Xie C, Hu X, Wang G, (2020)“Research on the Dynamic Evolution and Stability of China's Stock Market in the Past 10 Years of the Financial Crisis An Empirical Study Based on the Perspective of Complex Networks.” China Management Science,28(06):1-12.
[28] Alizadeh S , Diebold B, (2002)“Range-based estimation of stochastic volatility models,” Journal of Finance.
[29] Pritsker M, (2001) “The Channels for Financial Contagion,” Springer US.
[30] Kaminsky G L , Reinhart C M, (2000)“On crises, contagion, and confusion,” Journal of International Economics, 51.
[31] Forbes K ,Rigobon R . No Contagion, (2010) “Only Interdependence: Measuring Stock Market Comovements,” The Journal of Finance, 57(5):2223-2261.
Author
Wangke Yu is working as vice professor in School of Business, Nanning University, China. He is also a senior engineer. His field of research interest is capital market.
Ruoqi Pan is the first corresponding author of this paper. She has completed MSc in Computer and Information Systems. She is working as lecturer in School of Gaobo Software, Nanning University, China. She also an engineer. Her fields of research interest are machine learning, quantitative analysis and computer application.
Ke Huang is the second corresponding author of this paper. He has completed Ph.D. in economic. He is working as research assistant in School of Digital Economic, Nanning University, China. He concurrently holds the post of Sino British Blockchain Industrial Technology Research Institute of Guangxi University. His fields of research interest are financial measurement and quantitative transaction.
