

Prepared by Ben Albright President & CEO
Prepared by Ben Albright President & CEO
Source: © A.M. Best Company — Used by Permission
You are being provided this 2025 Louisiana Annual P&C Marketplace Summary covering the Louisiana property and casualty (P&C) insurance marketplace as a benefit of your membership in the Independent Insurance Agents & Brokers of Louisiana.
What follows is a graphic and numeric presentation of the Louisiana P&C industry data from an independent insurance agent’s perspective (independent agent). The 2024 data used is the most recent available from A.M. Best Company (June 1, 2025) and includes all 50 states and the District of Columbia (equaling the 51 entities referred to in the data in this report). The 2025 United States Annual P&C Marketplace Summary will be available to you as members of the Independent Insurance Agents & Brokers of Louisiana at www.independentagent.com
This Summary focuses on direct premiums, direct losses, and associated underwriting results before reinsurance. It includes Direct data from nearly 3,000 U.S.-domiciled insurers, highlighting those that have written premiums in Louisiana. Direct data is the insurer data that most closely demonstrates what is happening in the P&C marketplace. As independent agents, we operate within this marketplace—competing for, explaining, and placing P&C insurance across the state.
This 2025 Louisiana Annual P&C Marketplace Summary provides you with data and insights on the following important aspects of the Louisiana P&C marketplace:
Premiums for all 32 P&C Lines of Business
The Top 10 Lines of Business for Independent Agents
Loss and Combined Ratios
Premium Change Rates
Penetration Rate of Independent Agents
Commission Rates
Surplus Lines
Premium Taxes
Largest/Highest and Smallest/Lowest states, and U.S. Average
Line of Business In-Depth Details on the Lines of Business focused on by Independent Agents
To enhance your understanding, this Summary includes five Appendices: Distribution Style Classification, NAIC Line of Business Definitions, Lines of Business—Visual Reference and Abbreviations of Key Terms, a Louisiana All Active Insurers List, and Louisiana Fastest Growing Insurers. This last appendix is new and allows you to see premium growth for the fastest growing insurers.
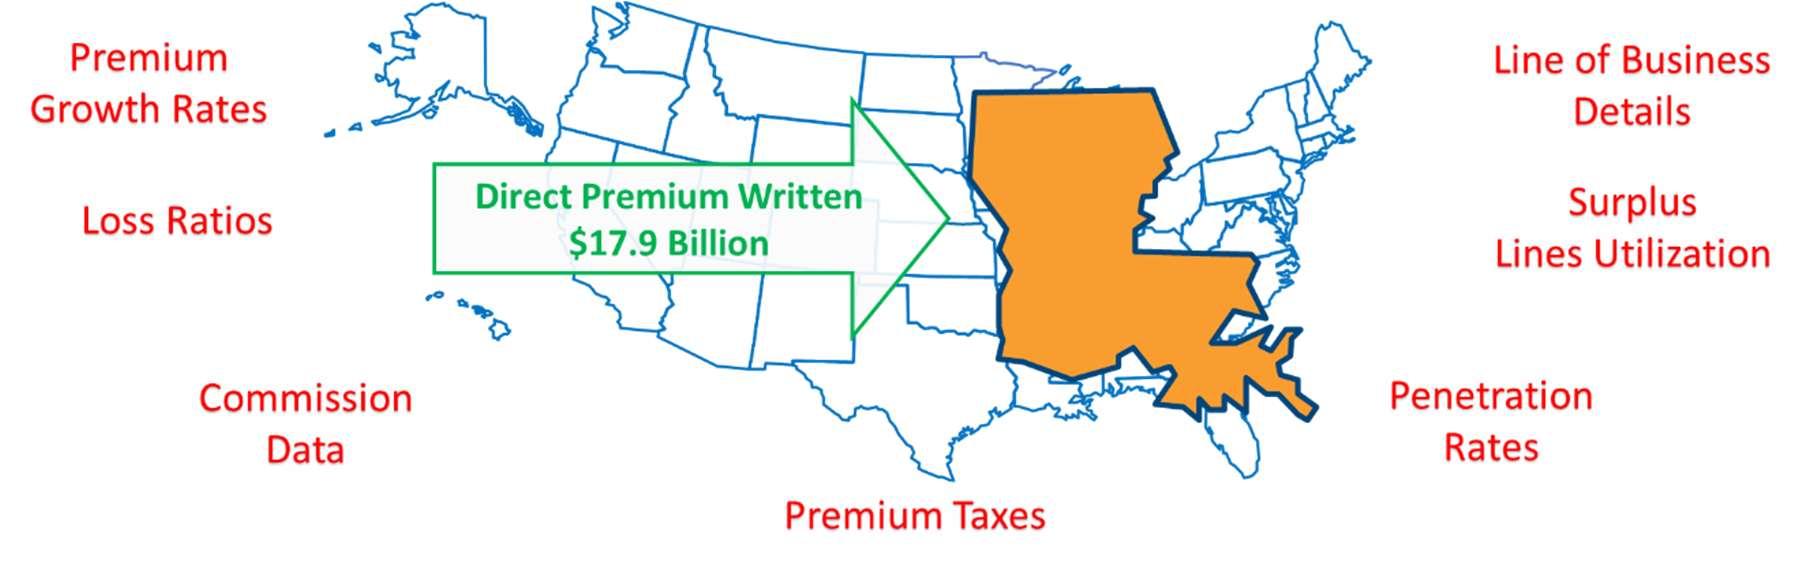
In 2024, Louisiana property and casualty (P&C) Direct Premium Written reached $17.9 billion, ranking Louisiana 20 of 51 states for total premiums in the United States. That is 1.7% out of $1.04 trillion in premiums nationwide. On a per capita basis, Louisiana ranks 7 of 51 for all P&C premiums combined, 3 of 51 for Personal Lines, 17 of 51 for Commercial Lines, and 26 of 51 for Agricultural Lines.
In Louisiana in 2024, the largest Line of Business for independent agents was Homeowners Multi-Peril, as determined by Direct Premium Written (DPW). The second largest Line of Business in Louisiana was All Private Passenger Auto, and the third was Allied Perils Only. For comparison, nationwide in 2024 those Top 3 Lines of Business were: All Private Passenger Auto, Homeowners Multi-Peril, and Other Liability (Occurrence).
In 2024 the Louisiana average Loss Ratio across all P&C Lines of Business was 51.4%, with the highest Loss Ratios occurring in Private Crop (168.2%), Multi-Peril Crop (165.3%), and Aircraft (all perils) (133.3%). Nationwide in 2024 the average Loss Ratio was 62.3%, with the highest state-wide average Loss Ratio being 82.2% (Nebraska), and the lowest being 47.5% (Hawaii). Across the United States, the Lines of Business with the highest Loss Ratios are Federal Flood (237.8%), Private Crop (93.0%), and Multi-Peril Crop (85.9%).
From 2023 to 2024 premiums changed in Louisiana by +6.1% for all P&C Lines of Business combined, placing it 48 of 51 in the United States and District of Columbia. The fastest-growing Lines of Business in Louisiana were Ocean Marine (+12.4%), All Commercial Auto (+9.4%), and All Private Passenger Auto (+9.4%). Nationally, P&C premium change averaged +9.6%, with the fastest growing percentage being + 15.2% (Washington), and the slowest being + 0.2% (North Dakota). The fastest-growing Lines of Business across the U.S. were Homeowners Multi-Peril (+13.4%), Farmowners Multi-Peril (+13.0%), and All Private Passenger Auto (+12.9%).
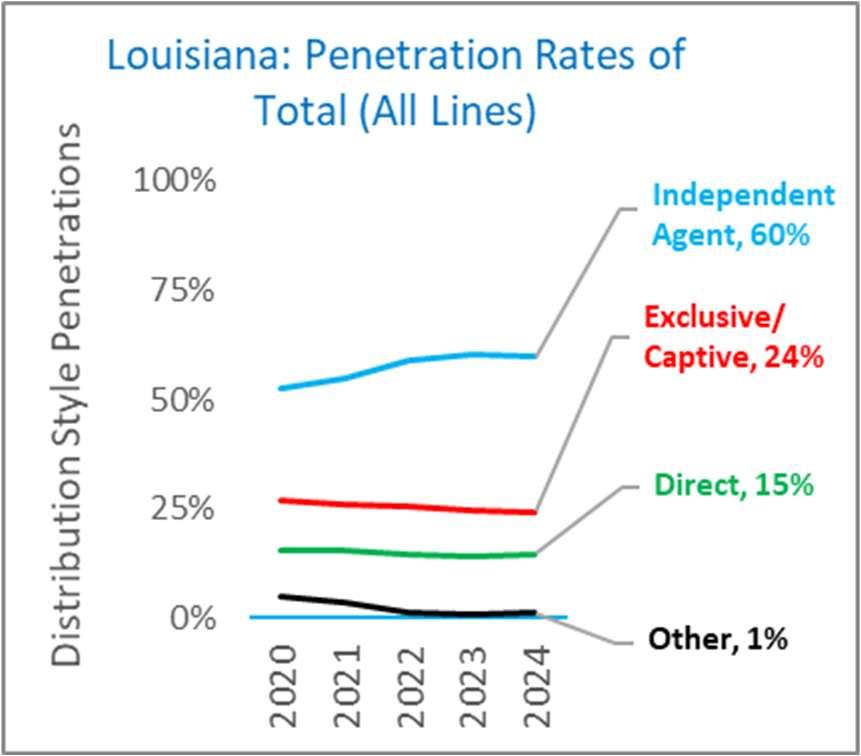
During 2024, independent agents controlled 59.9% of the Louisiana P&C marketplace. This compares to the United States average of 61.5%, with the highest Penetration Rate being 78.8% (Massachusetts), and the lowest being 51.4% (Alaska). In Louisiana, the top Penetration Rates by Lines of Business were: International (100.0%), Aircraft (all perils) (99.0%), and Products Liability (96.8%). In the United States, top penetration rates by Lines of Business were: International (100.0%), Multi-Peril Crop (96.9%), and Private Crop (96.4%).
The average Commission Rate in Louisiana in 2024 was 11.7% for all P&C Lines of Business combined. By contrast, the average Commission Rate in the United States was 11.5%. The highest average Commission Rate was 13.6% (Massachusetts), and the lowest was 10.1% (Delaware).
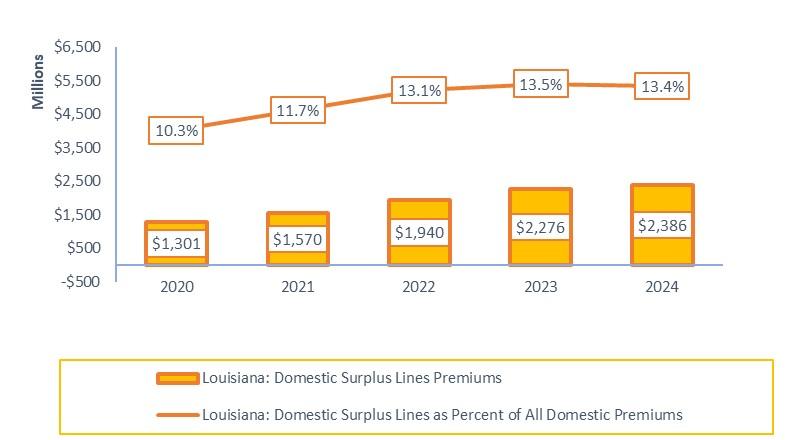
The percentage of P&C insurance premiums going to Surplus Lines is on the rise across all states. In Louisiana in 2024, the percentage of premiums going to Surplus Lines Domestic insurers was 13.4%. That percentage was 13.5% in 2023, and 10.3% in 2020. In the United States the corresponding figures were 9.7%, 9.4%, and 7.0%, respectively. In Louisiana, the top 3 Lines of Business with premiums going to Surplus Lines insurers were: Other Liability (Occurrence), Allied Perils Only, and Fire Peril Only. In United States, the top 3 Lines of Business with premiums going to Surplus Lines insurers were: Other Liability (Occurrence), Other Liability (Claims-made), and Fire Peril Only.
All U.S. states levy a tax on property and casualty (P&C) insurance premiums, commonly referred to as a premium tax. In Louisiana in 2024, the average tax rate for Admitted premiums was 3.7%, while the Surplus Lines predominant tax rate was 4.9%. Together these taxes generated $711 million for Louisiana in 2024, accounting for approximately 5.8% of Louisiana's total tax and fee revenue, or about $154.7 per capita. Nationally, the average premium tax rates are 2.1% for Admitted premiums, and 3.9% for Surplus Lines premiums. In 2024 that equates to $25 billion in premium taxes nationwide, or about 2.0% of all state tax and fee revenue.
In 2024 State Farm Group (G) was the largest insurer group overall in Louisiana, writing 15.5% of all P&C premiums. Progressive Security Insurance Company emerged as the largest Pure Independent AgentBroker Distribution Style individual insurer, State Farm Mutual Automobile Ins Co as the largest Exclusive-Captive Distribution Style individual insurer, and Progressive Paloverde Insurance Company as the largest Direct Distribution Style individual insurer.
Figure 1 below, 2024 Louisiana Direct Premium Written: By Line of Business, lists the Line of Business and then shows the 2024 total Direct Premium Written (DPW) for all 32 P&C Lines of Business that P&C insurers are required to report on in their annual statement to regulators. The Lines of Business are listed in alphabetical order, both below and in most of the subsequent tables and figures in this Summary. Of the 32 lines, 26 Lines of Business are primarily focused on by independent agents and are emphasized below with an asterisk (*). As independent agents are the target audience, those 26 Lines of Business are generally emphasized throughout the remainder of this Summary.
2024—Louisiana Direct Premiums Written: By Line of Business
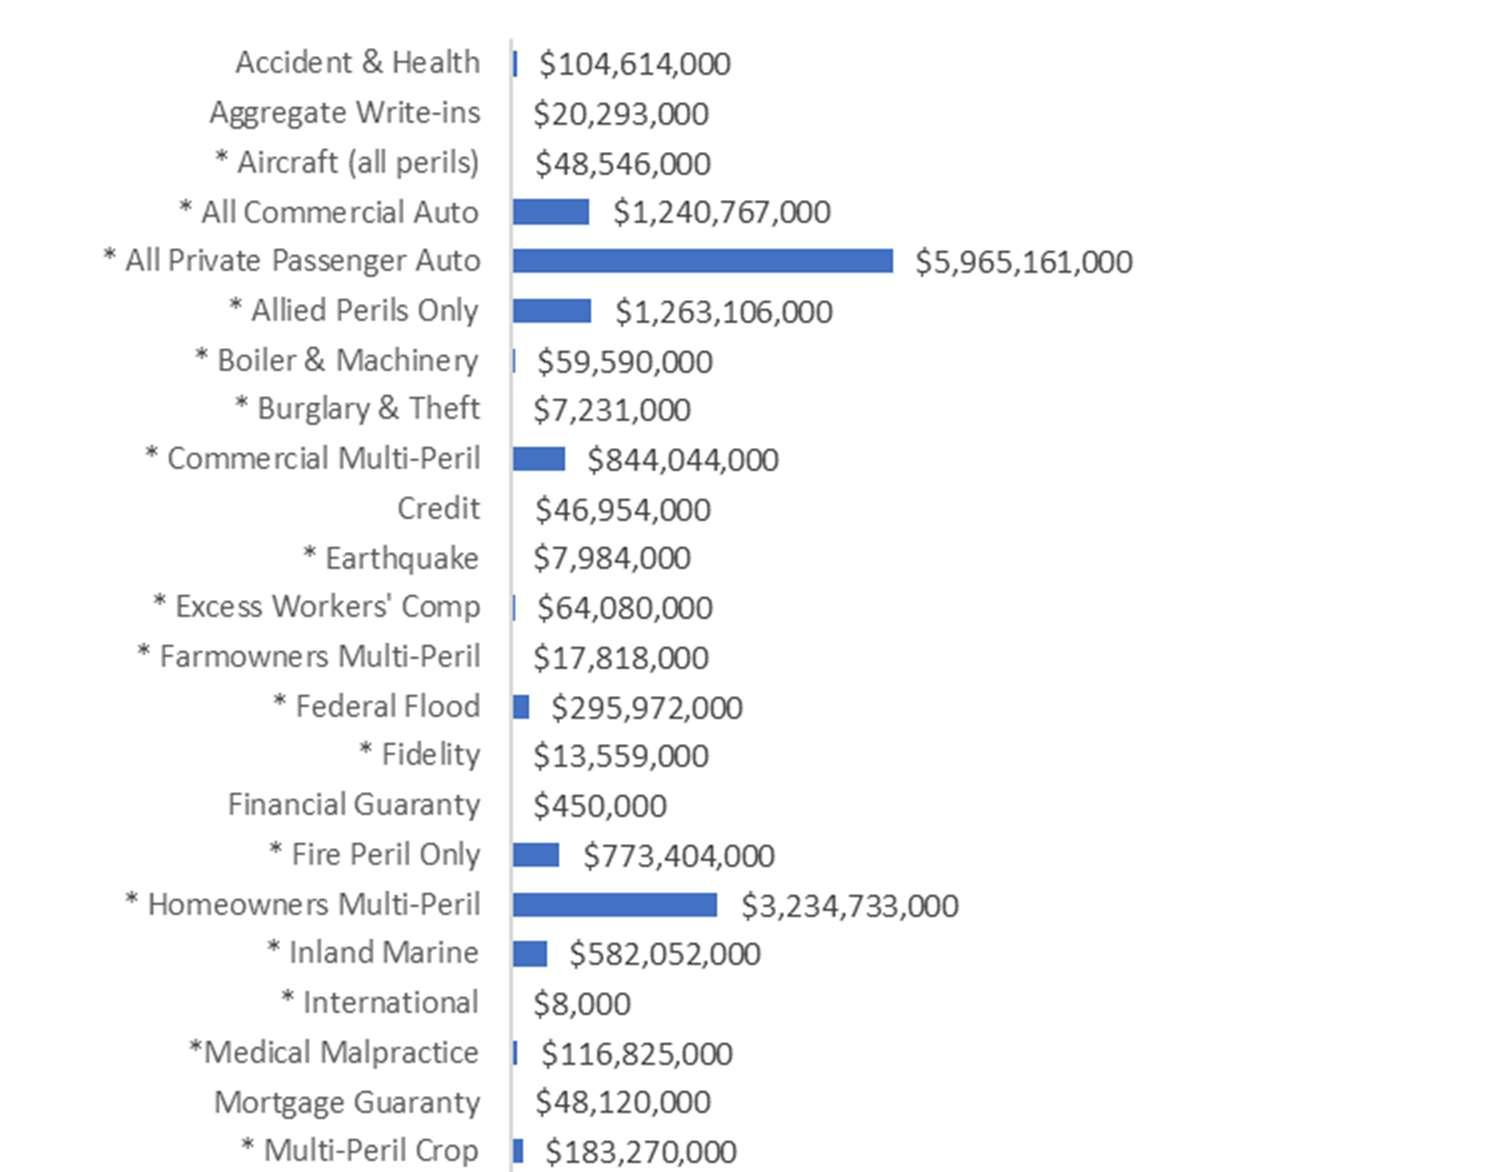
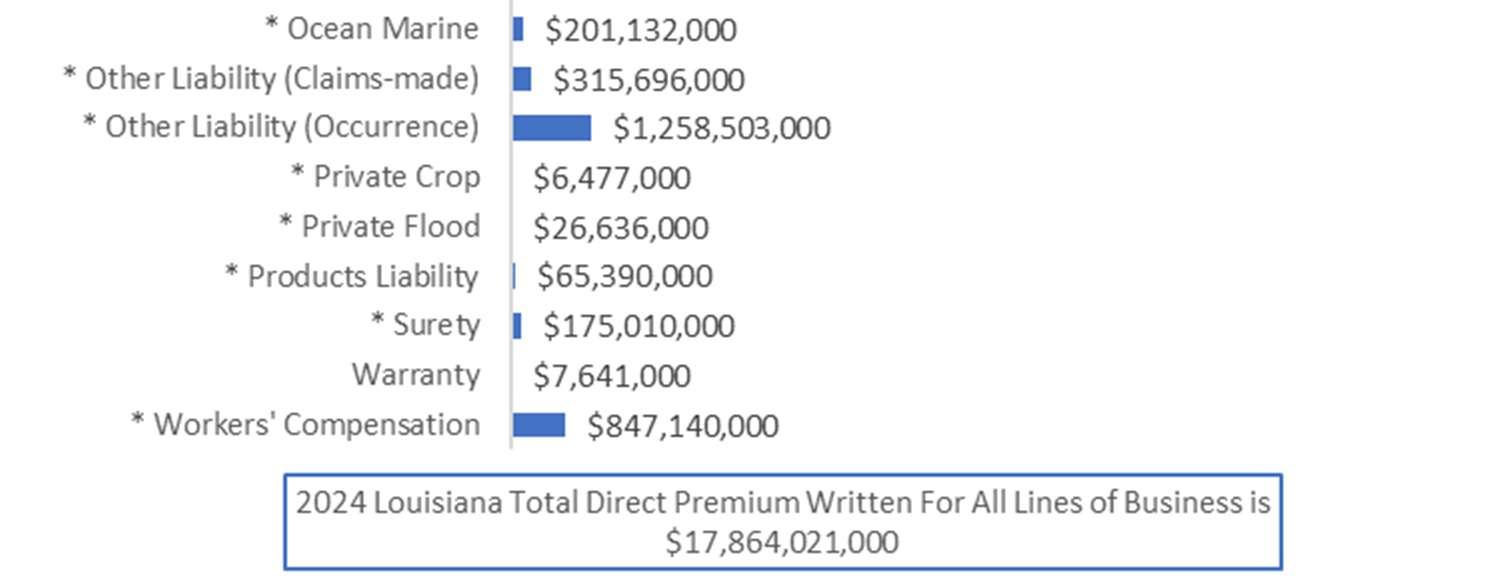
Figure 1 | Source: © A.M. Best Company — used by permission. Note: independent agent-focused Lines of Business are designated by an asterisk (*).
Table 1 below, 2024 Louisiana: All Lines of Business Additional Details, elaborates on the data in the previous Figure 1, with expanded detail on Louisiana Premiums, Loss Ratios, Premium Change Rates, and Penetration Rates for the 32 P&C Lines of Business. The data is provided by Line of Business, for the reader’s overall reference. Again, the 26 Lines of Business primarily focused on by independent agents, are emphasized with an asterisk (*). The 1-Year Loss Ratio and Premium Change rates are for 2024. The 5-Year Loss Ratio and Premium Changes rates are for the years 2020 to 2024.
Table 1 | Source: © A.M. Best Company — used by permission. Note: independent agent-focused Lines of Business are highlighted with an asterisk (*)
Table 2 below, 2024 Total and Per Capita Premiums: Louisiana and U.S., Louisiana and United States P&C premiums are shown in total, and on a per capita basis. Per capita premiums are provided to give a relative sense of the cost of premiums, but also allows for comparing premiums state to state. For deeper insight, per capita premiums are provided for the following four Line of Business groupings:
Total (All Lines of Business Combined) includes premiums for all 32 P&C Lines of Business.
Personal Lines includes All Private Passenger Auto, and Homeowners Multi-Peril.
Commercial Lines includes All Commercial Auto, Commercial Multi-Peril, Other Liability (ClaimsMade), Other Liability (Occurrence), Products Liability, and Workers’ Compensation.
Ag-Farm Lines include Farmowners Multi-Peril, Multi-Peril Crop, and Private Crop.
In Table 2, also provided are the largest/highest state and the smallest/lowest state for total premiums and per capita premiums.
Note: The most recent population estimate from the United Census Bureau is the basis for the per capita comparative premium figures.
Line of Business Groupings Louisiana (Rank) United States (Average State)
Total (All Lines) Premiums
Total (All Lines) Per Capita Premium
Personal Lines Per Capita Premium
Commercial Lines Per Capita Premium
Ag-Farm Lines Per Capita Premium
$17.9 billion (Rank is 20 of 51)
$1,044,766,804,000 ($1.04 trillion) California ($125.0 billion) Vermont ($1.8 billion)
$3,885 (Rank is 7 of 51) $3,072 North Dakota ($4,809) Ohio ($2,143)
$2001 (Rank is 3 of 51)
$1,563 Florida ($2,230)
District of Columbia ($1,022)
$994 (Rank is 17 of 51) $943 District of Columbia ($1,786) Ohio ($585)
$45 (Rank is 26 of 51) $73 North Dakota ($1,973)
District of Columbia ($0)
Table 2 | Source: © A.M. Best Company — used by permission, and United States Census Bureau, Population Division and Annual Estimates of Resident Population (Release Date: December 2024)
The below Figures 2–5 show the Top 10 Lines of Business written by independent agents in Louisiana and the United States. This is based on Direct Premium Written (DPW) for each Line of Business. Premiums for Lines of Business that fall below the Top 10 are combined in the “All Other Line of Business (LOBs)” pie chart section. Each section of Figures 2 and 4 includes only premiums distributed through independent agents. Each section of Figures 3 and 5 includes premiums from all insurer Distribution Styles.
For information on the classification of insurers into Distribution Styles based on A.M. Best’s reported Marketing Types, see Appendix #1: Distribution Style Classification. Also included in Appendix #1 is additional data on premiums by Line of Business for each Distribution Style, as well as the Top 10 insurers for each Distribution Style.
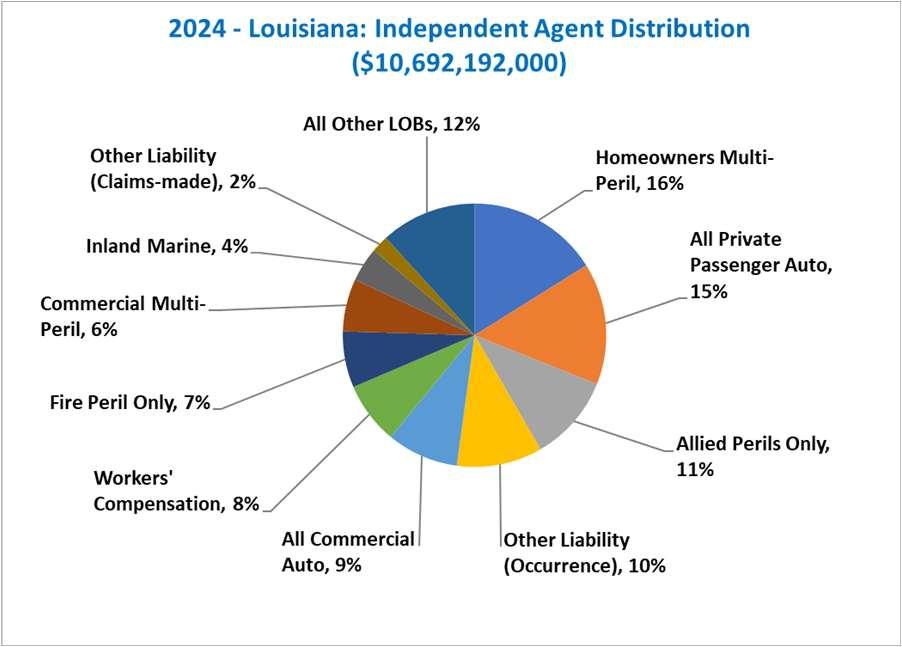
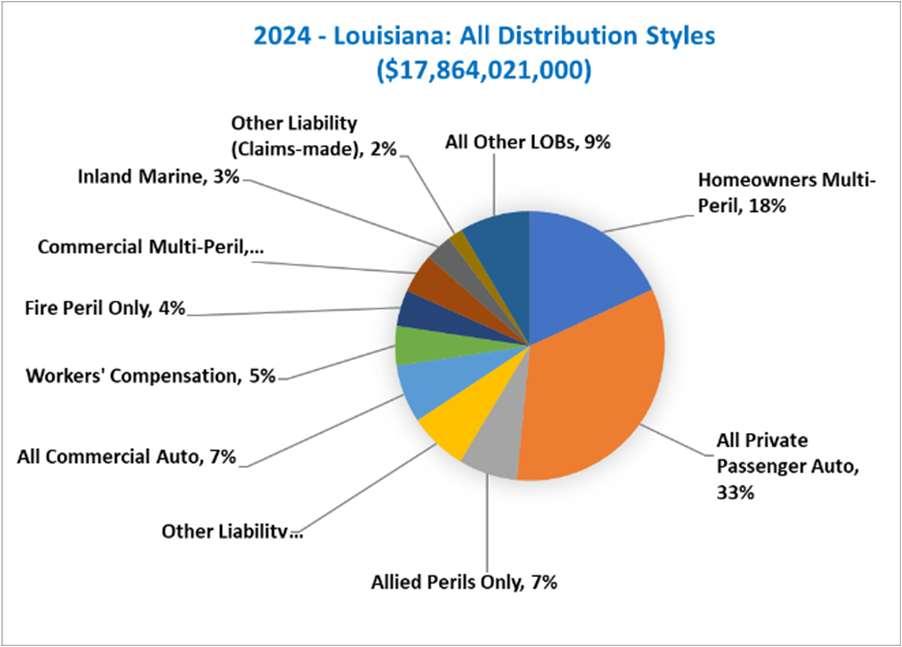
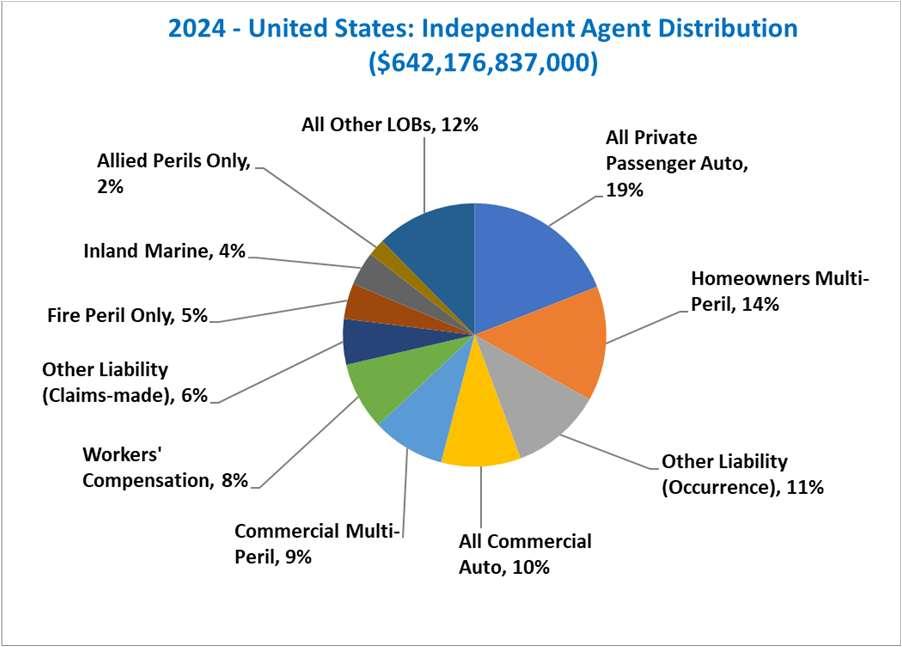
Figure 4
Source: © A.M. Best Company — used by permission.
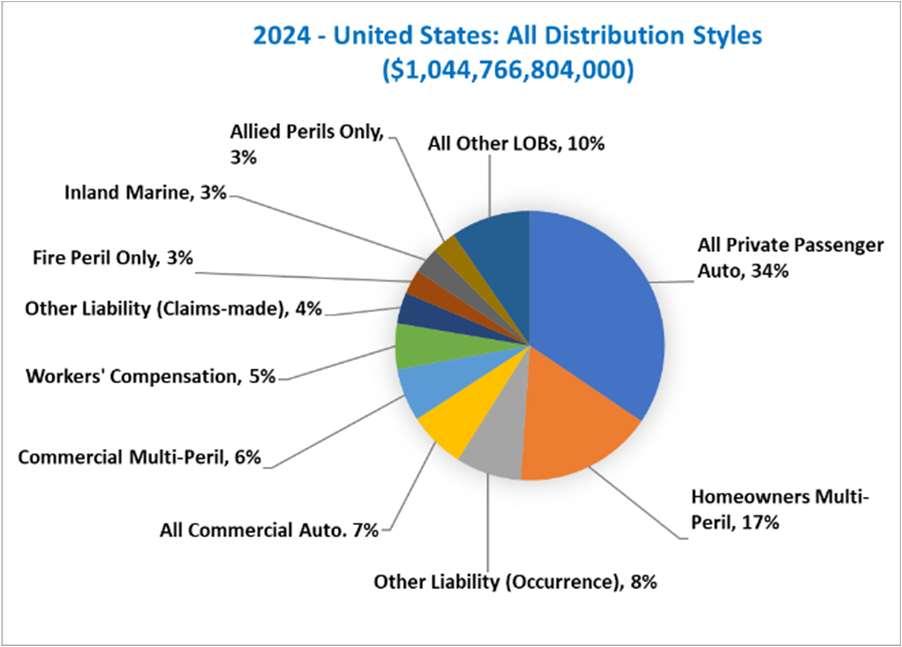
Figure 5
Table 3 below, 2024 Top 10 Lines of Business Premium Rankings, compares annual premium rankings for all 32 P&C Lines of Business (LOB). Shown under the column heading “Louisiana LOB Ranking” are the Top 10 Lines of Business in terms of premiums for Louisiana in 2024. Shown under the column heading “United States LOB Ranking” are the Top 10 Lines of Business in terms of premiums nationwide in 2024.
The column heading “Percent of Time #1 LOB (All States),” shows the percentage of time that Line of Business is ranked #1 in 2024. Specifically, Private Passenger Auto was the #1 Line of Business in 69% of all states, meaning it was #1 in 35 of the 51 states and District of Columbia.
The last column, “Percent of Time in Top 10 LOB (All States),” shows the frequency of each Line of Business in any state’s Top 10 Lines of Business. For example, Private Passenger Auto, Commercial Multi-Peril, Homeowners Multi-Peril, and Other Liability (Occurrence) were in every state’s Top 10 Lines of Business (100%), but Aircraft and Warranty were in the Top 10 only in two states (2%), and so on.
Table 3 | Source: © A.M. Best Company — used by permission.
Figure 6 below is a bar chart, 2024 Louisiana 1-Year and 5-Year Loss Ratios by Line of Business, illustrating Loss Ratios for the 26 P&C Lines of Business focused on by independent agents, with the final 2 bars labeled Total (All Lines) representing all 32 Lines of Business. The 26 Lines of Business were highlighted earlier in this Summary and were noted with an asterisk (*). The 1-Year Loss Ratio is for 2024. The 5-Year Loss Ratio is the average over the years 2020 to 2024.
Following Figure 6 is Equation 1 which shows how Loss Ratios are calculated.
Note: International is not shown as there is less than 5 years of data available.
2024 Louisiana 1-Year and 5-Year Loss Ratios by Line of Business
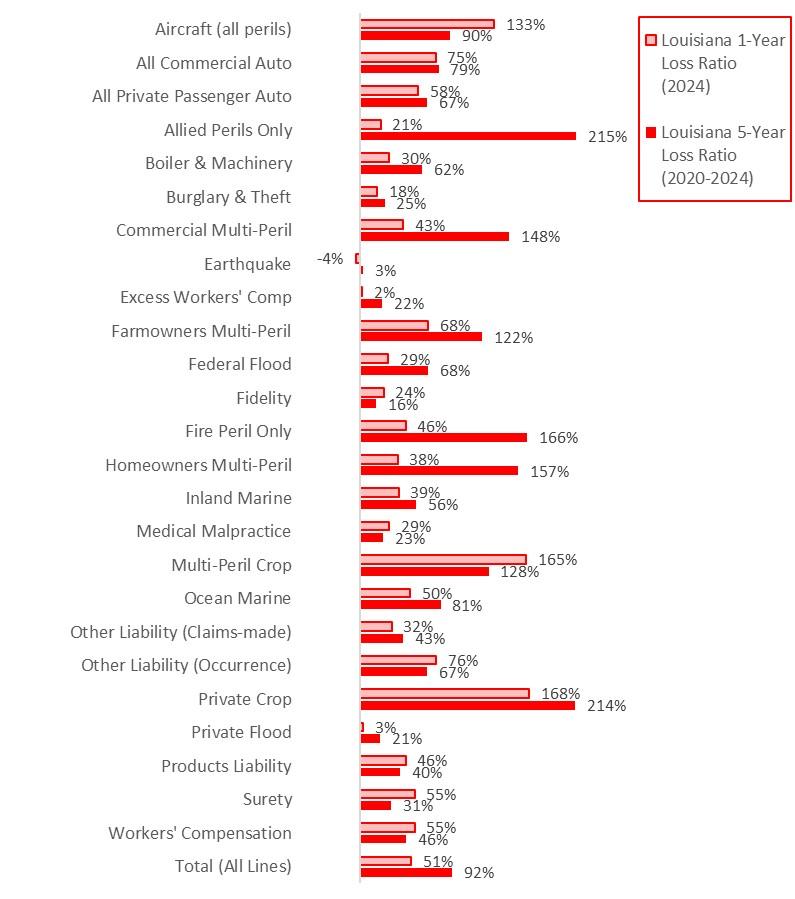
Figure 6 | Source: © A.M. Best Company — used by permission. Note: International not shown, as less than 5 years data is available.
In Equation 1 below, Loss Ratios used in this Summary are calculated as “Adjusted Calendar Year Loss Ratio.” That is, the losses used in the ratio of losses to earned premiums equals the paid losses in 2024, plus any estimates of future losses that will be paid from claims in 2024 (new reserves), plus/minus any changes in reserves from previous years made that year (prior reserves).
The "adjusted" part is if dividends are paid out, then the Loss Ratio is adjusted for that cost. Where dividends are a factor (for example, workers’ compensation), it is important to include them whenever Loss Ratios of different Lines of Business are compared.
Equation 1 | Source: A.M. Best Financial Suite (Used with Permission)
Table 4 below, 2024 Lines of Business Loss Ratios, compares the 1-year and 5-year average Loss Ratios in Louisiana, and then the United States, broken down by Line of Business and for all lines combined. Table 4 also highlights the range of Loss Ratios across the 50 states and District of Columbia.
Again, the Lines of Business are those 26 Lines of Business focused on by independent agents. Individual state Loss Ratios can and do vary considerably, especially in situations where there are low premiums in a state or an individual Line of Business. Also, negative Loss Ratios are possible if prior year claim reserve reductions exceed 2024 paid losses and 2024 loss reserves.
Note: The International Line of Business is not shown below, as there are less than 5 years data available.
Table 4 | Source: © A.M. Best Company — used by permission.
Figure 7, 2024 Louisiana 1-Year and 5-Year Direct Premium Written Changes, shows the percentage change in Direct Premium Written for the 26 different P&C Lines of Business focused on by independent agents. The final two bars labeled Total (All Lines) is the trend for all 32 Lines of Business. The 1-Year change rate is the percentage change in premiums from 2023 to 2024. The 5-Year change rate is the percentage that results when the premiums for 2020 equals the premiums for 2024, when a constant percentage is applied annually. This is a compound annual premium change rate.
Note: The International Line of Business is not shown below, as there are less than 5 years data available.
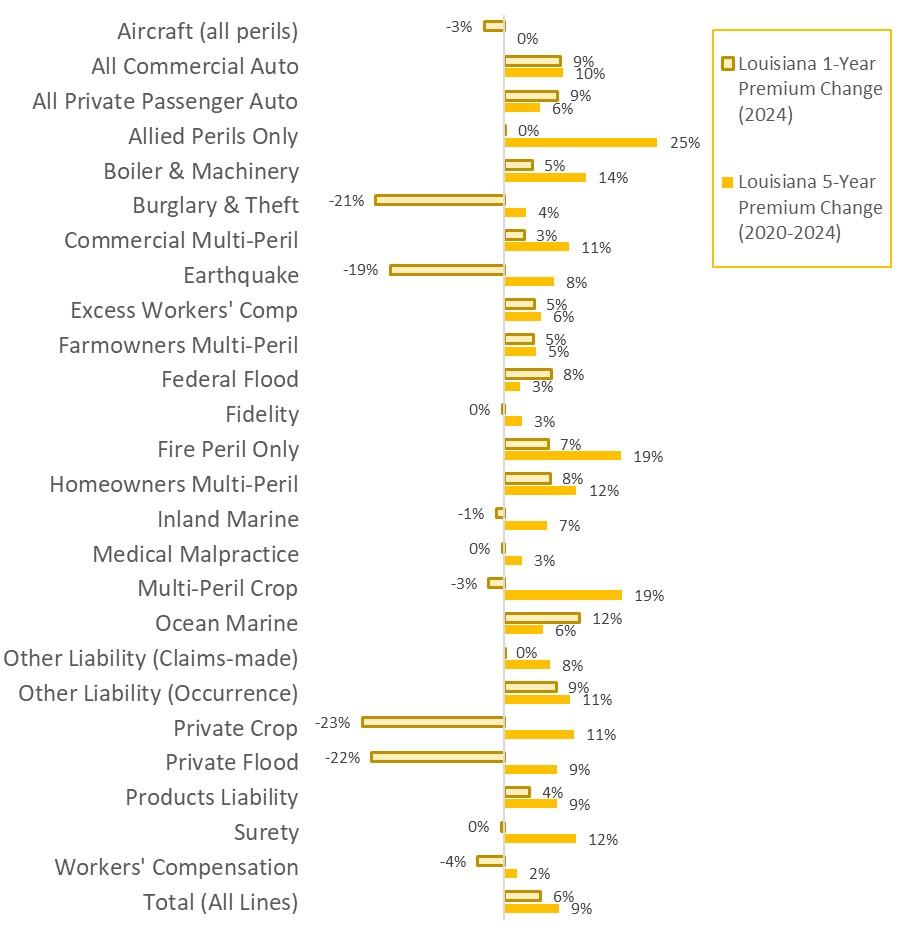
Figure 7 | Source: © A.M. Best Company — used by permission. Note: International not shown, as less than 5 years data is available.
Table 5, 2024 Line of Business Direct Premium Written Change compares the 1-year and 5-year average Direct Premium Written (DPW) change in Louisiana to premiums changes for the United States, and to the states with the highest and the lowest premium change.
The 1-Year change rate is the percentage change in premiums from 2023 to 2024. The 5-Year change rate is the percentage that results when the premiums for 2020 equal the premiums for 2024, when a constant percentage is applied annually. This is a compound annual premium change rate.
Note: The International Line of Business is not shown below, as there are less than 5 years data available.
Virginia)
Boiler & Machinery + 4.6% | + 13.5% + 4.2% | + 9.6% + 26.8% (Alaska) – 18.5% (West Virginia) Burglary & Theft – 21.2% | + 3.7% + 8.0% | + 9.0% + 95.0% (Arkansas) – 21.2% (Louisiana) Commercial Multi-Peril + 3.4% | + 10.6% + 7.6% | + 9.7% + 17.4% (Hawaii) – 2.4% (Alaska) Earthquake – 18.7% | + 8.2% + 3.2% | + 10.2% + 64.6% (Vermont) – 71.2% (West Virginia)
Excess Workers' Comp + 5.0% | + 6.1% + 2.2% | + 3.9% + 85.7% (North Dakota) – 140.6% (Wyoming) Farmowners Multi-Peril + 4.8% | + 5.3% + 13.0% | + 8.9% + 33.9% (Mississippi) – 2.0% (Florida) Federal Flood + 7.8% | + 2.6% + 9.1% | + 3.0% + 85.0% (Minnesota) – 51.1% (Utah) Fidelity – 0.3% | + 2.9% – 1.3% | + 2.6% + 29.5% (Vermont) – 13.9% (South Dakota) Fire Peril Only + 7.3% | + 19.3% + 12.8% | + 18.3% + 28.2% (California) – 40.0% (Nebraska)
Homeowners Multi-Peril + 7.6% | + 11.9% + 13.4% | + 11.9% + 22.5% (Idaho) + 6.9% (Florida)
Inland Marine – 1.3% | + 7.0% – 4.9% | + 7.6% + 19.4% (Delaware) – 21.4% (Massachusetts)
Medical Malpractice – 0.3% | + 2.9% + 5.5% | + 6.3% + 20.3% (Vermont) – 3.0% (Delaware)
Multi-Peril Crop – 2.6% | + 19.4% – 9.6% | + 12.7% + 25.4% (Arizona) – 43.2% (New Hampshire)
Ocean Marine + 12.4% | + 6.4% + 1.5% | + 9.4% + 865.5% (Nebraska) – 39.4% (Maryland)
Other Liability (Claims-made) + 0.0% | + 7.6% – 0.0% | + 6.2% + 29.8% (North Dakota) – 21.9% (Nevada)
Other Liability (Occurrence) + 8.6% | + 10.8% + 10.5% | + 11.1% + 16.9% (South Carolina) – 7.6% (Delaware)
Private Crop – 23.3% | + 11.5% – 3.7% | + 7.3% + 42.8% (Maryland) – 100.0% (Connecticut)
Private Flood – 21.8% | + 8.8% – 10.1% | + 15.8% + 22.2% (South Carolina) – 39.5% (North Dakota)
Products Liability + 4.2% | + 8.8% + 5.2% | + 7.1% + 48.2% (Kansas) – 5.6% (Oregon)
Surety – 0.4% | + 11.8% + 12.2% | + 11.3% + 50.1% (Idaho) – 4.2% (Montana)
Workers' Compensation – 4.3% | + 2.2% – 1.7% | + 3.1% + 7.7% (Wyoming) – 33.9% (Washington)
Table 5 | Source: © A.M. Best Company — used by permission. Note: International not shown, as less than 5 years data is available.
The clustered bar chart in Figure 8 below, Louisiana Top 10 Lines of Business and 5-Years of Penetration Rates, shows 5 years of Penetration Rates, for each year 2020 through 2024, for the Top 10 Lines of Business written through independent agents in Louisiana. The clustered bars are organized by the rank-order of premiums for each Line of Business. The final cluster of bars labeled Total (All Lines) is for all 32 Lines of Business.
Note: After Figure 8 is Equation 2, which provides the calculation of the “Independent Agent Penetration Rate.” All premium data is Direct data.
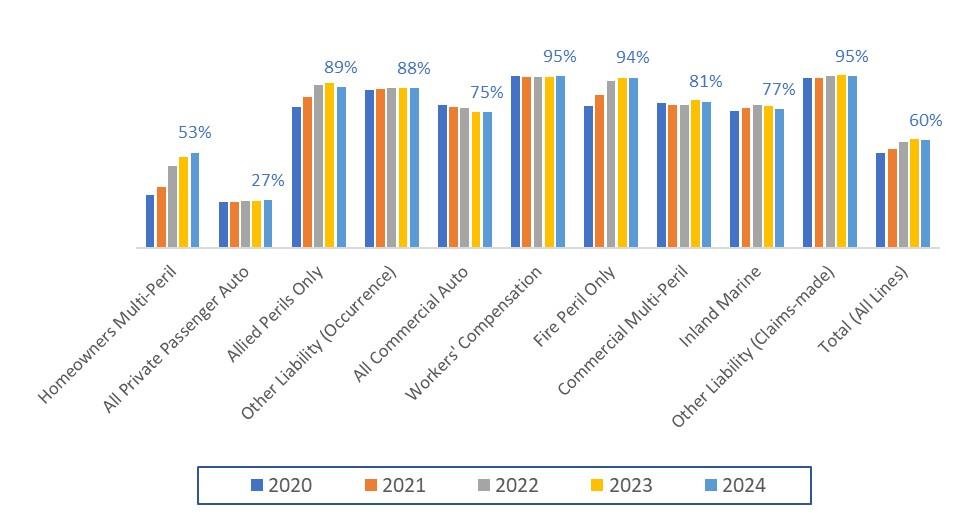
Figure 8 | Source: © A.M. Best Company — used by permission.
In Equation 2 below the Independent Agent Penetration Rate is shown to be calculated based on premiums of insurers who generally use independent agents, either directly via Pure IA/Broker, or via the MGA/Wholesale, or IA-Mixed Distribution Styles. This equation applies whether calculating the Independent Agent Penetration Rate for a Line of Business, or Total (All Lines).
For explanations of Pure IA/Broker, MGA/Wholesale, and IA-Mixed, and all other Distribution Styles, see Appendix #1: Distribution Style Classification which gives the classification of insurers into Distribution Styles based on insurer reported Marketing Types.
Equation 2 |Source: Real Insurance Solutions Consulting
Table 6, 2024 Independent Agent Line of Business Penetration Rates, shows the 1-year and 5-year average Independent Agent Penetration rates for Louisiana as compared to the United States, and to the states with the highest and the lowest penetration rates.
The 1-Year Penetration Rate is for 2024. The 5-Year Penetration Rate is the average for the years 2020 through 2024. The first row labeled Total (All Lines) is the Penetration Rate for all 32 Lines of Business. The remaining rows are the 26 P&C Lines of Business focused on by independent agents.
Note: The International Line of Business is not shown below, as there are less than 5 years data available.
Table 6 | Source: © A.M. Best Company — used by permission. Note: International not shown, as less than 5 years data is available.
Figures 9-12 are 5-Year Louisiana Penetration Rate trends shown for the previously presented four groupings of: Total (All Lines), Commercial Lines, Personal Lines, and Ag-Farm Related. For further insight into the below classifications of: Independent Agent, Exclusive/Captive, Direct, and Other, see Appendix #1: Distribution Style Classification. In addition, Appendix #5: Louisiana Fastest Growing Insurers provides deeper insight into shifts in penetration, with its delineation of the insurers with the most premium growth, each insurer’s largest Lines of Business, and the insurer’s listed Marketing Type.
Total(AllLines)20202021202220232024
IndependentAgent52.4%54.7%58.9%60.2%59.9%
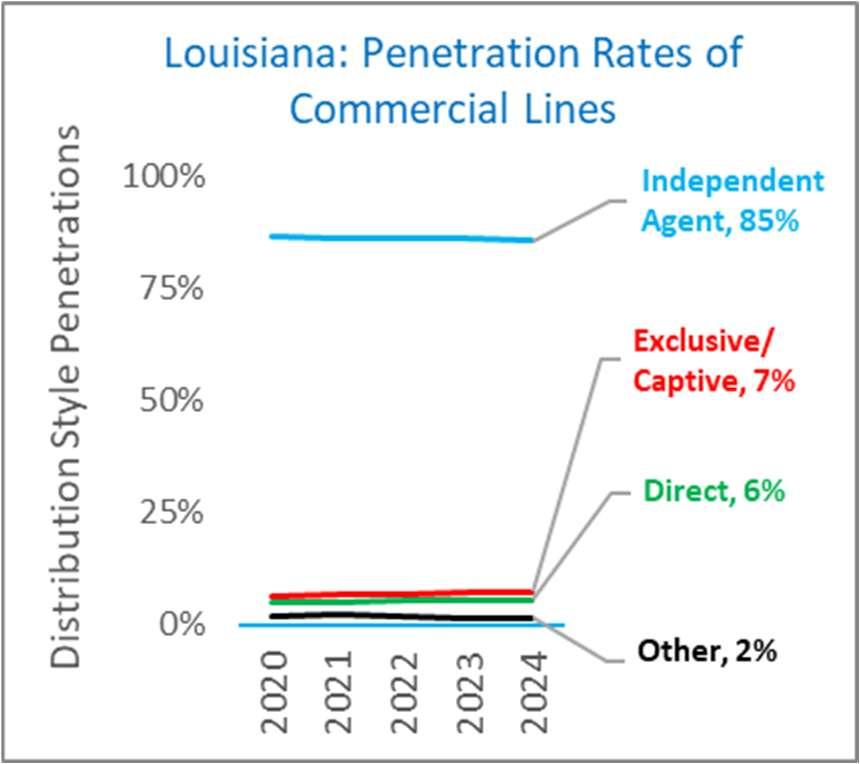
CommercialLines20202021202220232024
IndependentAgent86.5%86.0%86.0%85.9%85.3%
Figure 9
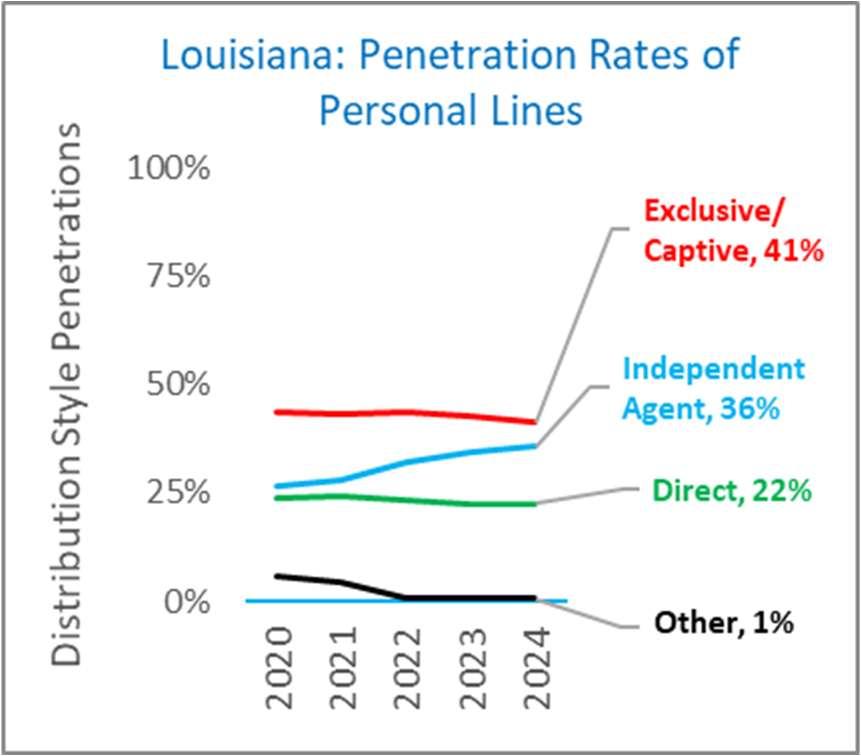
PersonalLines20202021202220232024
IndependentAgent26.4%28.0%32.2%34.5%35.7%
Exclusive/Capve43.9%43.4%43.8%42.6%41.2% Direct23.8%24.2%23.2%22.2%22.5%
Figure 11
Source: © A.M. Best Company — used by permission.
Figure 10
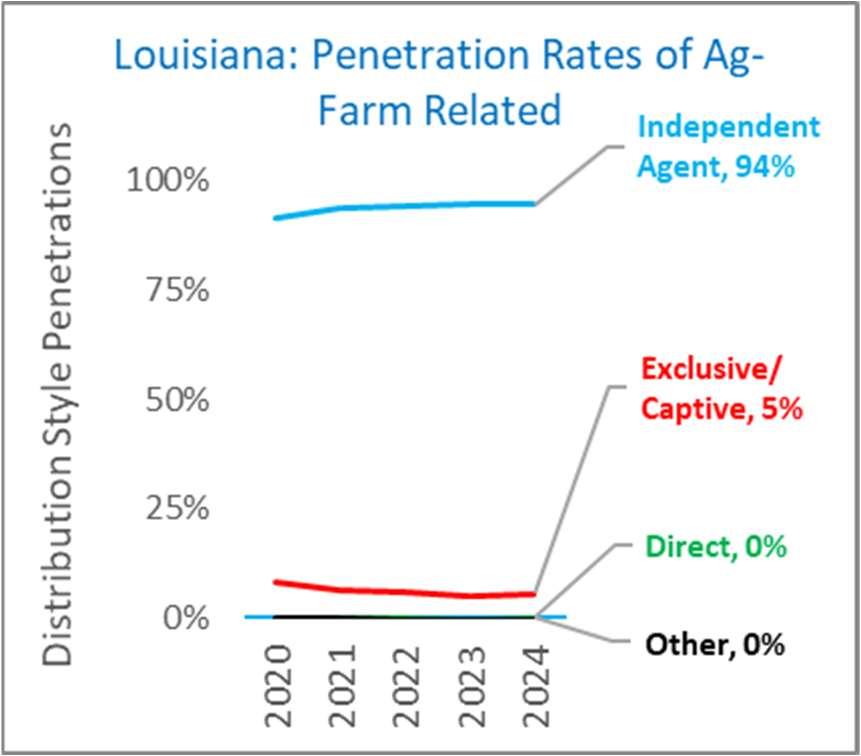
Ag-FarmRelated20202021202220232024
IndependentAgent91.6%93.5%94.1%94.9%94.5% Exclusive/Capve8.3%6.5%5.9%5.1%5.5%
Direct0.0%0.0%0.0%0.0%0.0%
Other0.1%0.0%0.0%0.0%0.0%
Figure 12
Figure 13, 2024 Louisiana 1-Year and 5-Year Commission Rates, shows the Commission Rates paid by all insurers for the 26 different independent agent-focused P&C Lines of Business. The final two bars labeled Total (All Lines) is the Commission Rate for all 32 Lines of Business. The 1-Year Commission Rate is for 2024. The 5-Year Commission Rate is the average for the years 2020 through 2024. After Figure 13 the calculation of Commission Rate is provided in Equation 3.
Note: The International Line of Business is not shown as there are less than 5 years data available.
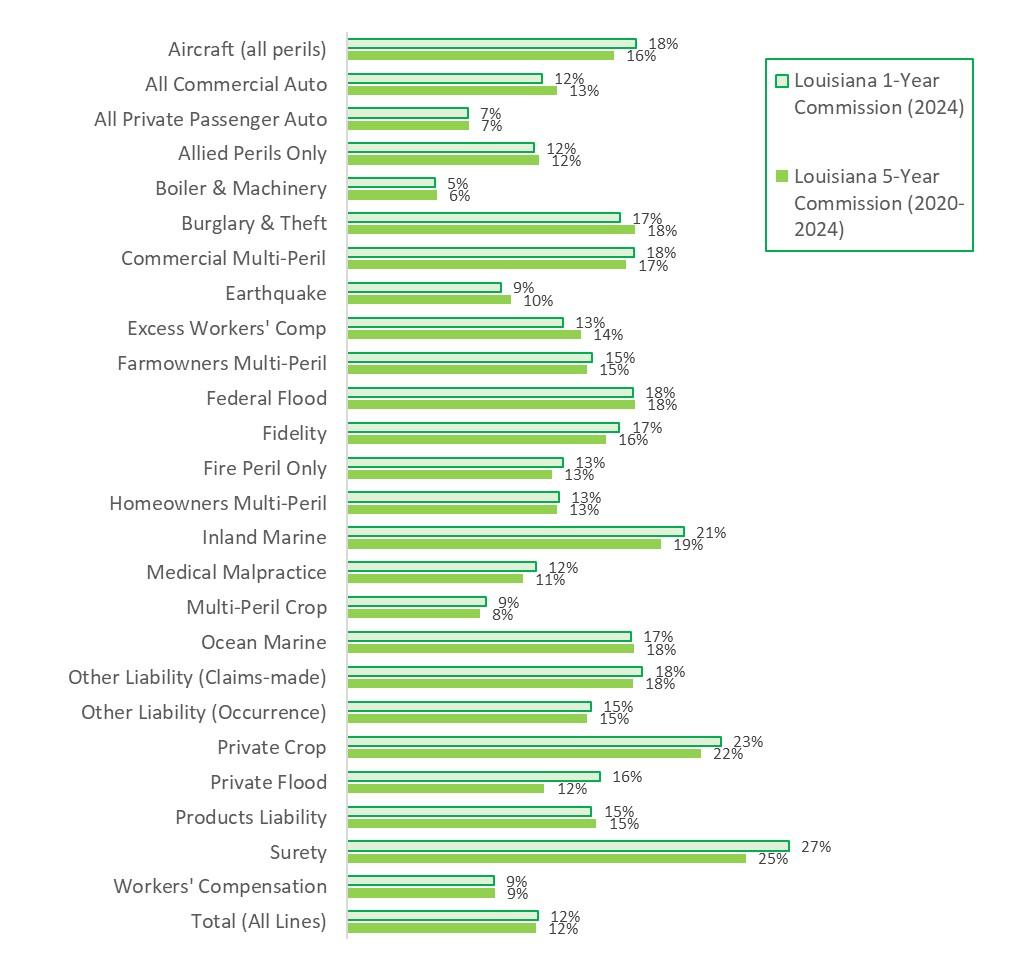
Figure 13 | Source: © A.M. Best Company — used by permission. Note: International not shown, as less than 5 years data is available.
Equation 3 below shows how Commission Rates are calculated, where the commission equals the Line of Business standard commission (“upfront” or initial payment) and any contingent commission (“residual” or performance-based payment), divided by the Line of Business Direct Written Premium.
Equation 3 | Source: National Association of Insurance Commissioners: Annual Statement Instructions Property/Casualty
Table 7 below, 2024 Line of Business Commission Rates, shows the 1-year Commission Rate, and 5-year average Commission Rates for Louisiana, as compared to the United States, and to the states with the highest and the lowest commission rates. The 1-Year Commission Rate is for 2024. The 5-Year Commission Rate is the average for the years 2020 through 2024. Where premiums are low in a Line of Business or a state, unusual highest and/or lowest Commission Rates are possible.
Note: Also, the International Line of Business is not shown below, as there are less than 5 years data available.
Table 7 | Source: © A.M. Best Company — used by permission. Note: International not shown, as less than 5 years data is available.
Surplus Lines P&C insurance provides coverage for high-risk or unique exposures that standard insurers will not cover. The standard, or “Admitted” Insurers, are subject to state-based regulation of forms, rates, financial strength, and market conduct. Insurers that are not subject to form, rate and other state-based regulation are called Surplus Lines insurers. While Surplus Lines insurers are also frequently referred to as “non-admitted,” the label Surplus Lines is used throughout this Summary instead.
Figure 14, Louisiana 5-Years of Surplus Lines Premiums (Domestic Premiums Only), presents Surplus Lines premiums from Domestic insurers—those insurers domiciled in a U.S. state. Shown is the dollars of Surplus Lines premiums, along with the percentage that those premiums are to all Domestic premiums. For the purpose of this Summary, each Domestic insurer’s premiums are classified based on that insurer’s license status as shown in the A.M. Best database. When an insurer’s status is listed as “SL” (Surplus Lines) for Louisiana, its premiums are classified as Surplus Lines premiums in Louisiana.
Louisiana 5-Years of Surplus Lines Premiums (Domestic Premiums Only)
Recently, it was suggested that data in this Summary should account for premiums written through insurers not domiciled in the U.S.—that is, Alien insurers such as Lloyd’s of London. It was noted that not including Alien premiums may underestimate independent agent penetration overall. This is because Surplus Lines placements involve a Managing General Agent (MGA)/Wholesaler, suggesting that if Surplus Lines premiums increase, independent agent penetrations would rise correspondingly. For information on MGA/Wholesale and independent agent distribution generally, see Appendix #1: Distribution Style Classification
The challenge in accurately accounting for Alien insurer premiums is that those insurers do not file detailed financial statements with state-based regulators, as Domestic insurers must do. Nevertheless, Alien insurers are required to pay Surplus Lines taxes, and that data is tracked by the National
Association of Insurance Commissioners (NAIC). The most recently available data from NAIC is from 2023. It shows, from the tax-based data, that the proportion of every $1 of Surplus Lines premiums is $.74 from Domestic insurers, and $.26 is attributed to Alien insurers.
Applying that proportion to the Domestic Surplus Lines premium data in this Summary can provide an indication of the premiums from Alien insurers, and the approximate impact on independent agent penetrations. For example, if Domestic Surplus Lines premiums are 5%, the missing Alien insurer premiums would be proportional and approximately 1.6% (that is, .05 ÷ .74 X .26 = .0176). At 10% Domestic Surplus Lines premiums, the missing Alien insurer premiums would be approximately 3.5%. At 15%, the missing Alien insurer premiums would be approximately 5.3%.
Consideration of Alien Surplus Lines can be used to estimate an increase in premiums from Alien insurers, and a corresponding increase in independent agent penetrations. However, the NAIC Alien tax-based data lacks sufficient detail for inclusion in this Summary, beyond the proportional approximations just provided.
Figure 15, 2024 Louisiana Surplus Lines: Top 10 Lines of Business, illustrates the Top 10 Surplus Lines of Business, ranked clockwise by their respective shares of total Domestic Surplus Lines premiums in Louisiana. The box below the pie chart shows Louisiana SL premium in dollars, from Figure 14.
The method of calculating the percentage share of each Line of Business is shown in Equation 4, which follows Figure 15.
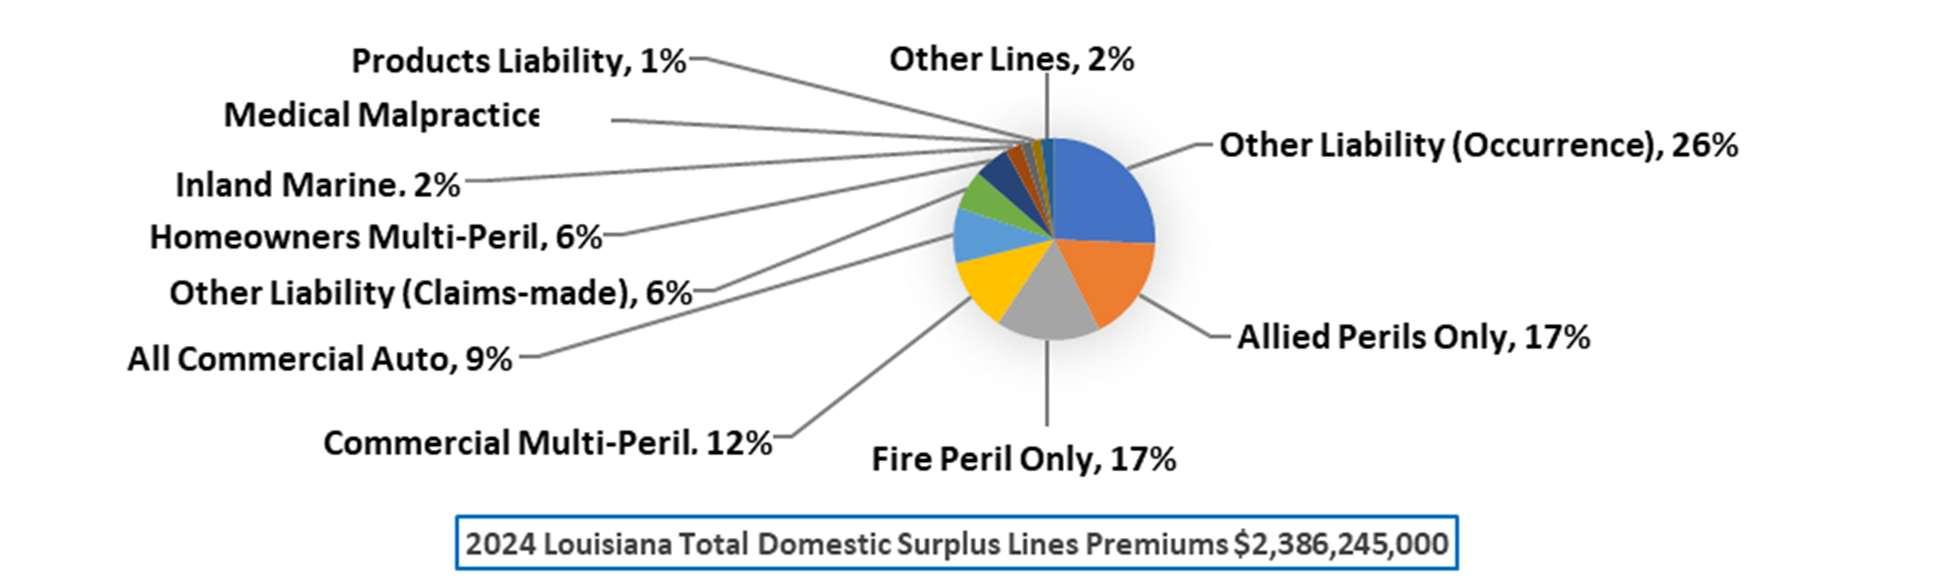
Figure 15 | Source: © A.M. Best Company — used by permission (Percentage shown is the percentage of total Louisiana Domestic Surplus Lines premiums)
Calculating the Line of Business Percentage Share of Surplus Lines
Equation 4 | Source: Real Insurance Solutions Consulting
Table 8, 2024 Surplus Lines Utilization By Line of Business, illustrates the Percentage Share of Surplus Lines Utilization within each of the 26 Lines of Business focused on by independent agents. It provides comparison data with the Louisiana 1-year (2024) and 5-year average (2020 through 2024) utilization rates for each Line of Business, with comparisons to the U.S. 1-year and 5-year average utilization rates, and the 1-year highest/lowest utilization rate across all states.
The method of calculating the Line of Business Surplus Lines Utilization Percentage (%) is shown in Equation 5, which follows Table 8.
Table 8 | Source: © A.M. Best Company — used by permission.
Equation 5 | Source: Real Insurance Solutions Consulting
Readers should take note of the distinction between Figure 15 and Table 8, and their corresponding equations. In essence, Figure 15 is the Line of Business share of the Surplus Lines marketplace, while Table 8 is the Utilization rate of Surplus Lines within each Line of Business. Equations 6 and 7 show this distinction via their denominators.
Figure 16, 2024 Louisiana Admitted and Surplus Lines Premium Tax Revenues, illustrates in a pie chart the state tax revenues generated annually from Admitted and Surplus Lines P&C insurance premiums in Louisiana. To arrive at the Louisiana premium tax revenues, the applicable state tax rate is applied to premiums. For Admitted tax revenue an average rate is used, as shown in Equation 6 below Figure 16. For Surplus Lines the tax rate used is the predominant Surplus Lines tax rate. That predominant rate is the one generally listed first for each state in tax and regulatory summaries, like the source cited under Figure 16 and Table 9 (Troutman Pepper Locke).
The box in Figure 16 gives the 2024 Louisiana total P&C insurance premium tax contribution, as a percentage of all Louisiana revenues coming from state taxes. Also, the average Admitted Tax Rate, and Surplus Lines Tax Rate in Louisiana is included.
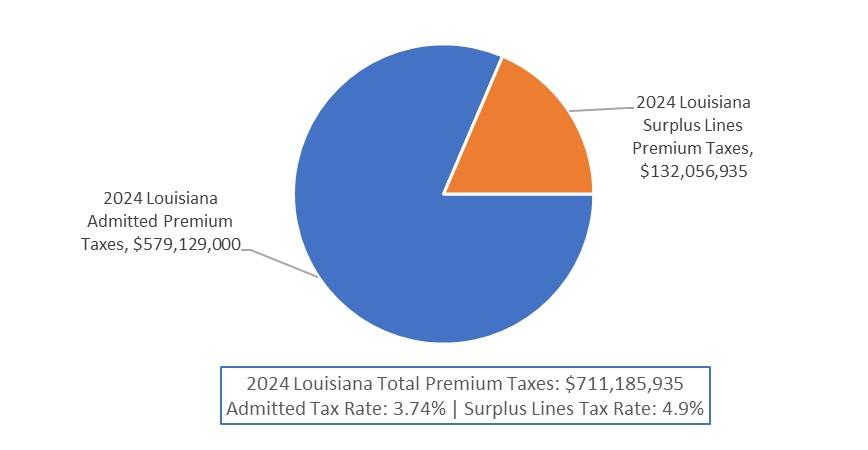
Figure 16 | Source: © A.M. Best Company — used by permission, NAIC IID Surplus Lines Industry Summary and 2024 Excess and Surplus Lines Laws Manual, Troutman Pepper Locke, Lerner & Emmanuel
Calculating the Admitted Premium Tax Rate
Equation 6 | Source: Real Insurance Solutions Consulting
Regarding state tax collection generally, P&C insurance premium taxes are classified as All Other or “Miscellaneous Revenues.” State budget watchers define Miscellaneous Revenue as including excise taxes on things like cigarettes, severance taxes for extraction of natural resources like oil, premium taxes, and in some states lottery income. The remainder of revenue from state tax collections comes
from sales taxes, personal income taxes, and corporate income taxes, with some states forgoing some forms of taxes altogether.
Figure 17, 2024 Louisiana Premium Taxes and State Revenue, illustrates how Louisiana premium tax revenue compares to other reported state revenue sources.
The box below the bar chart provides a 2024 Louisiana per capita premium tax figure, calculated based on total premium taxes in Louisiana from the previous Figure 16, divided by the population estimate from the United Census Bureau. The box also provides the percentage of all Louisiana premium taxes to all Louisiana state tax revenues.
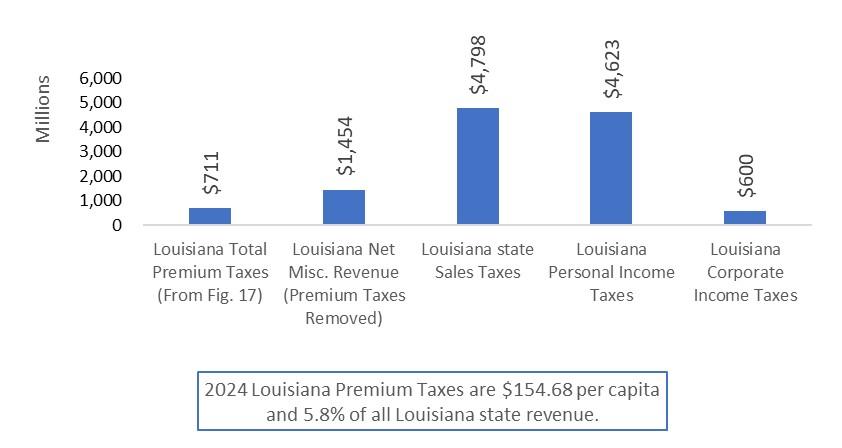
Figure 17 | Source: A.M. Best Financial Suite (Used with Permission) and 2024 National Association of State Budget Officers, GF Revenue Historical Dataset and United States Census Bureau, Population Division and Annual Estimates of Resident Population (Release Date: December 2024)
Table 9, 2024 Louisiana Premium Taxes Summary, provides some data points to compare using data from Figures 16 and 17. Shown is the Louisiana Admitted average premium tax rate, Surplus Lines predominant tax rate, per capita premium taxes, and premium taxes as a percentage of all state revenue. The Louisiana Admitted and Surplus Lines tax rate rank out of 51 states is provided, with percent comparisons to the United States average, and the states with the highest and lowest premium tax rates.
Table 9 | Source: © A.M. Best Company — used by permission, NAIC IID Surplus Lines Industry Summary and 2024 Excess and Surplus Lines Laws Manual, Troutman Pepper Locke, Lerner & Emmanuel
The following section presents an in-depth look at the 26 P&C Lines of Business focused on by independent agents in Louisiana. The data for all Lines of Business combined appears first, followed by individual pages for each individual Line of Business, organized alphabetically. For definitions of each Line of Business, refer to Appendix #2: NAIC Line of Business Definitions
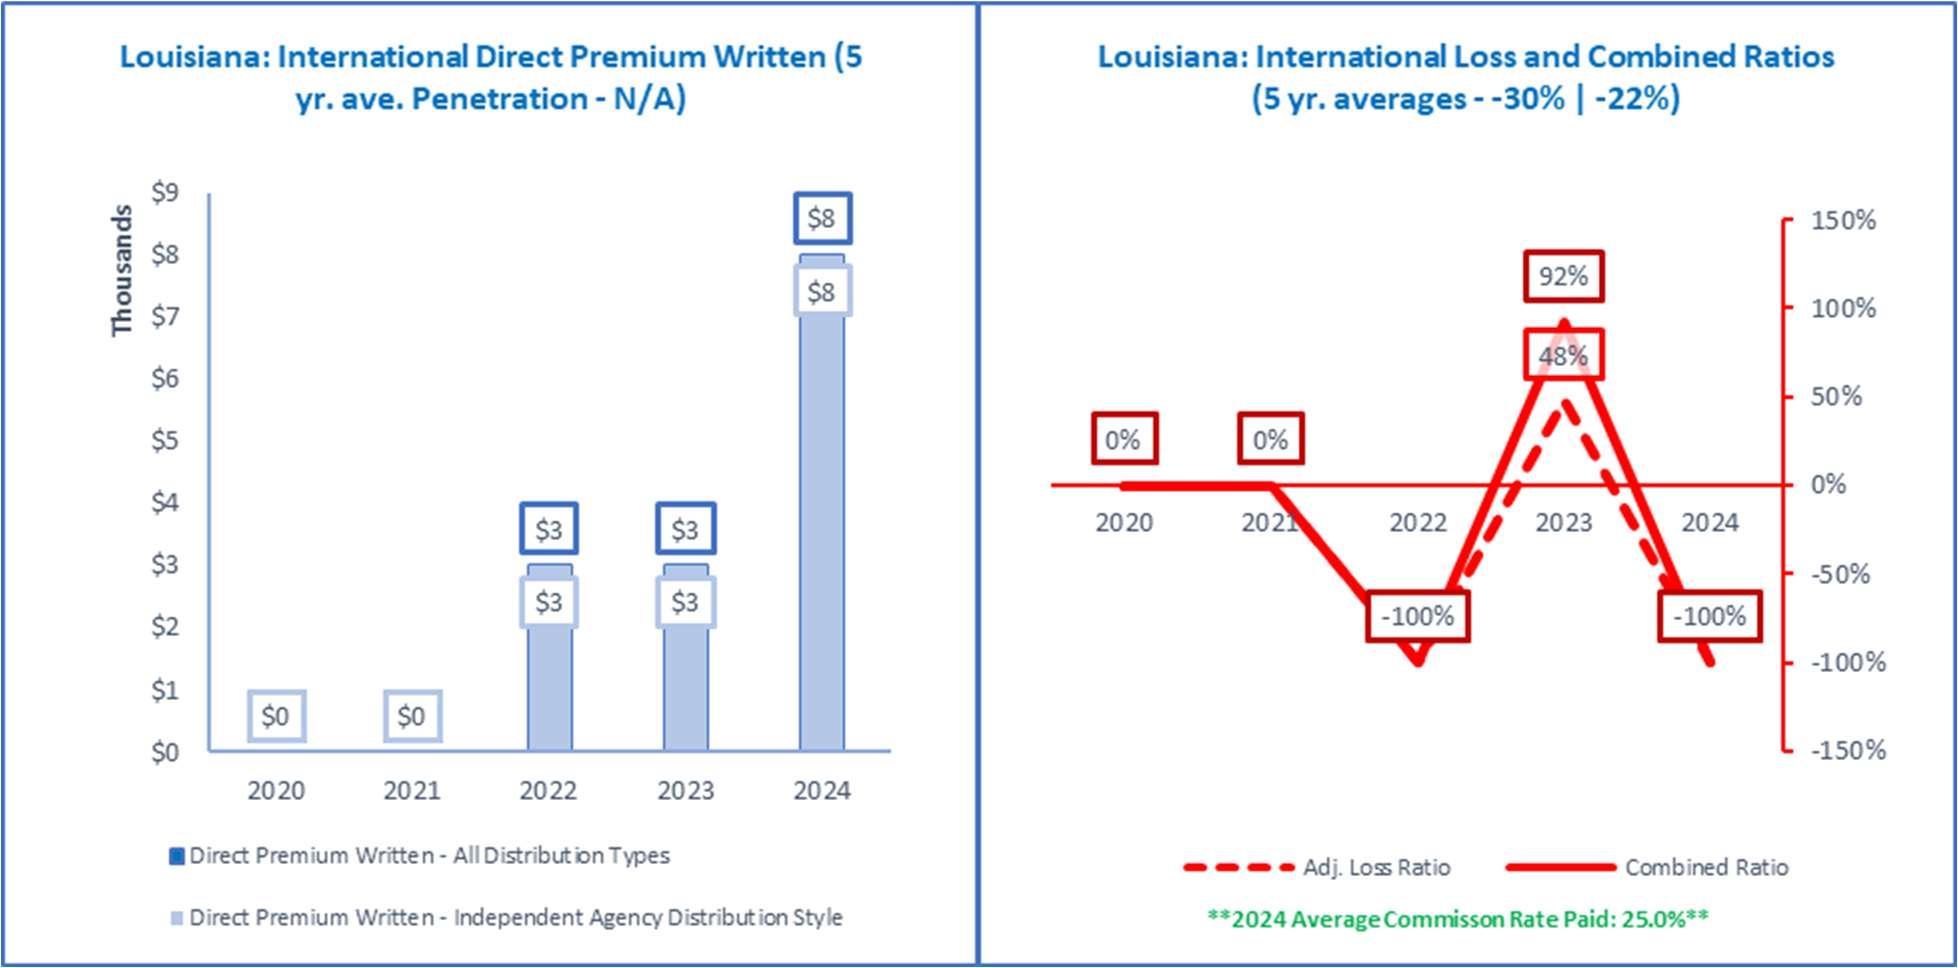
The data in the 27 pages of detailed graphs and tables that follow aims to provide independent agents with an understanding, perspective, and detailed information for each Line of Business. First, via the bar and line charts, a high-level perspective is provided on premium trends, Independent Agent Penetration, and Loss and Combined Ratios. Then, via the tabular data below the bar and line charts, detailed information and lists of top insurers is provided.
Line of Business details include exact premium dollars, commissions, exact penetration percentages, and numbers of active insurers by Distribution Style, and for Surplus Lines. Lists of top insurers are provided including: the Top 5 Groups, the Top 5 Pure Independent Agent (IA)/Broker insurers, Top 3 Managing General Agent (MGA)/Wholesale, Top 3 Exclusive/Captive, Top 3 Direct, Top 3 Surplus Lines, and last the highest-ranking Risk Retention Group (RRG) if there is one for the Line of Business.
To conserve space, Figure and Table numbers have been omitted under each graph and table and numerous abbreviations are used. Appendix #3: Lines of Business—Visual Reference and Abbreviations of Key Terms provides a complete list of these abbreviations in the order they appear in the Line of Business In-Depth Detail Pages with an explanation of each.
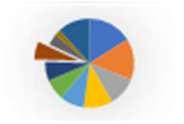
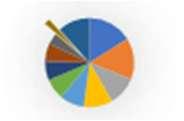
Note: On the following 27 pages when a Line of Business ranks among the Top 10 for independent agents in Louisiana, there is a small pie chart thumbnail in the upper-right corner of the Line of Business In-Depth Detail Page. The exploded (bumped out) pie slice indicates the position of that Line of Business in the Top 10. See below example for a Line of Business ranked 2nd among the Top 10.
Note: At the bottom of each table in the Line of Business In-Depth Detail Pages, following the source citation, you’ll find a brief statement describing the types of policies included in each Line of Business.
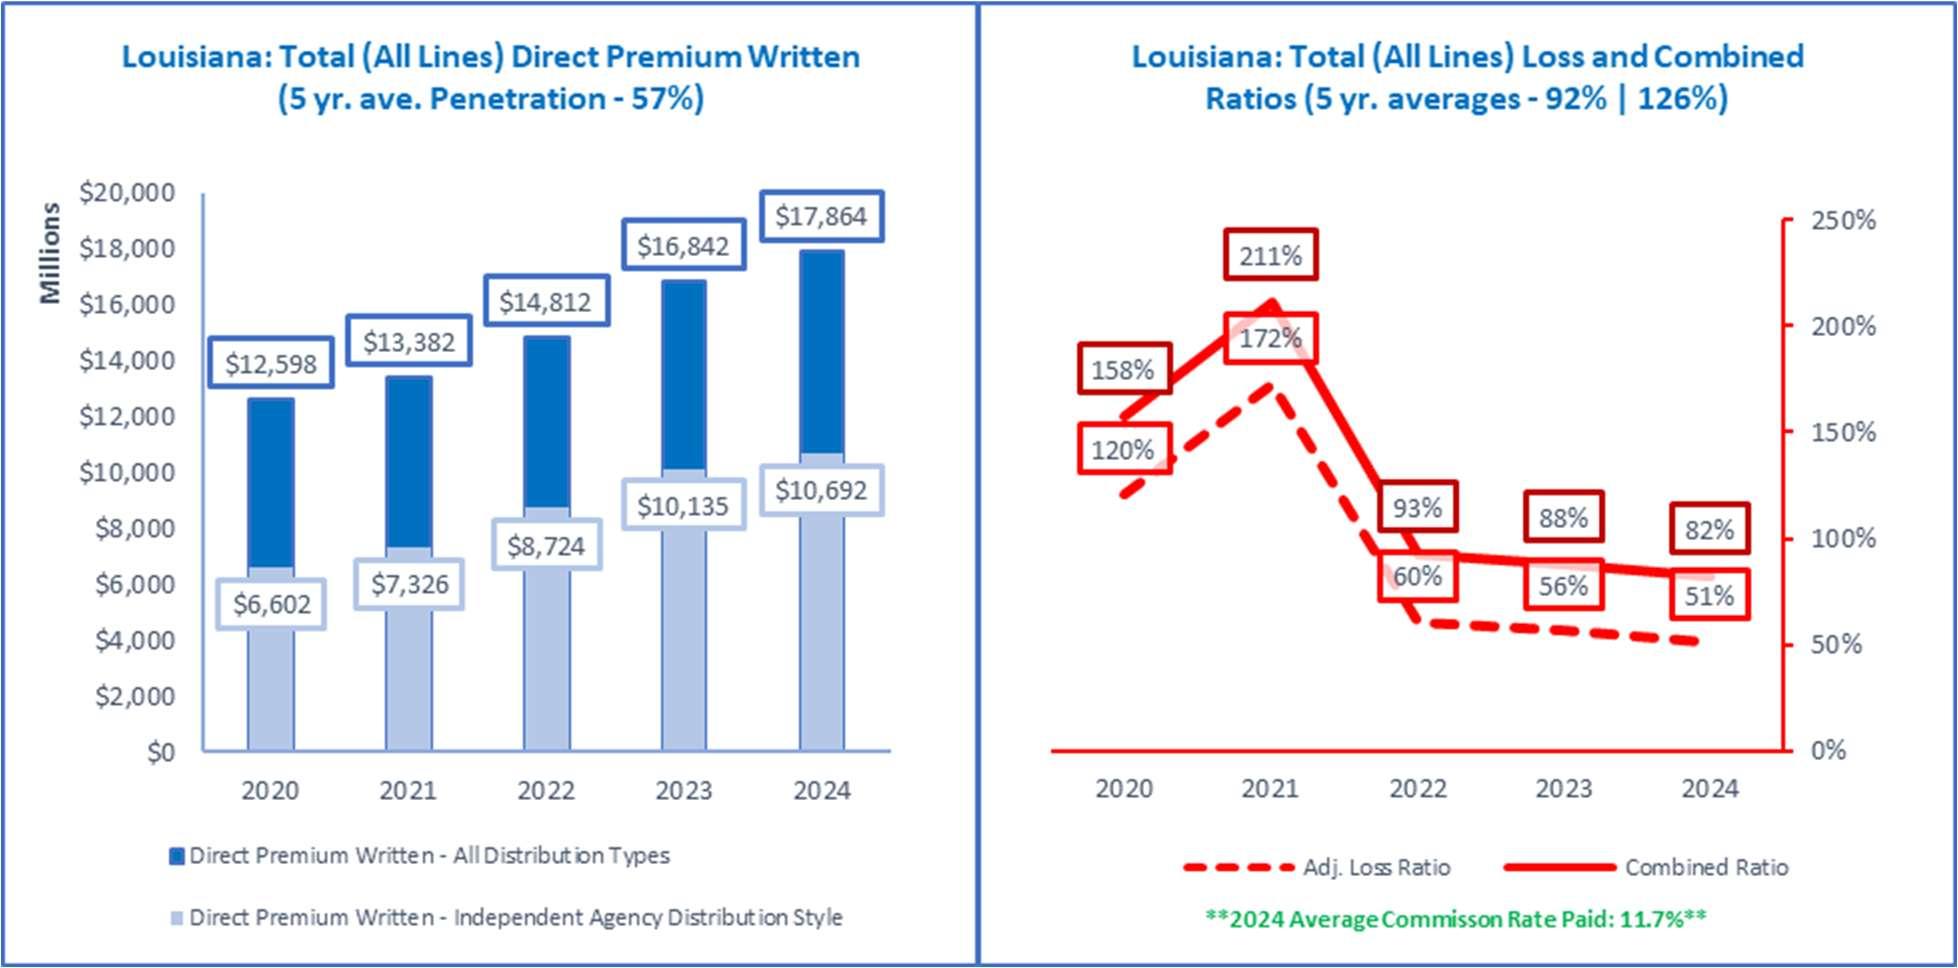
Source: © A.M. Best Company — used by permission. (Included in the above data are all P&C policies issued in Louisiana for all 32 Lines of Business from Aircraft to Workers’ Compensation.)
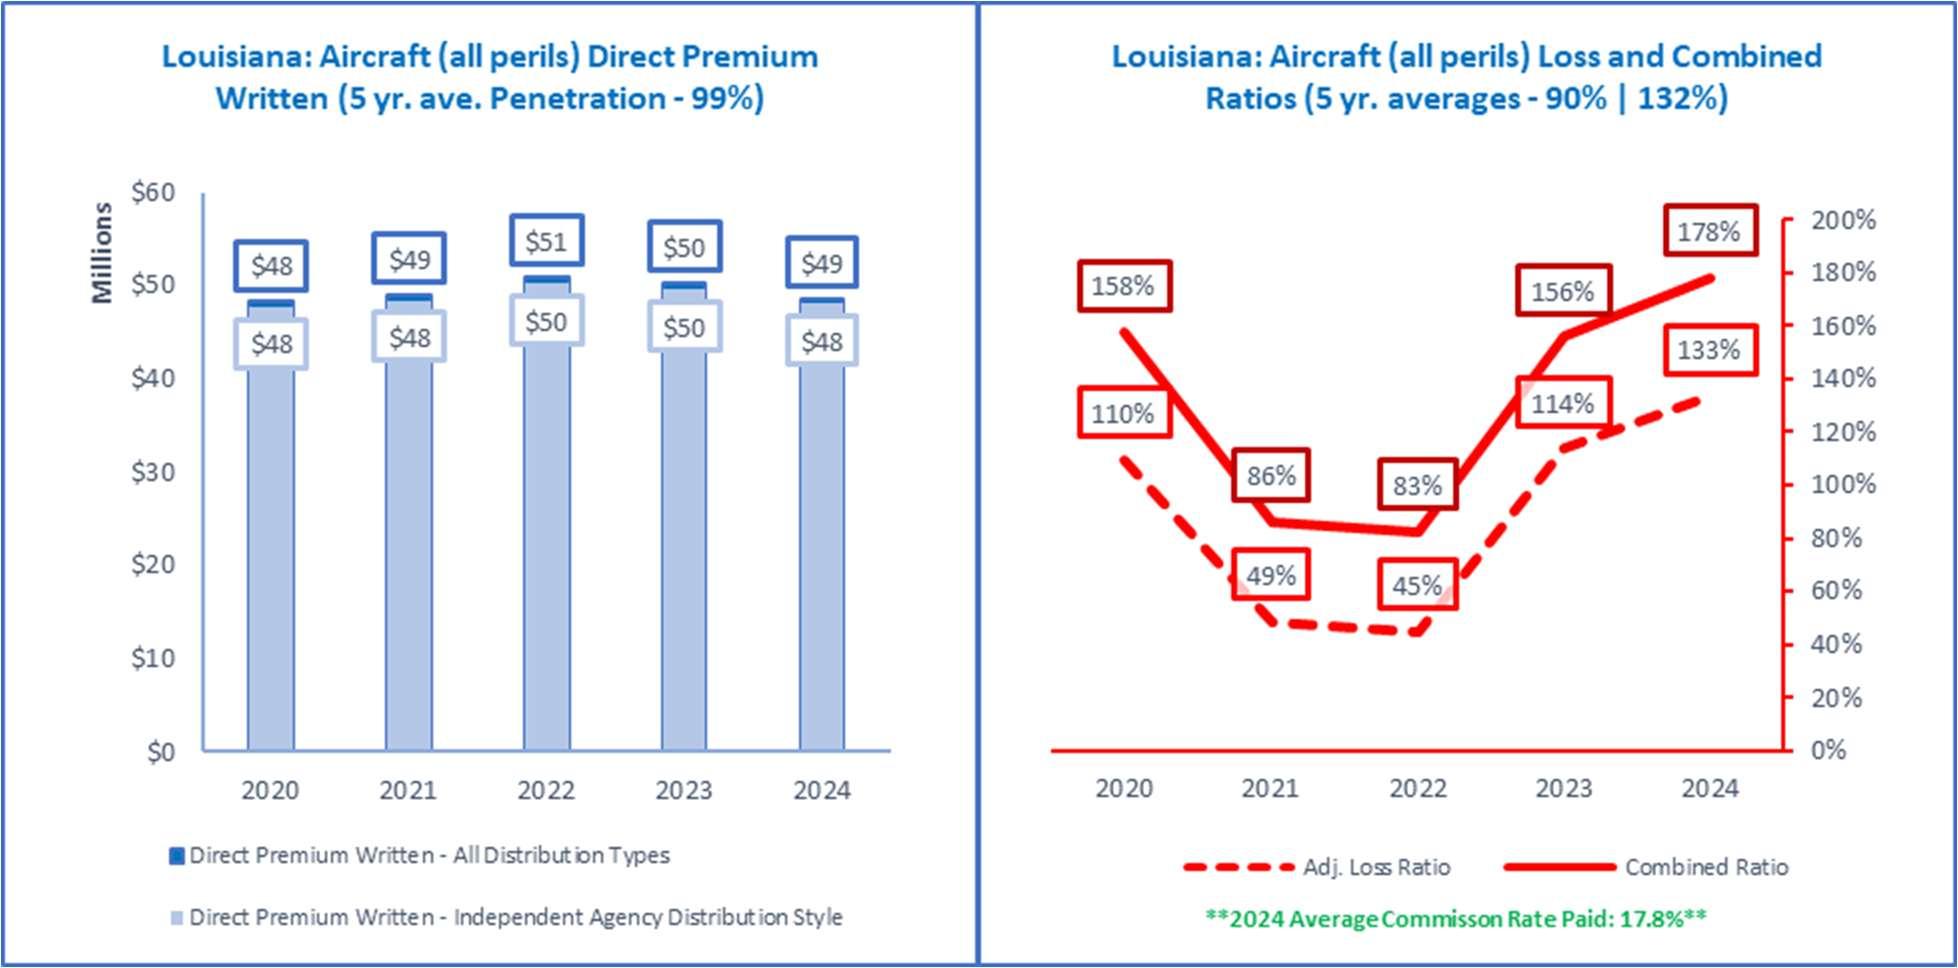
Source: © A.M. Best Company — used by permission. (Included in the above data are all P&C policies issued in Louisiana for property damage to aircraft themselves with any liability for operating an aircraft, an airport, and manufacture of aircraft)
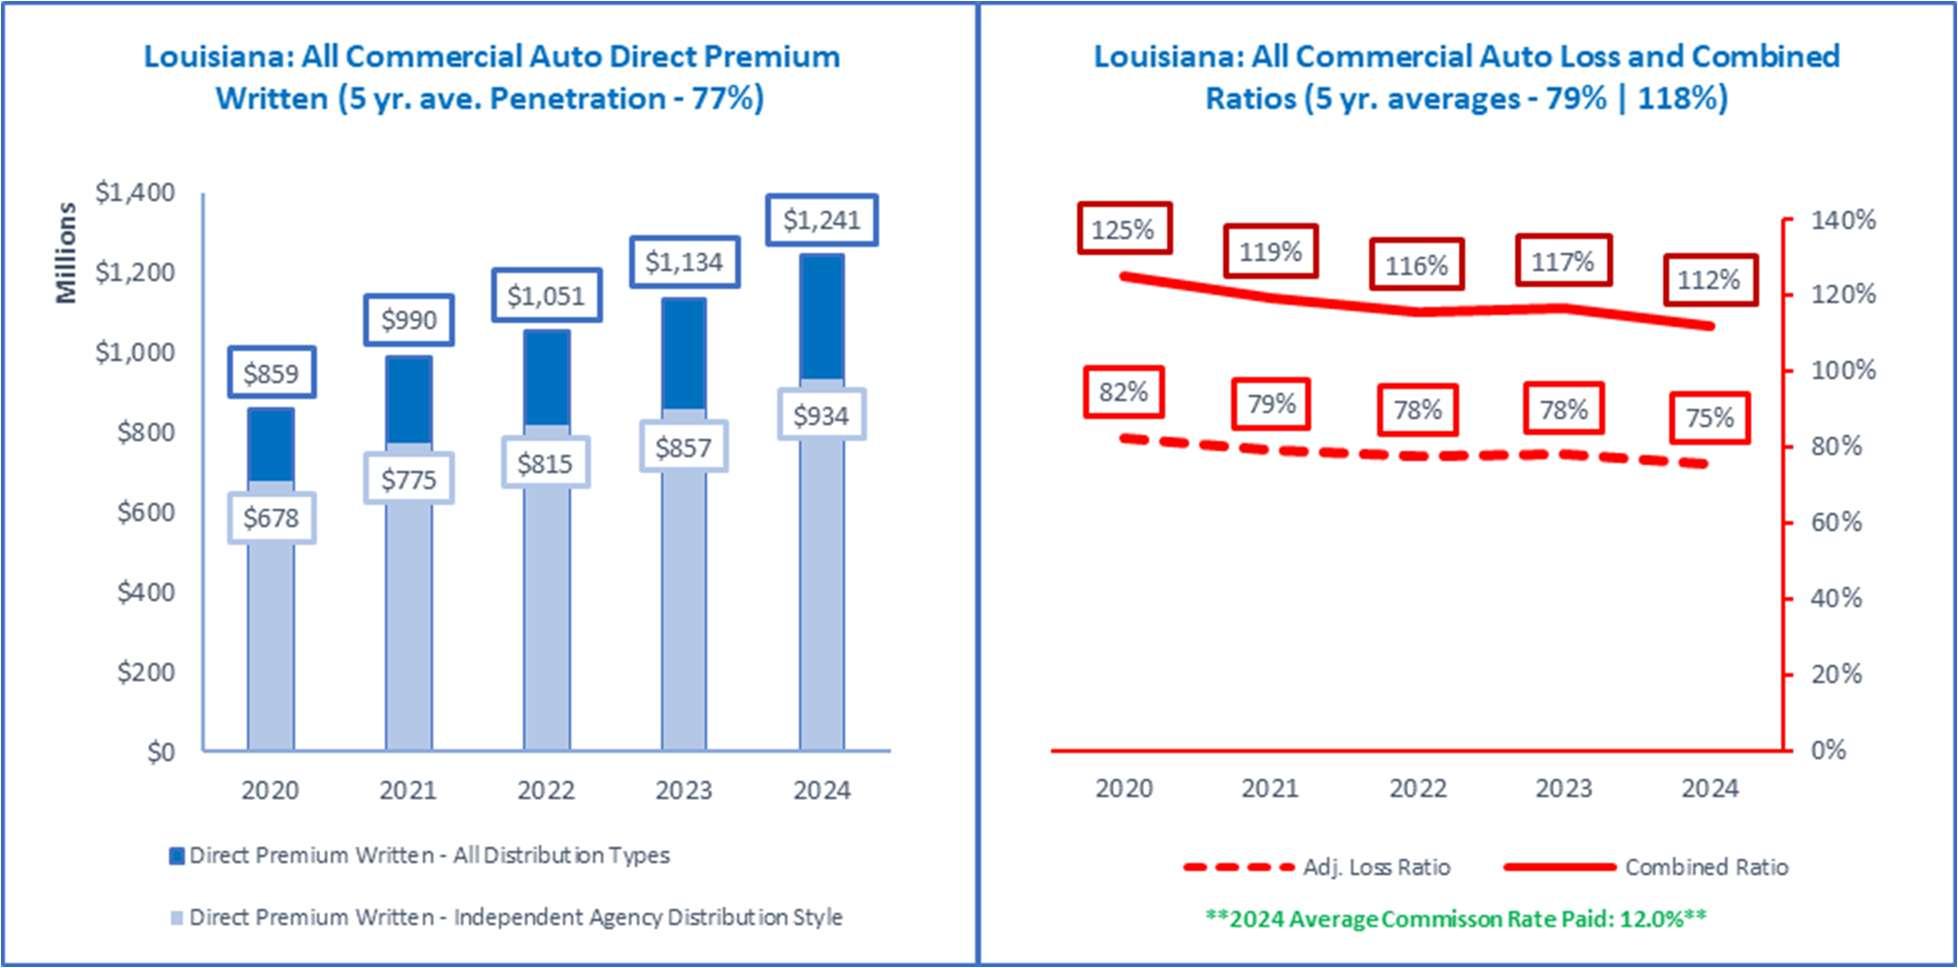
Source: © A.M. Best Company — used by permission. (Included in the above data are all P&C policies issued in Louisiana to cover commercial auto liability, physical damage, uninsured motorist, and no-fault benefits, if applicable).
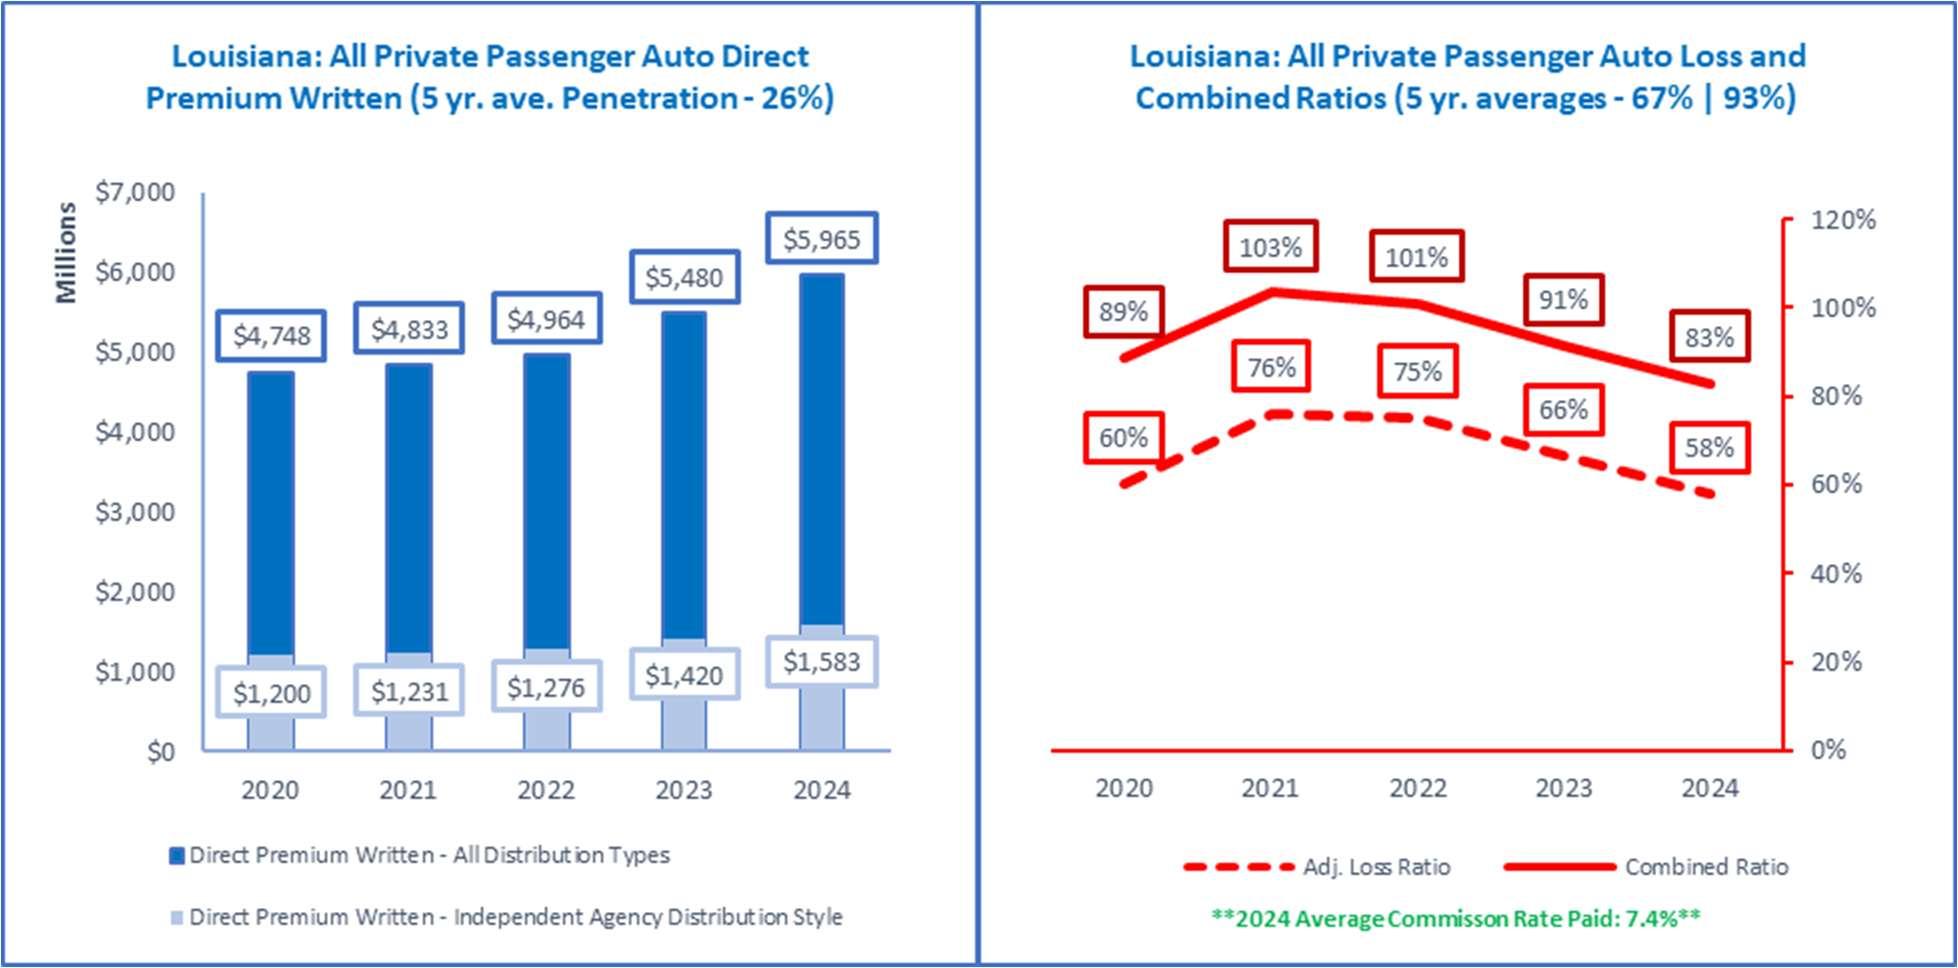
Source: © A.M. Best Company — used by permission. (Included in the above data are all P&C policies issued in Louisiana to cover private passenger auto liability, physical damage, uninsured motorist, and no-fault benefits, if applicable).
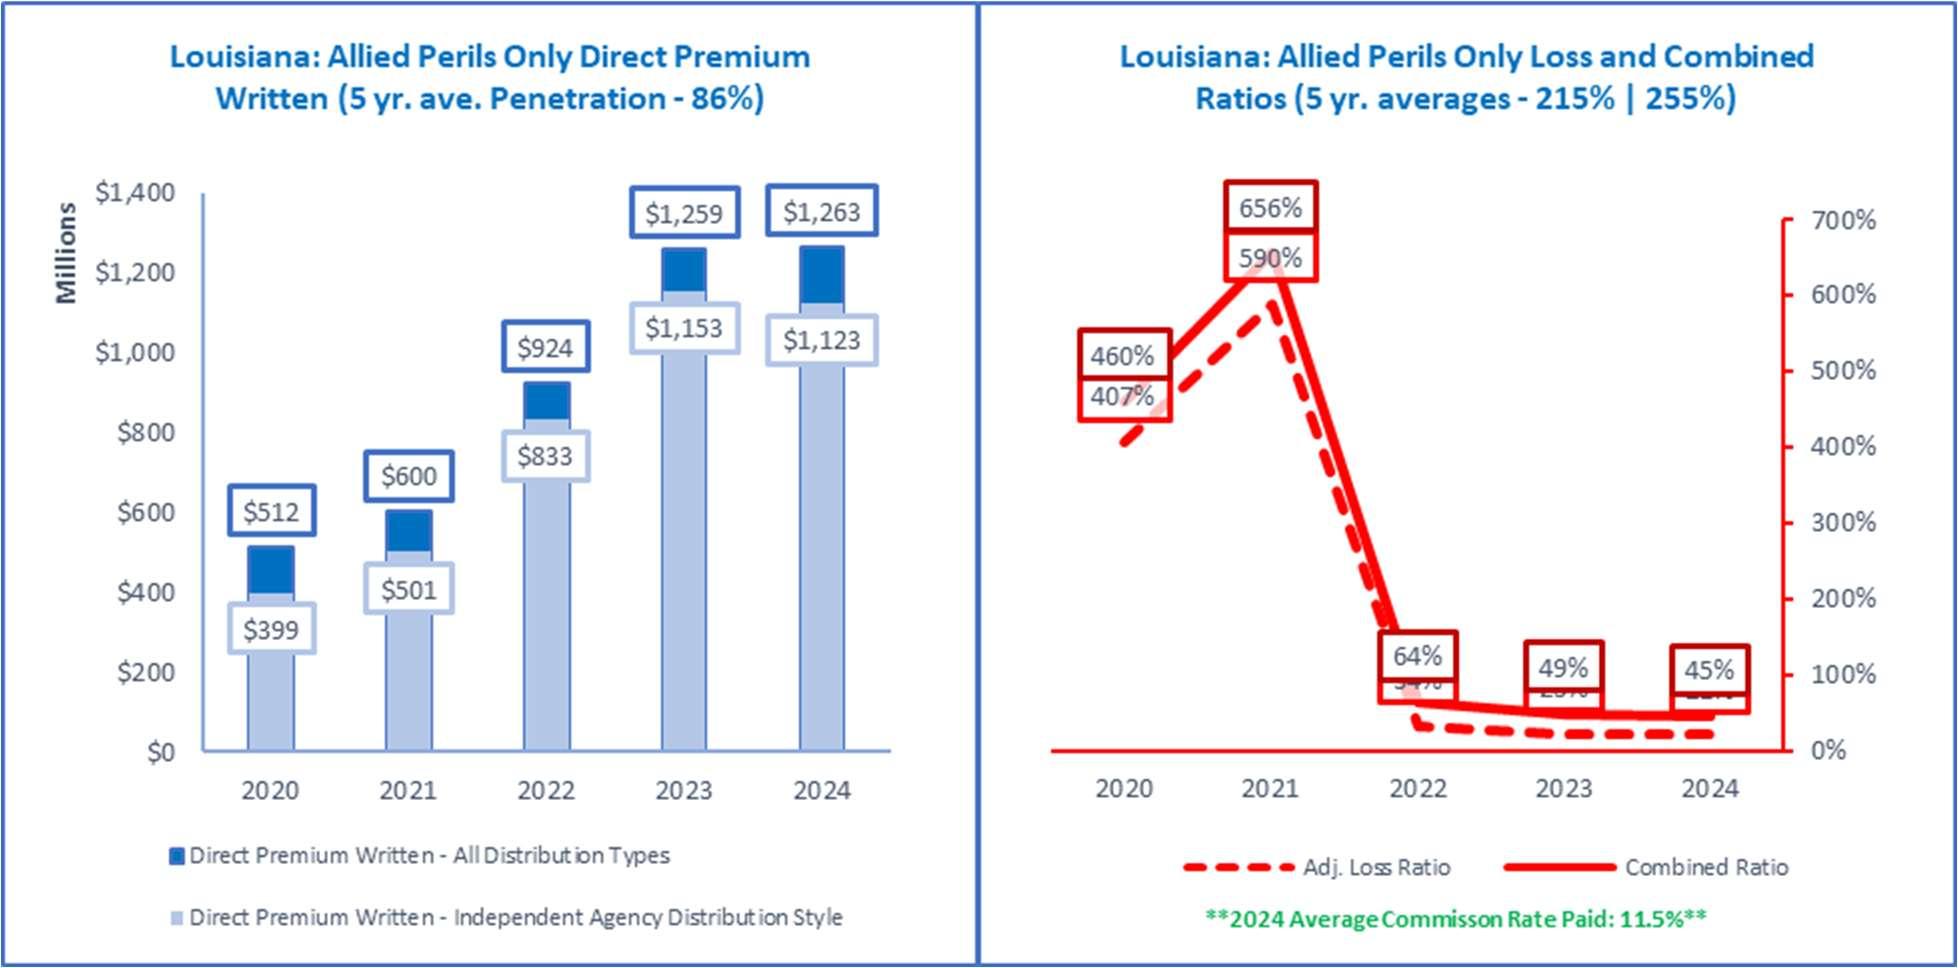
Source: © A.M. Best Company — used by permission. (Included in the above data are all P&C policies issued in Louisiana to cover real or personal property for other than fire, such as windstorm, hail, vehicles, etc. If premiums are combined in policies with Fire, the premiums and losses are reported as they are allocated by insurers).
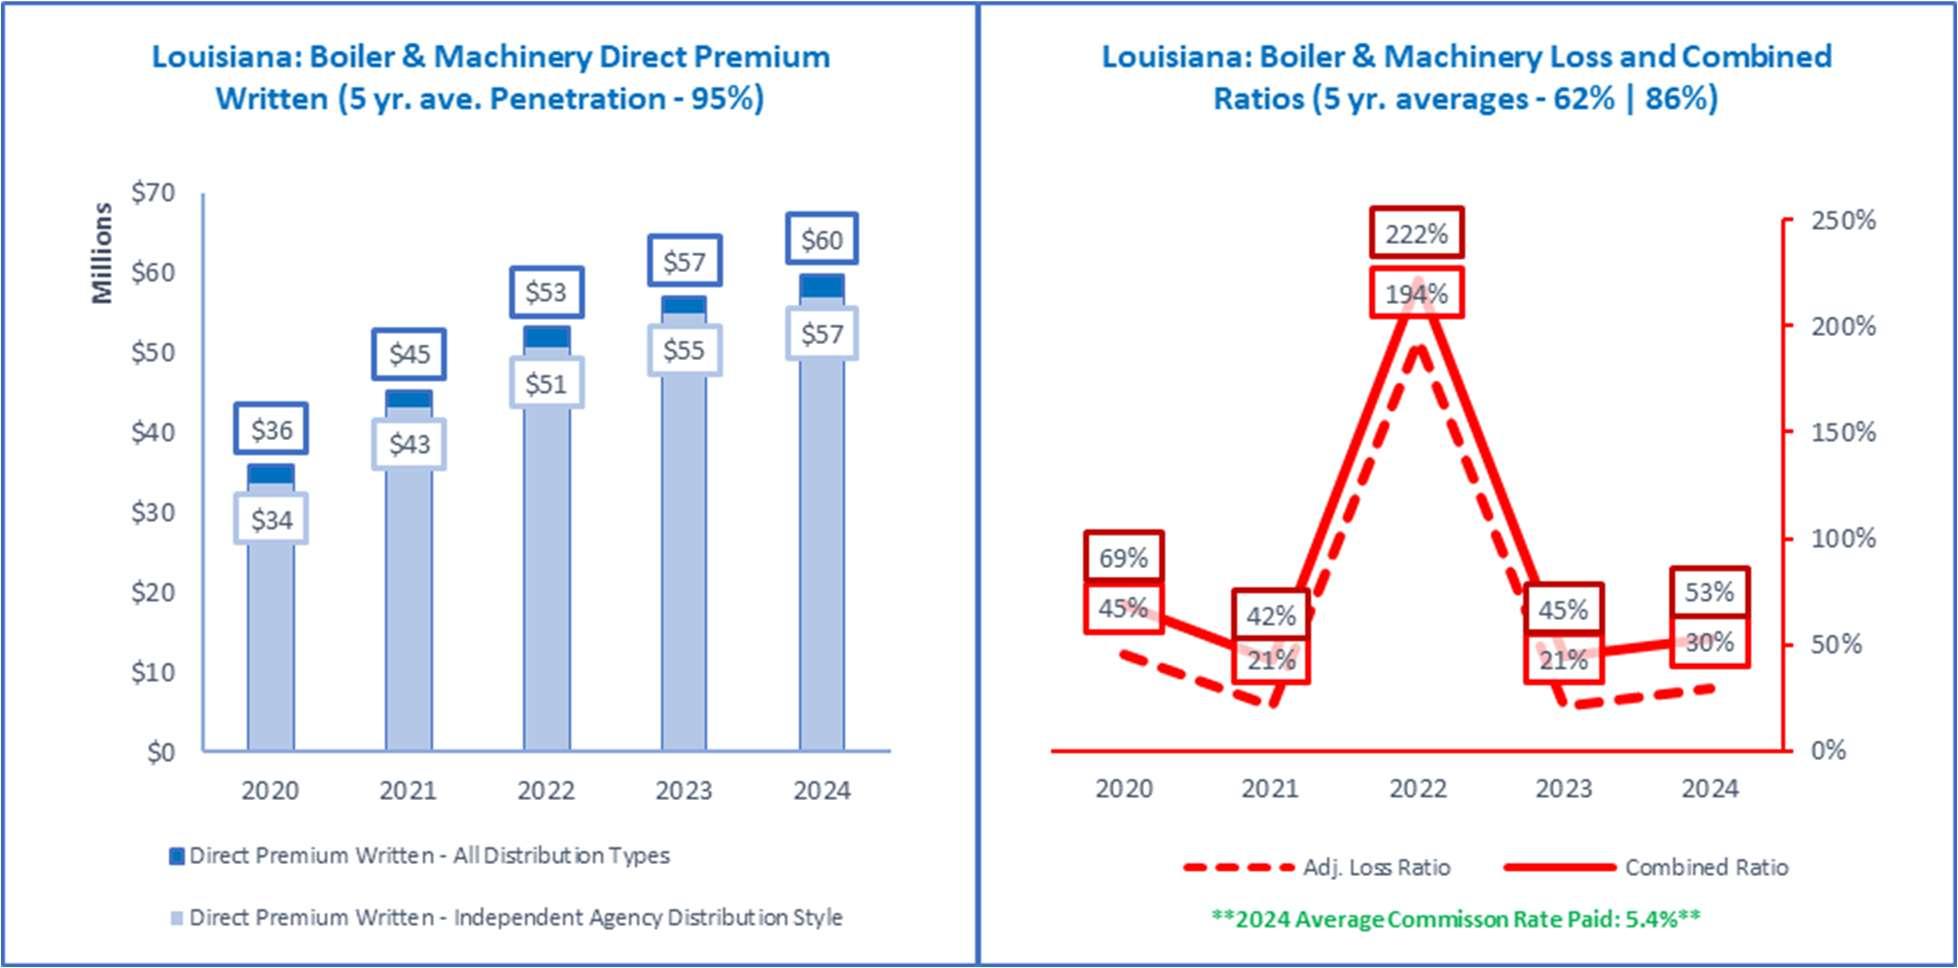
Source: © A.M. Best Company — used by permission. (Included in the above data are all P&C policies issued in Louisiana to cover failure of boilers, machinery and electrical equipment).
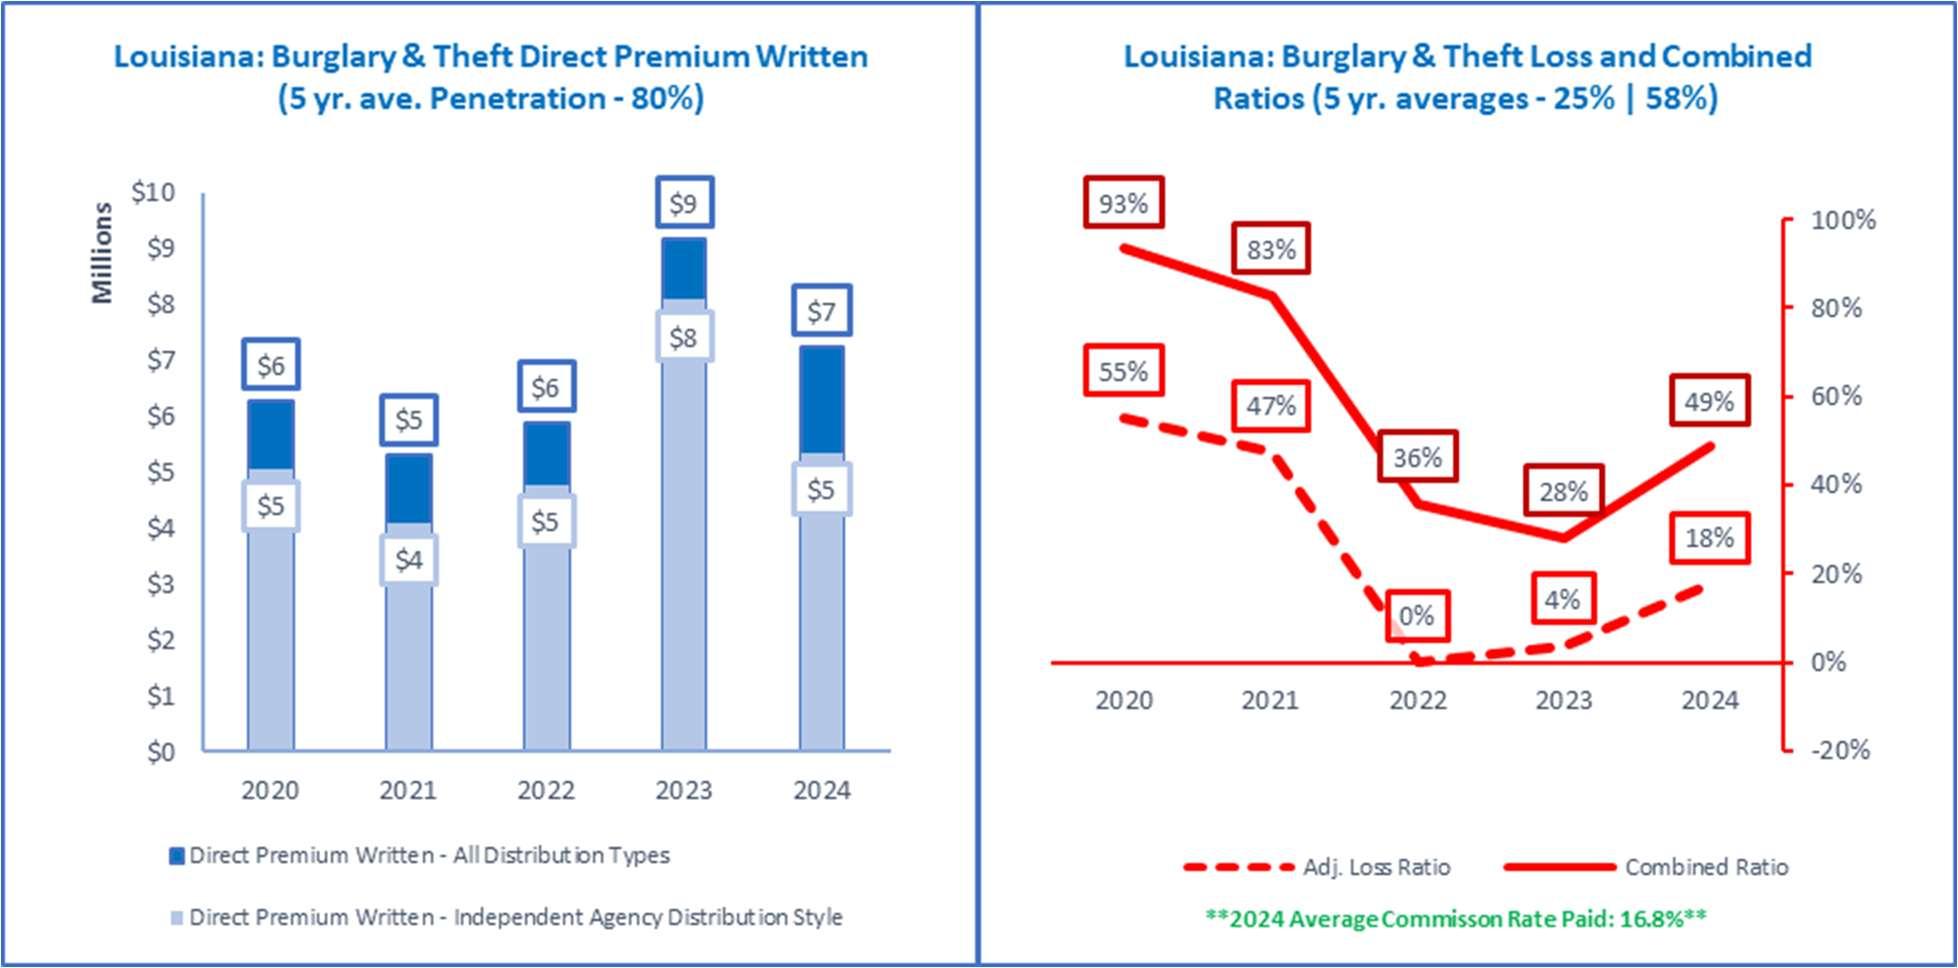
Source: © A.M. Best Company — used by permission. (Included in the above data are all P&C policies issued in Louisiana to cover property lost due to burglary, robbery, fraud or kidnap).
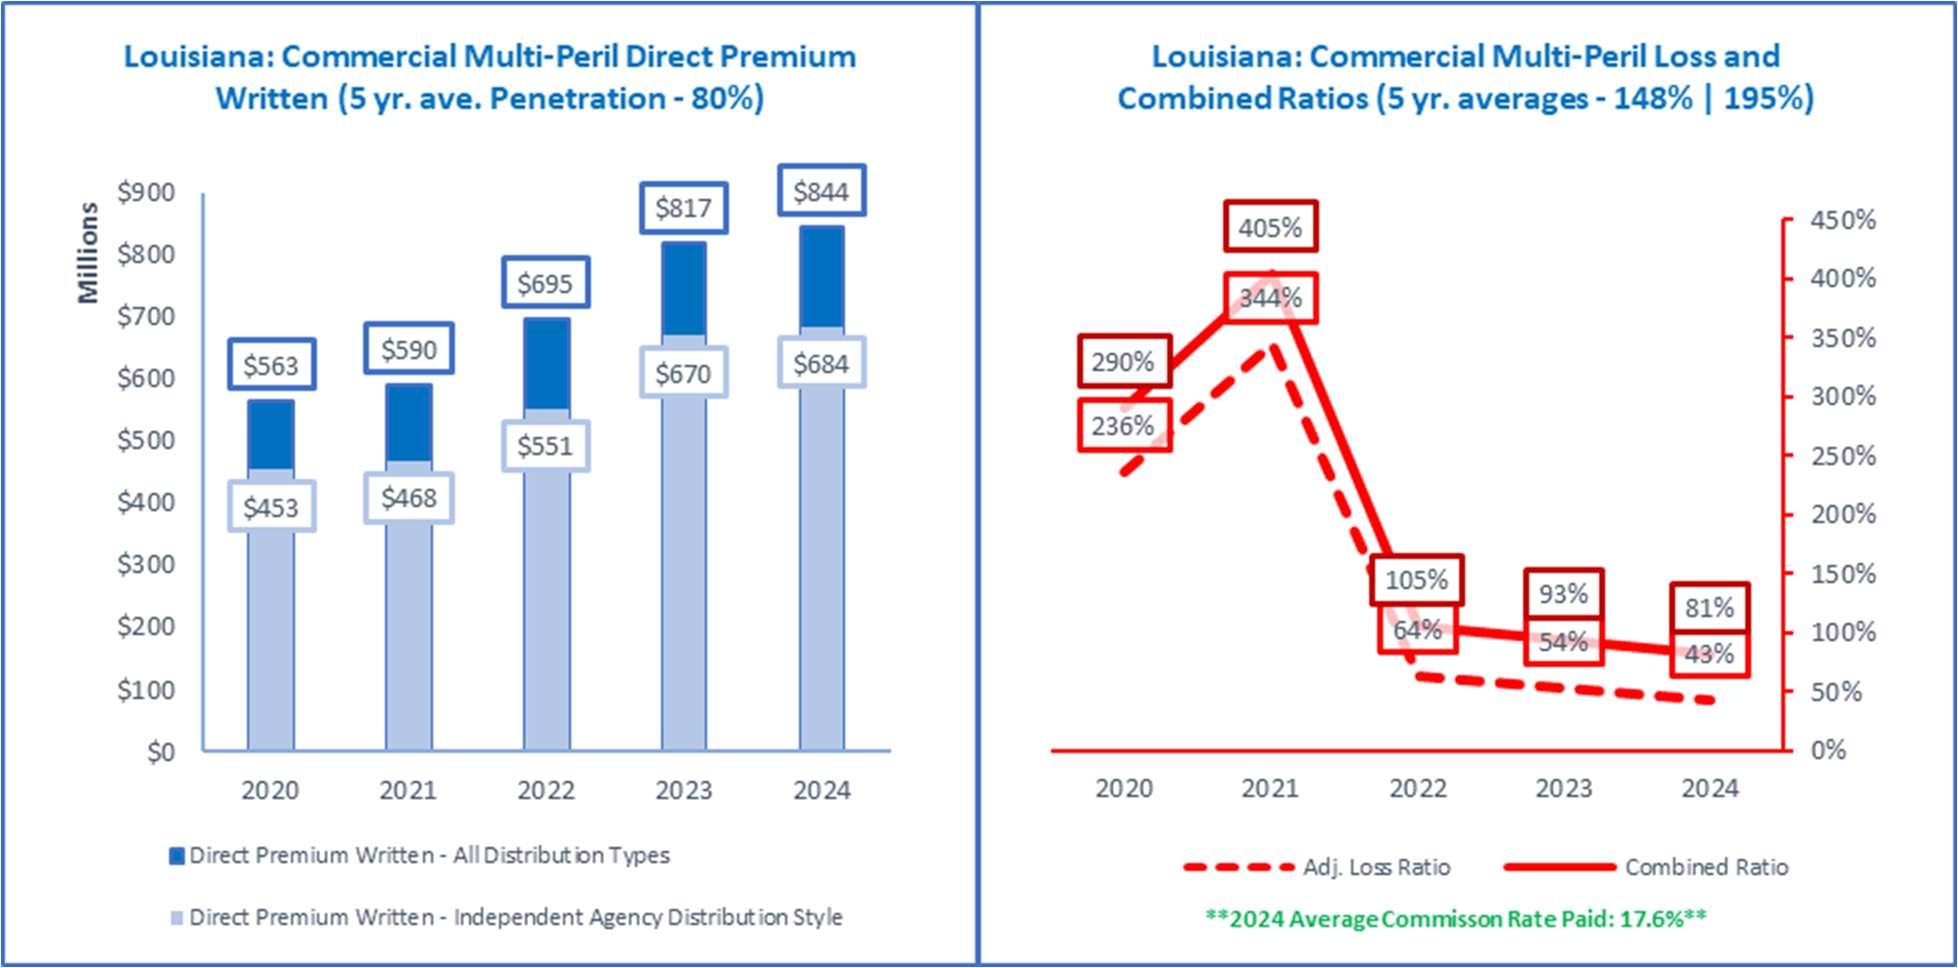
Source: © A.M. Best Company — used by permission. (Included in the above data are all P&C package policies issued in Louisiana to cover commercial enterprises for property and liability).
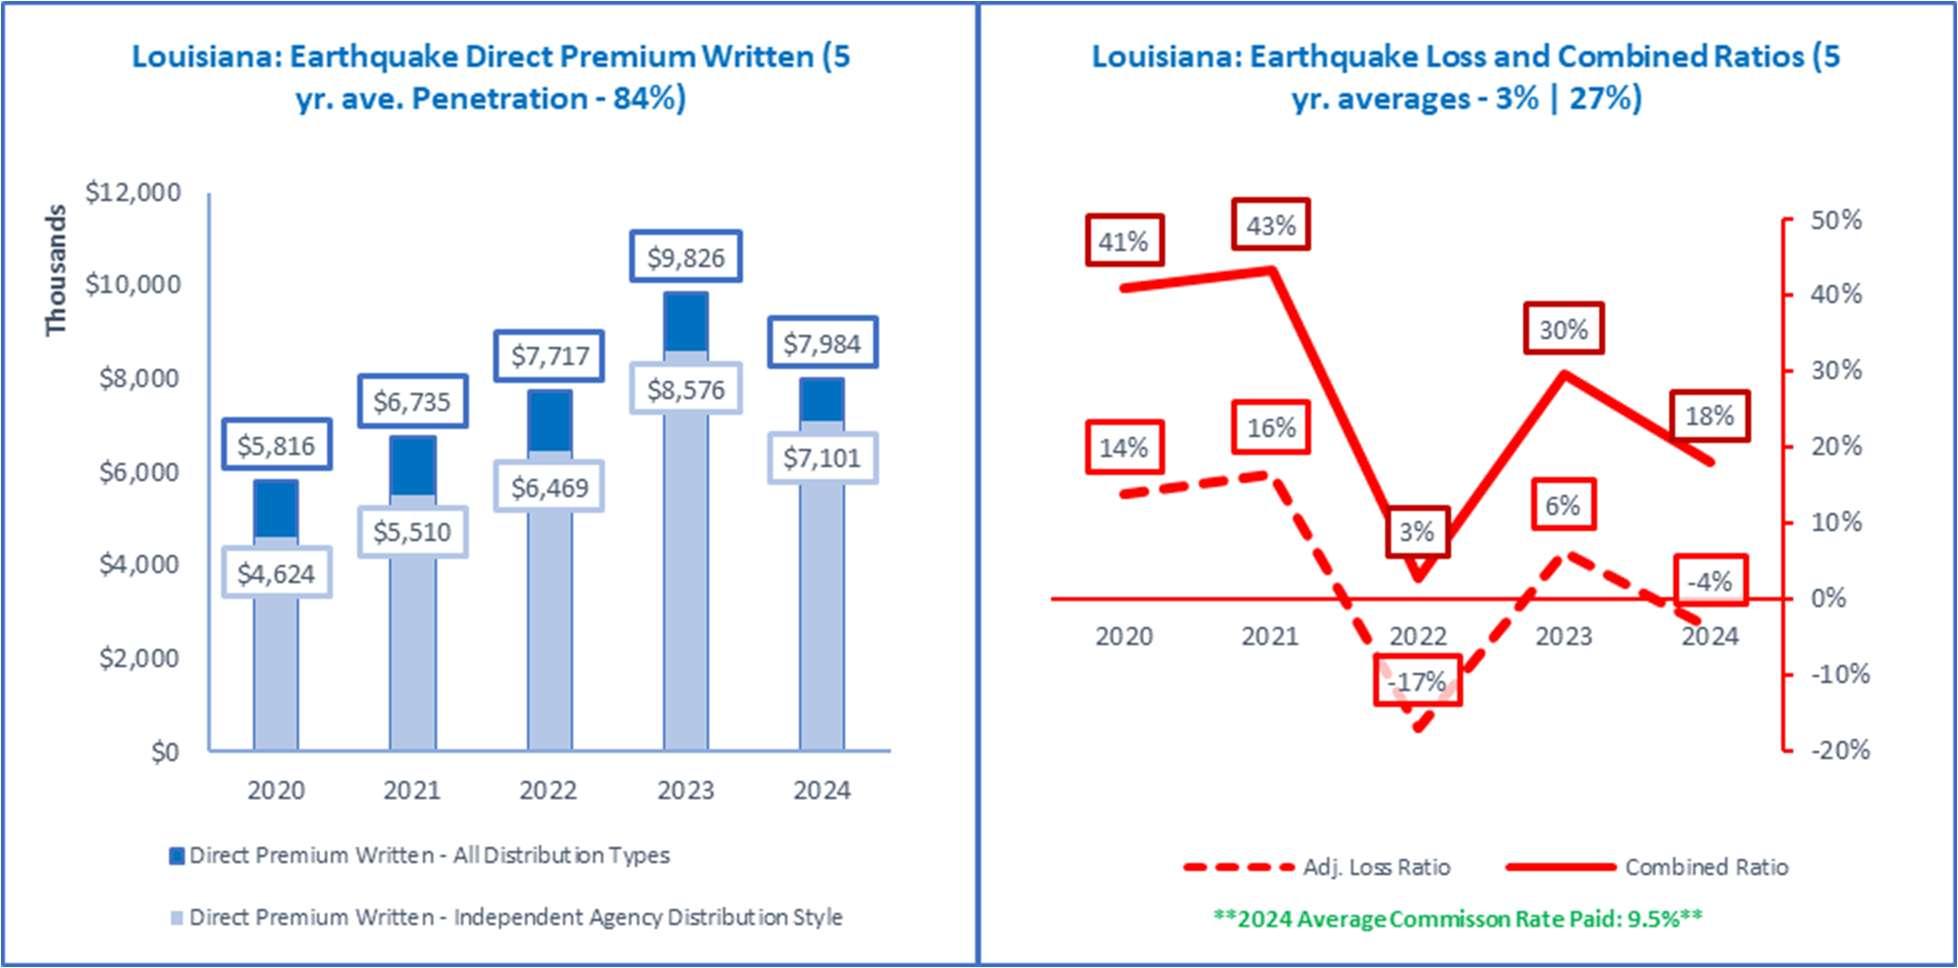
Source: © A.M. Best Company — used by permission. (Included in the above data are all P&C policies issued in Louisiana to cover sudden trembling or shaking of the earth, including volcanos.
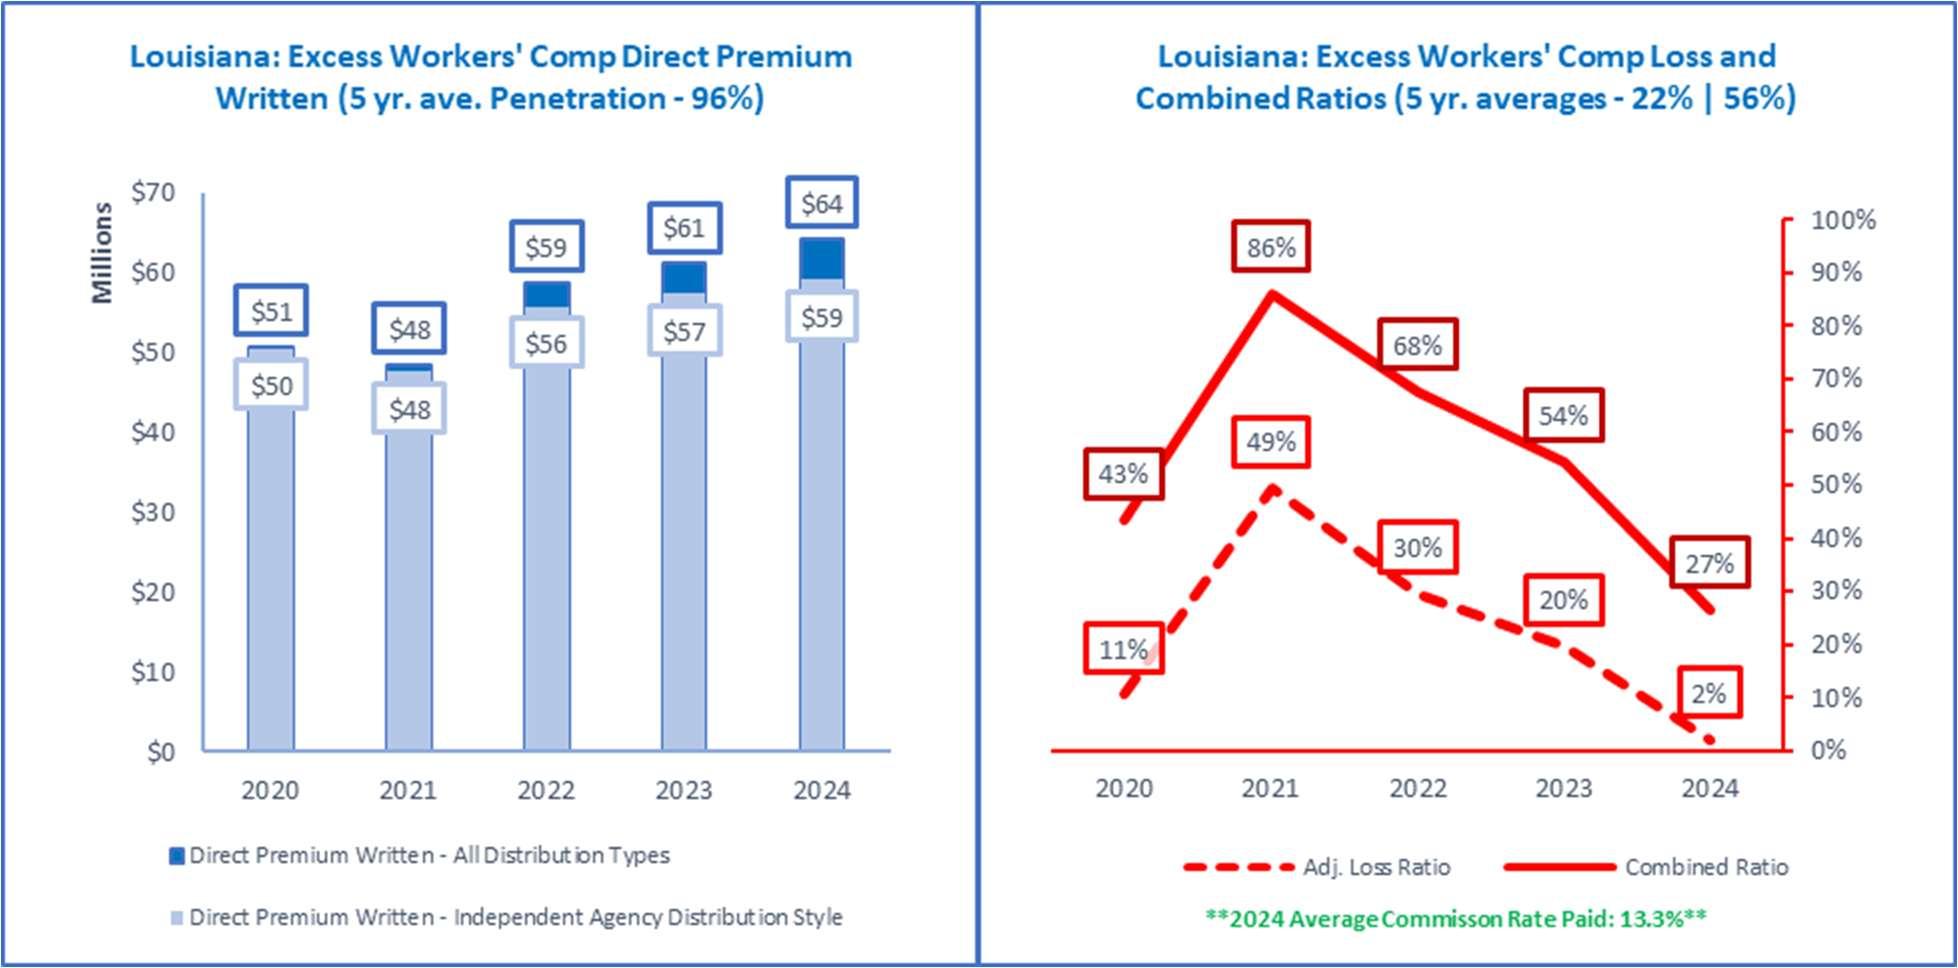
Source: © A.M. Best Company — used by permission. (Included in the above data are all P&C policies issued in Louisiana to cover indemnity of employers for self-insured employers, usually written on an excess basis or via a high deductible).
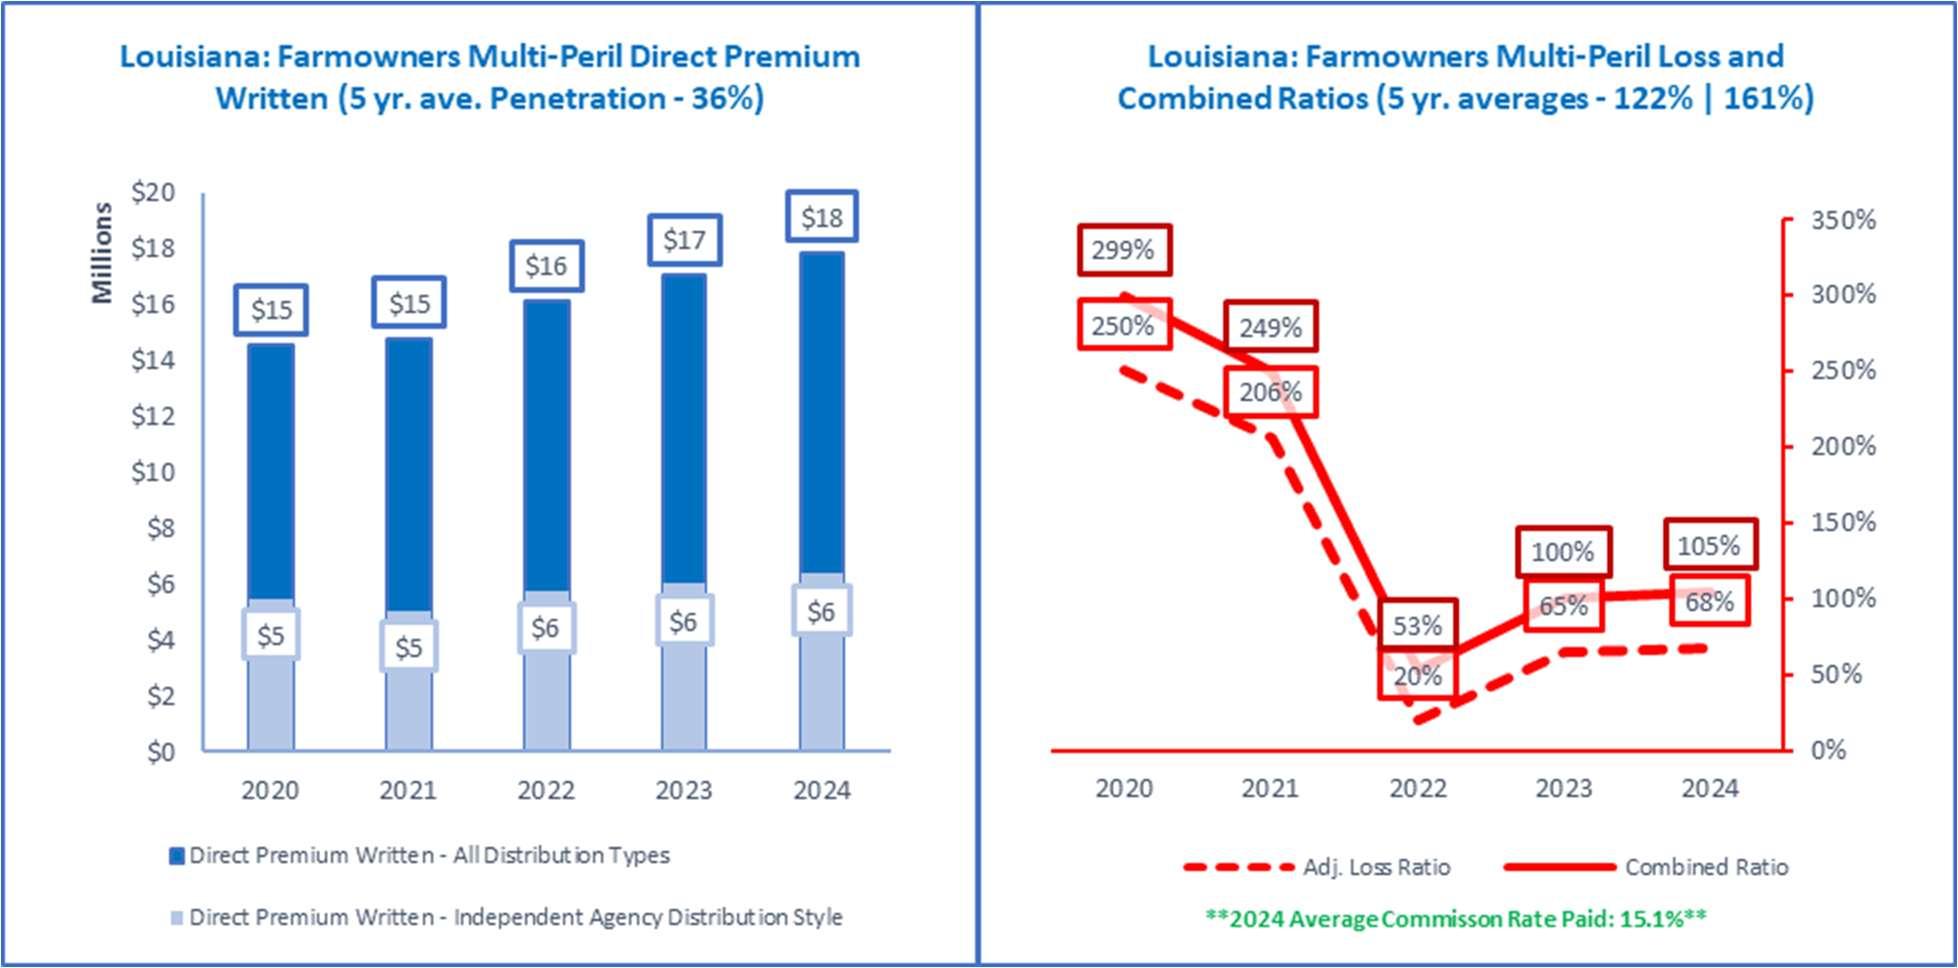
Source: © A.M. Best Company — used by permission. (Included in the above data are all P&C policies issued in Louisiana to cover property and liability risks of farming and ranching operations).
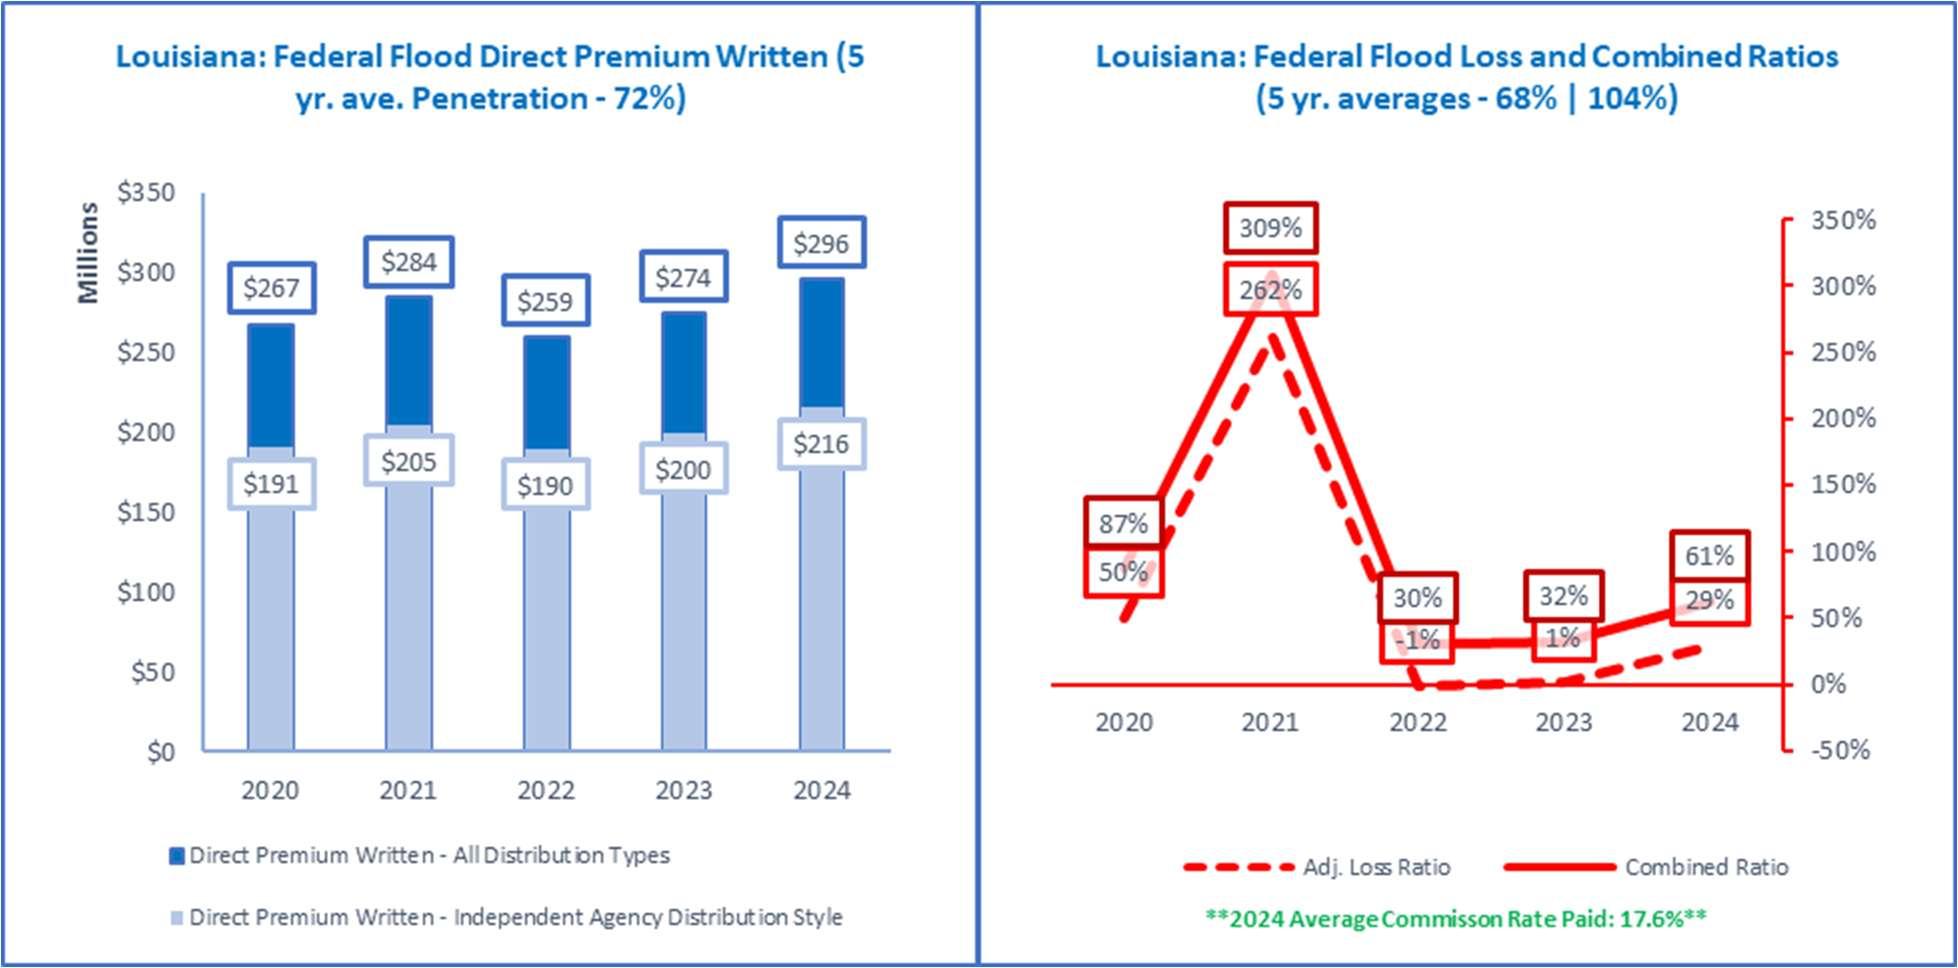
Source: © A.M. Best Company — used by permission. (Included in the above data are all P&C policies issued in Louisiana under the Federal Flood Insurance Program and the Write Your Own program).
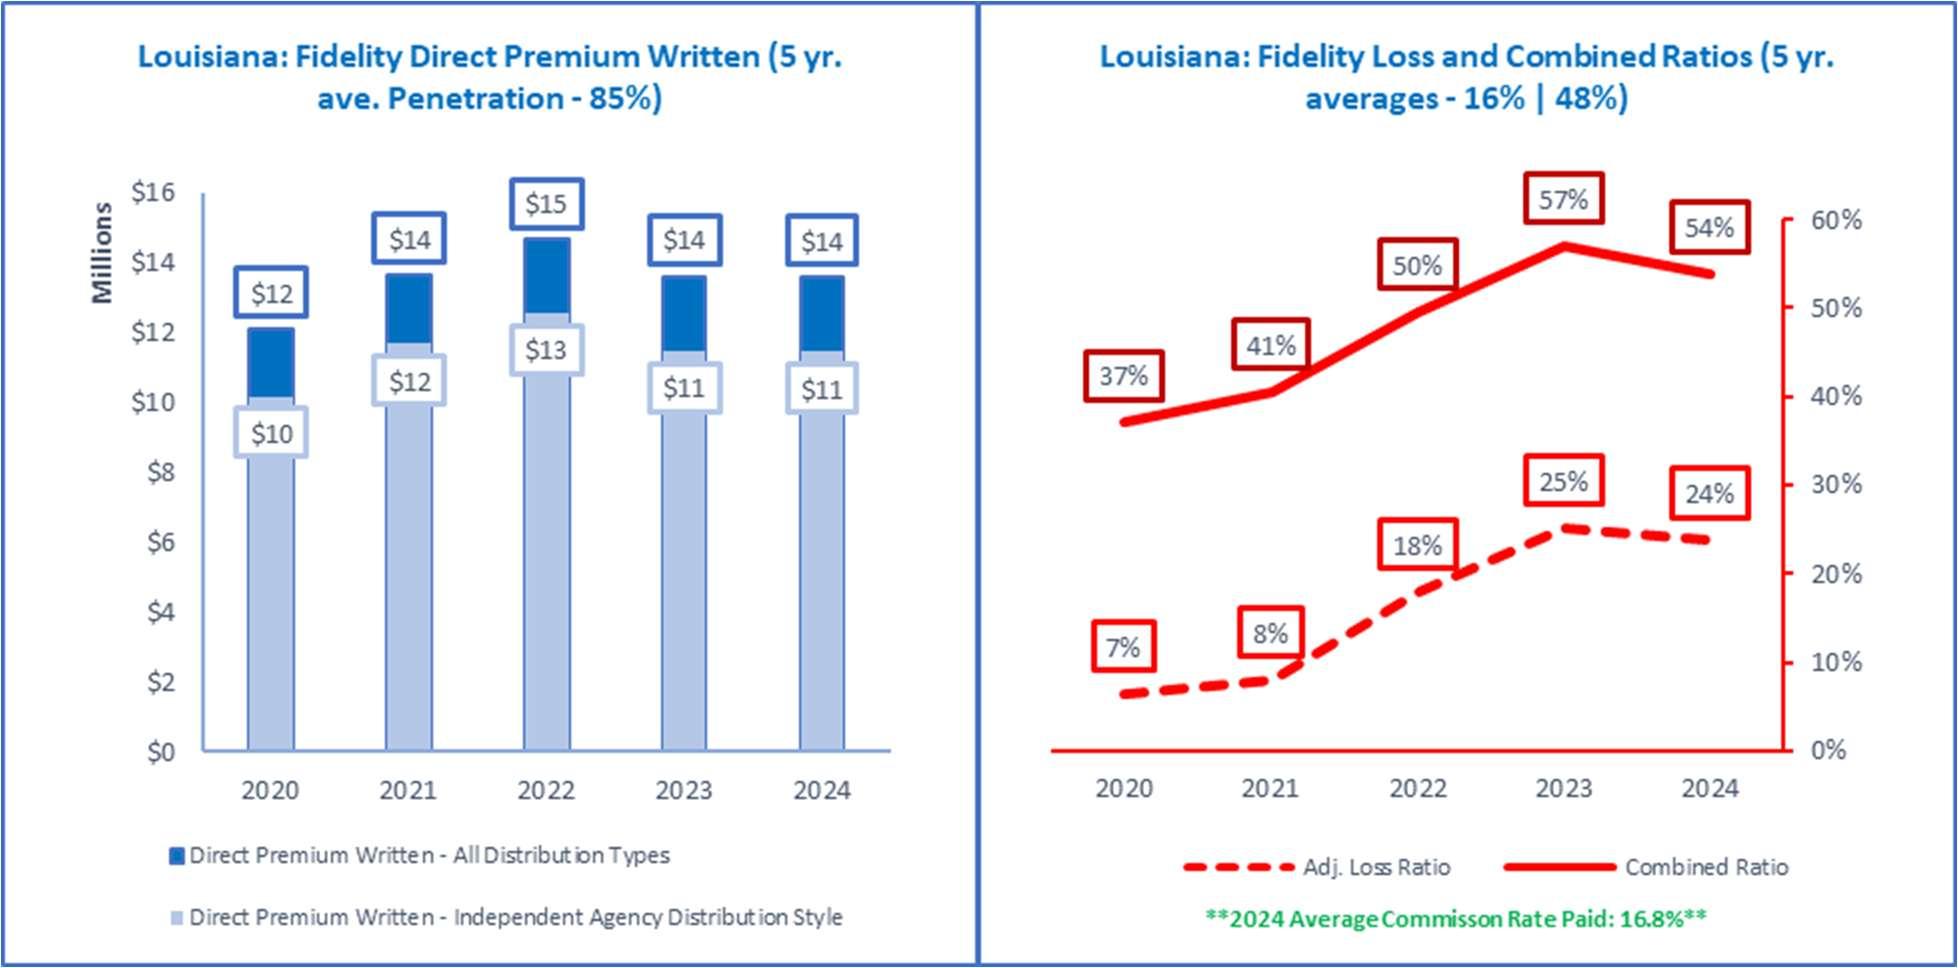
Source: © A.M. Best Company — used by permission. (Included in the above data are all P&C policies issued in Louisiana to cover dishonest acts of employees.
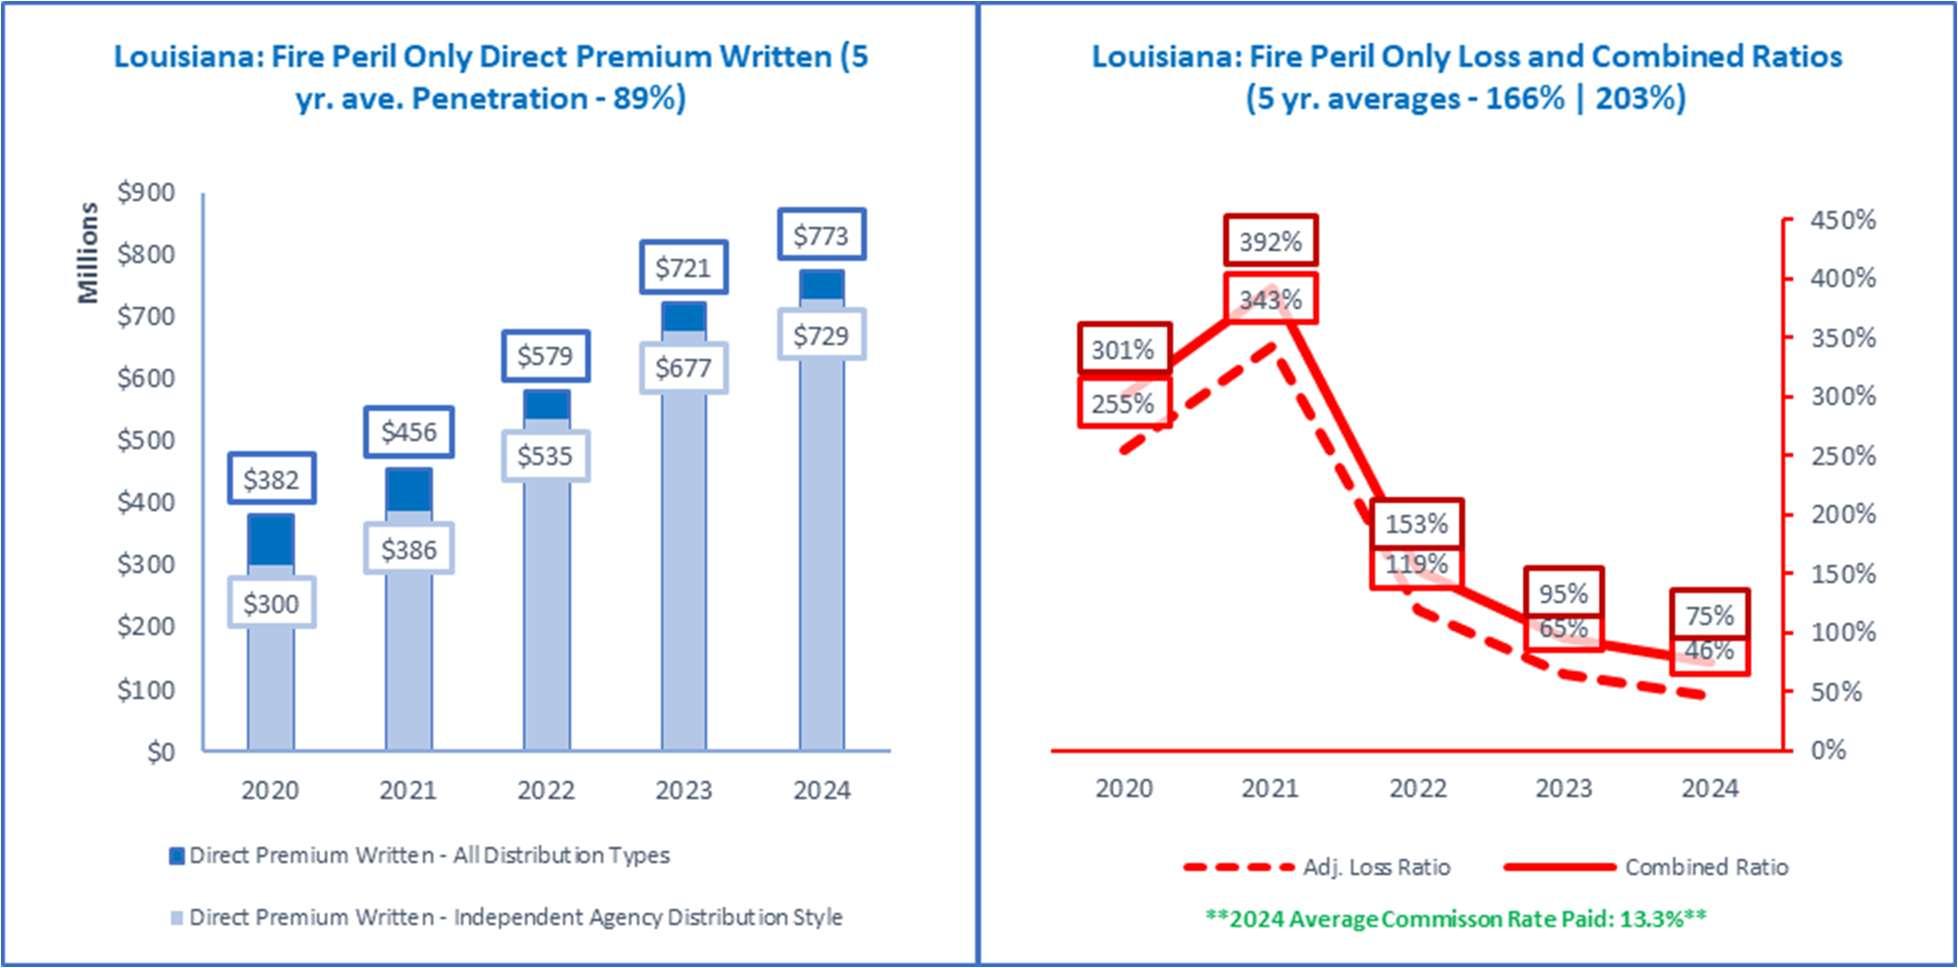
Source: © A.M. Best Company — used by permission. (Included in the above data are all P&C policies issued in Louisiana to cover fire or lightning loss to real or personal property. If premiums are combined in policies with other perils like windstorm, the premiums and losses are reported as they are allocated by insurers).
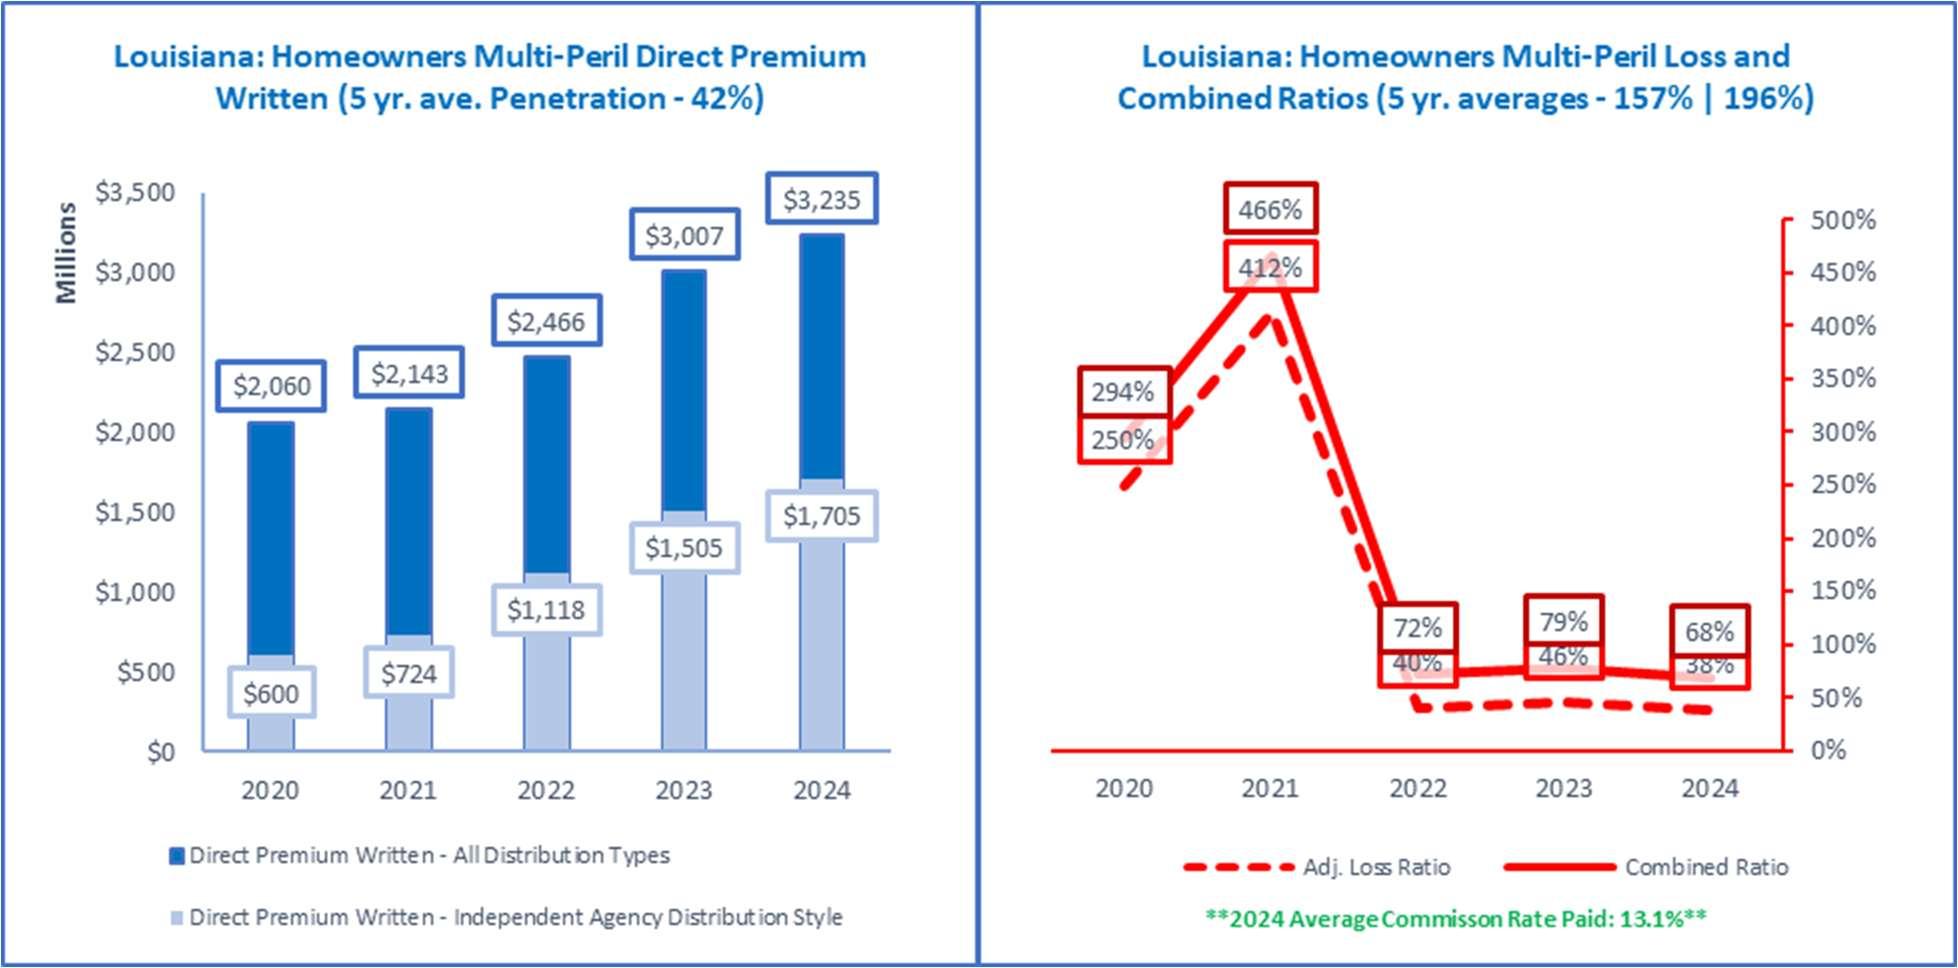
Source: © A.M. Best Company — used by permission. (Included in the above data are all P&C policies issued in Louisiana to cover liability, and real and personal property of homeowners, condo owners and renters).
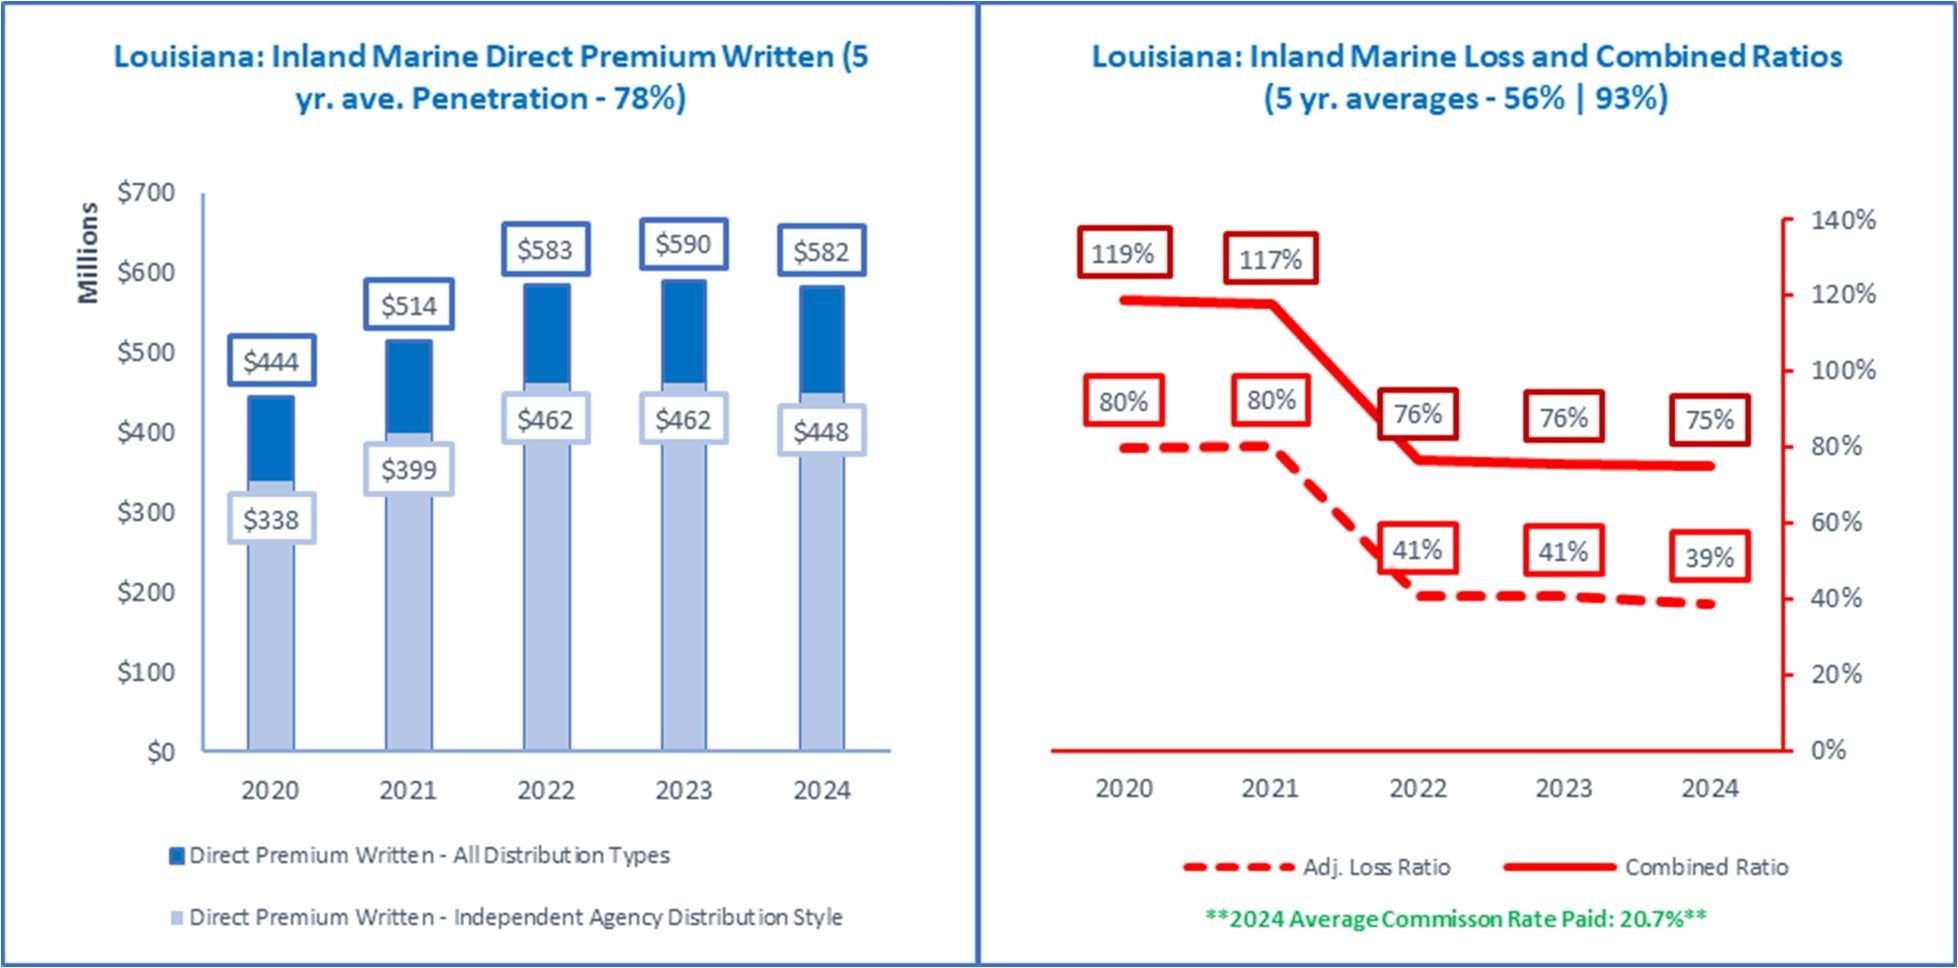
Source: © A.M. Best Company — used by permission. (Included in the above data are all P&C policies issued in Louisiana for a wide variety of risks including contractors equipment, other moveable property, pet insurance, event cancellation, travel insurance, watercraft and cash in transit.
N/A|N/A N/A N/A
N/A|N/A N/A N/A Top3MGA/WholesaleIndividualInsurers 1-yrDPW 1-yrLR|CR 1-yrChange%|Comm% Groupor"N/A" N/A
0%|0% N/A N/A N/A N/A N/A|N/A N/A N/A N/A N/A N/A|N/A N/A N/A
Top3Exclusive/CaptivePolicy-IssuingInsurers 1-yrDPW 1-yrLR|CR 1-yrChange%|Comm% Groupor"N/A" N/A $0 0%|0% N/A N/A N/A N/A N/A|N/A N/A N/A N/A N/A N/A|N/A N/A N/A
Top3DirectPolicy-IssuingInsurers 1-yrDPW 1-yrLR|CR 1-yrChange%|Comm% Groupor"N/A" N/A $0 0%|0% N/A N/A N/A N/A N/A|N/A N/A N/A N/A N/A N/A|N/A N/A N/A
Top3SurplusLinesIndividualInsurers 1-yrDPW 1-yrLR|CR 1-yrChange%|Comm% Groupor"N/A" N/A
0%|0% N/A N/A N/A N/A N/A|N/A N/A N/A N/A N/A N/A|N/A N/A N/A TopRRG 1-yrDPW 1-yrLR|CR 1-yrChange%|Comm% Groupor"N/A" N/A
0%|0% N/A N/A
Source: © A.M. Best Company — used by permission. (Included in the above data are all P&C policies issued in Louisiana to cover losses outside the U.S. where a line of business is not determined.)
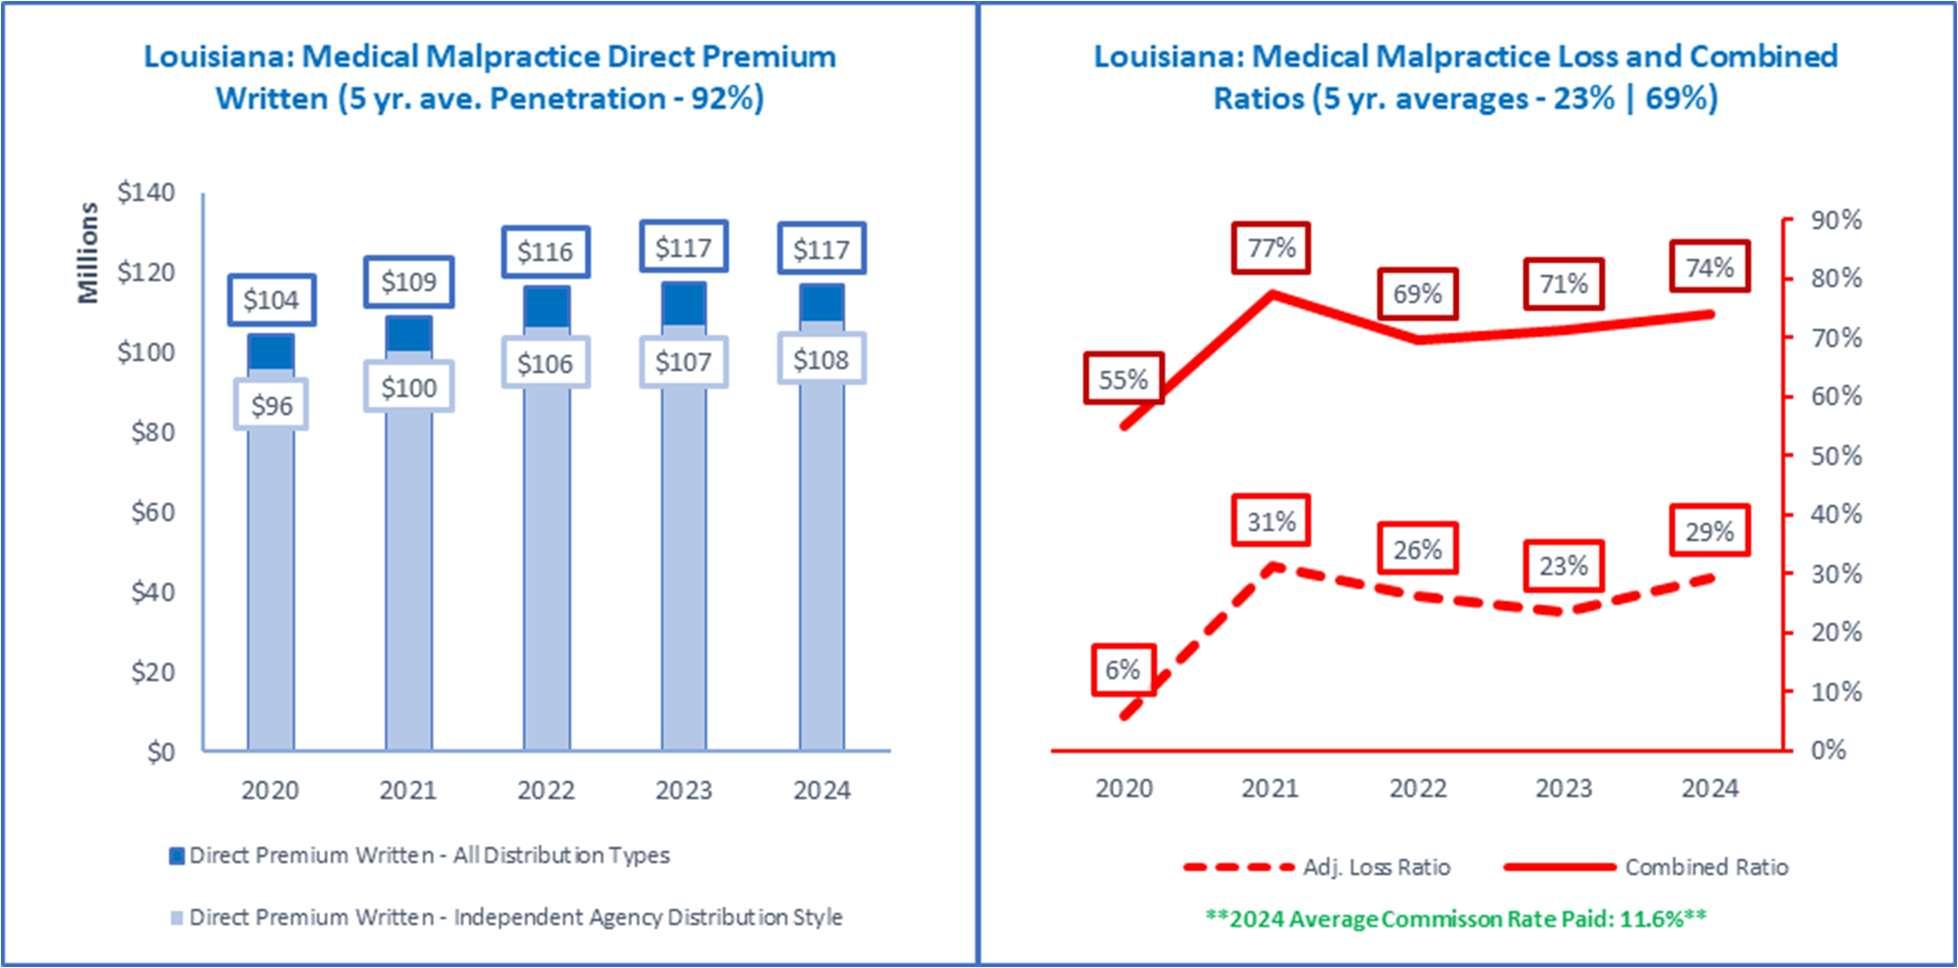
Source: © A.M. Best Company — used by permission. (Included in the above data are all P&C policies issued in Louisiana to cover liability losses of licensed healthcare providers).
Groupor"N/A" N/A
N/A
Groupor"N/A" N/A
N/A N/A N/A N/A N/A|N/A N/A N/A N/A N/A N/A|N/A N/A N/A
Groupor"N/A" N/A
0%|0% N/A N/A
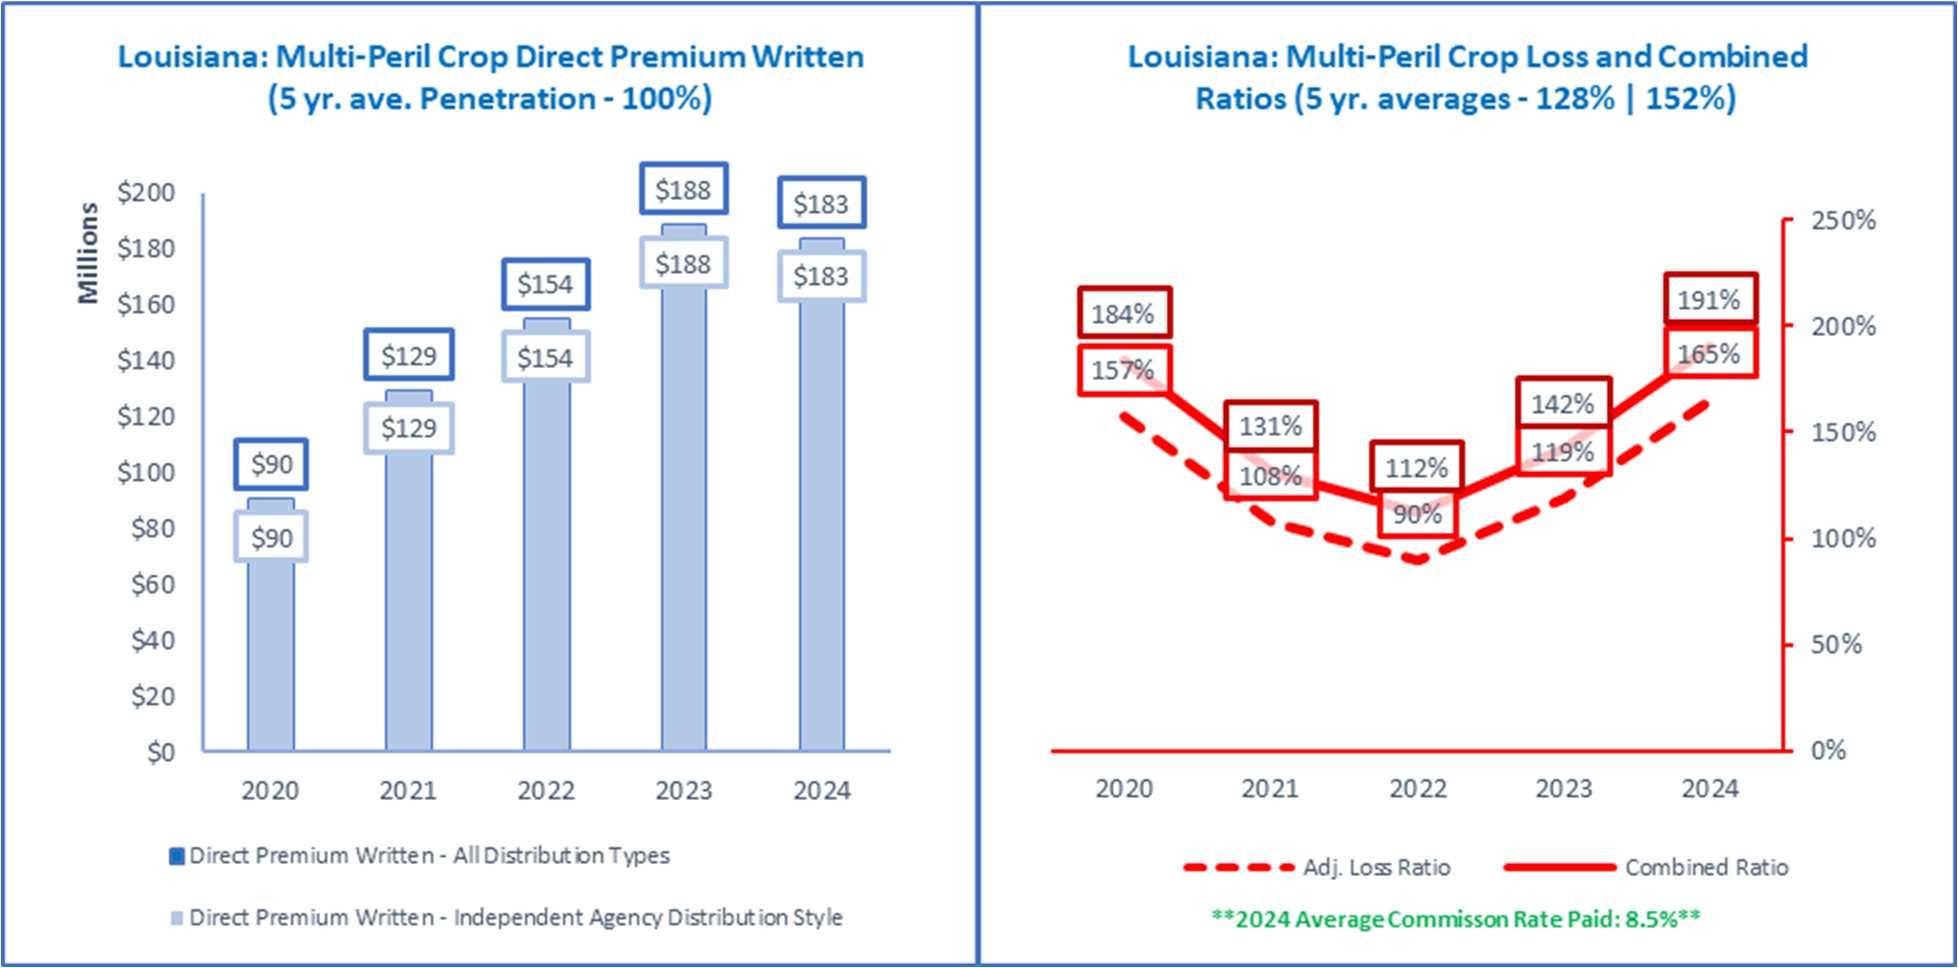
Source: © A.M. Best Company — used by permission. (Included in the above data are all P&C policies issued in Louisiana to cover losses that are subsidized or reinsured by the Federal Crop Insurance Corporation.)
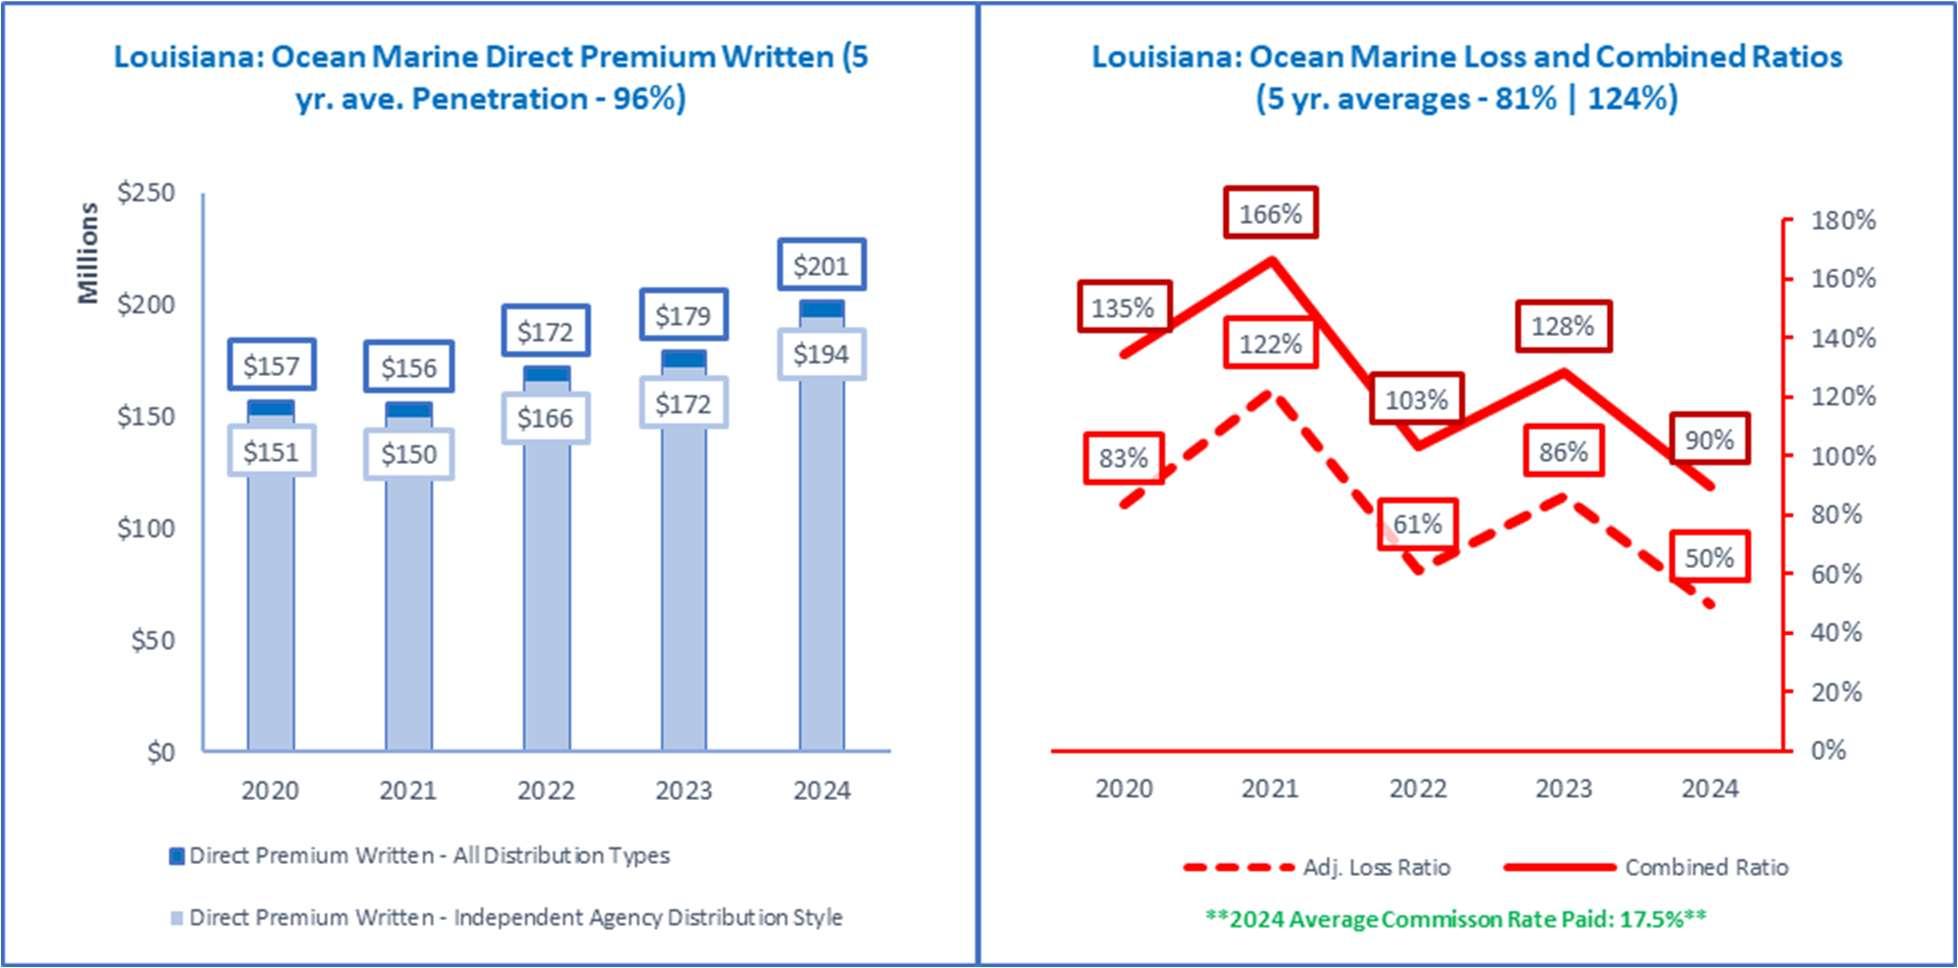
Source: © A.M. Best Company — used by permission. (Included in the above data are all P&C policies issued in Louisiana to cover losses resulting from transportation on ocean and inland waters).
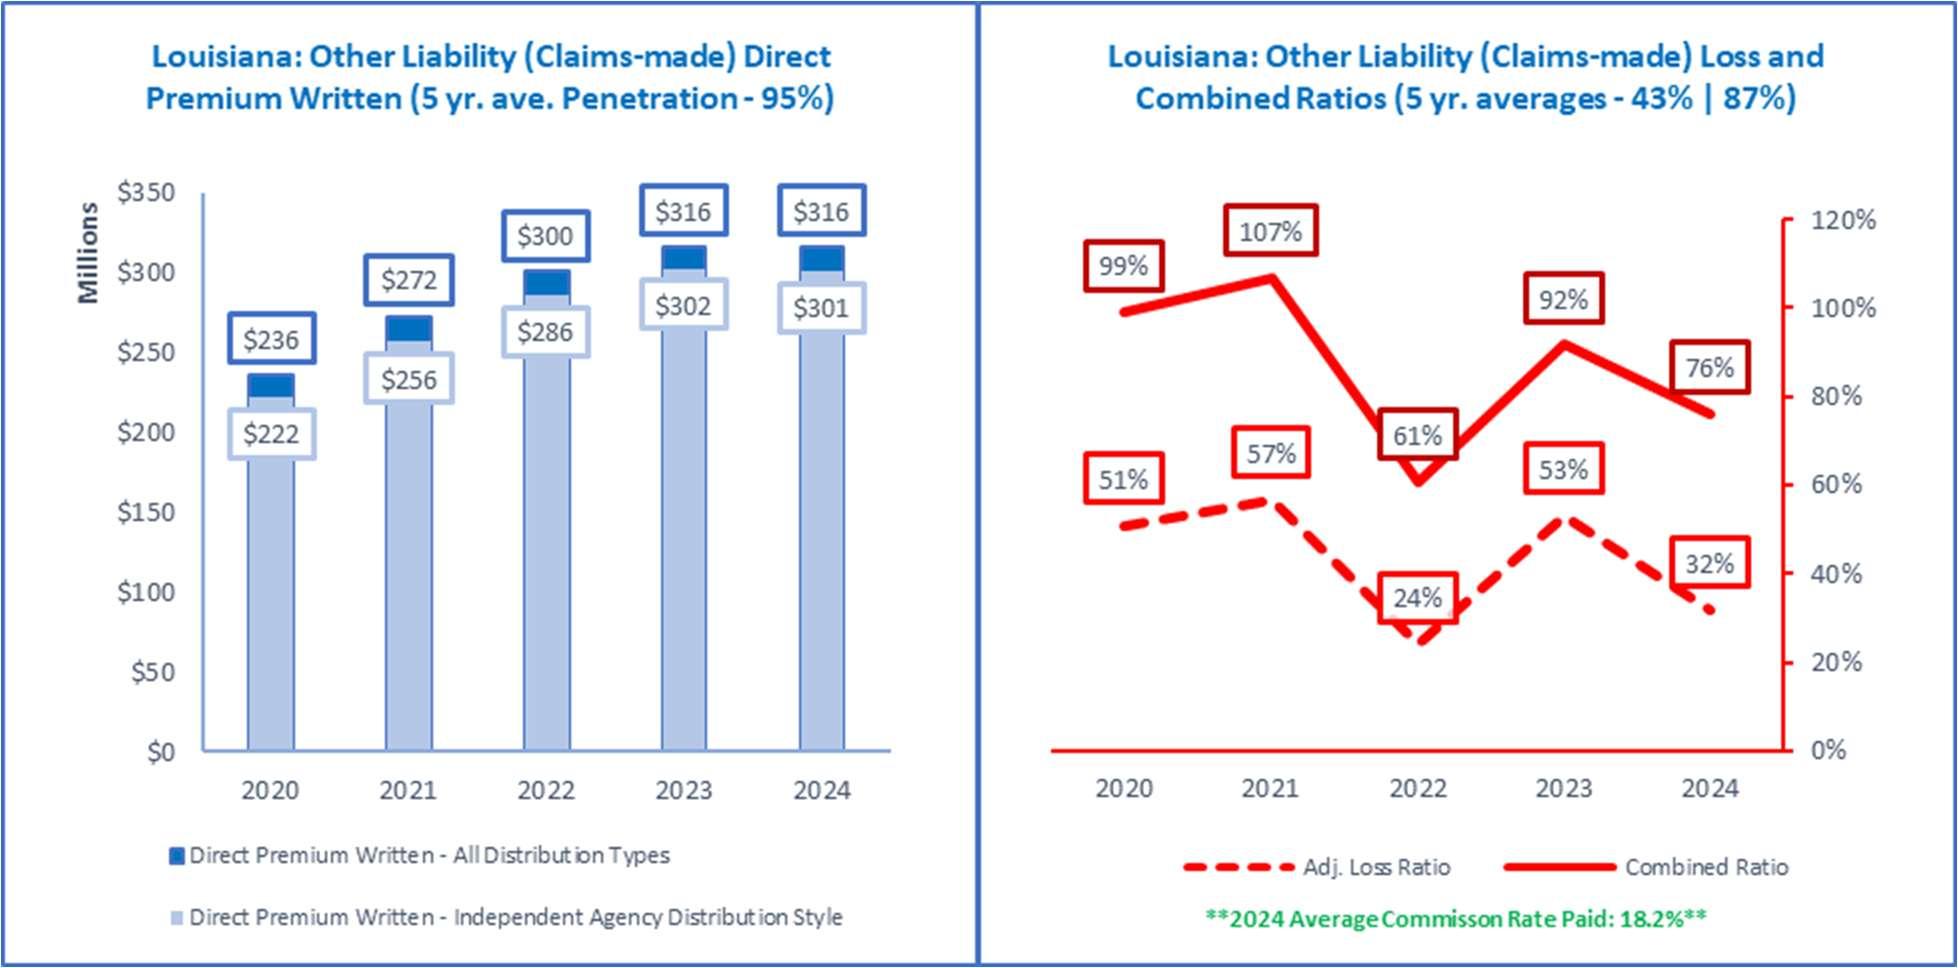
Source: © A.M. Best Company — used by permission. (Included in the above data are all P&C policies issued in Louisiana to cover legal liability losses liability losses from a wide variety of exposures that are issued on a claims-made basis. Common examples include errors & omissions, directors & officers, and Internet liability).
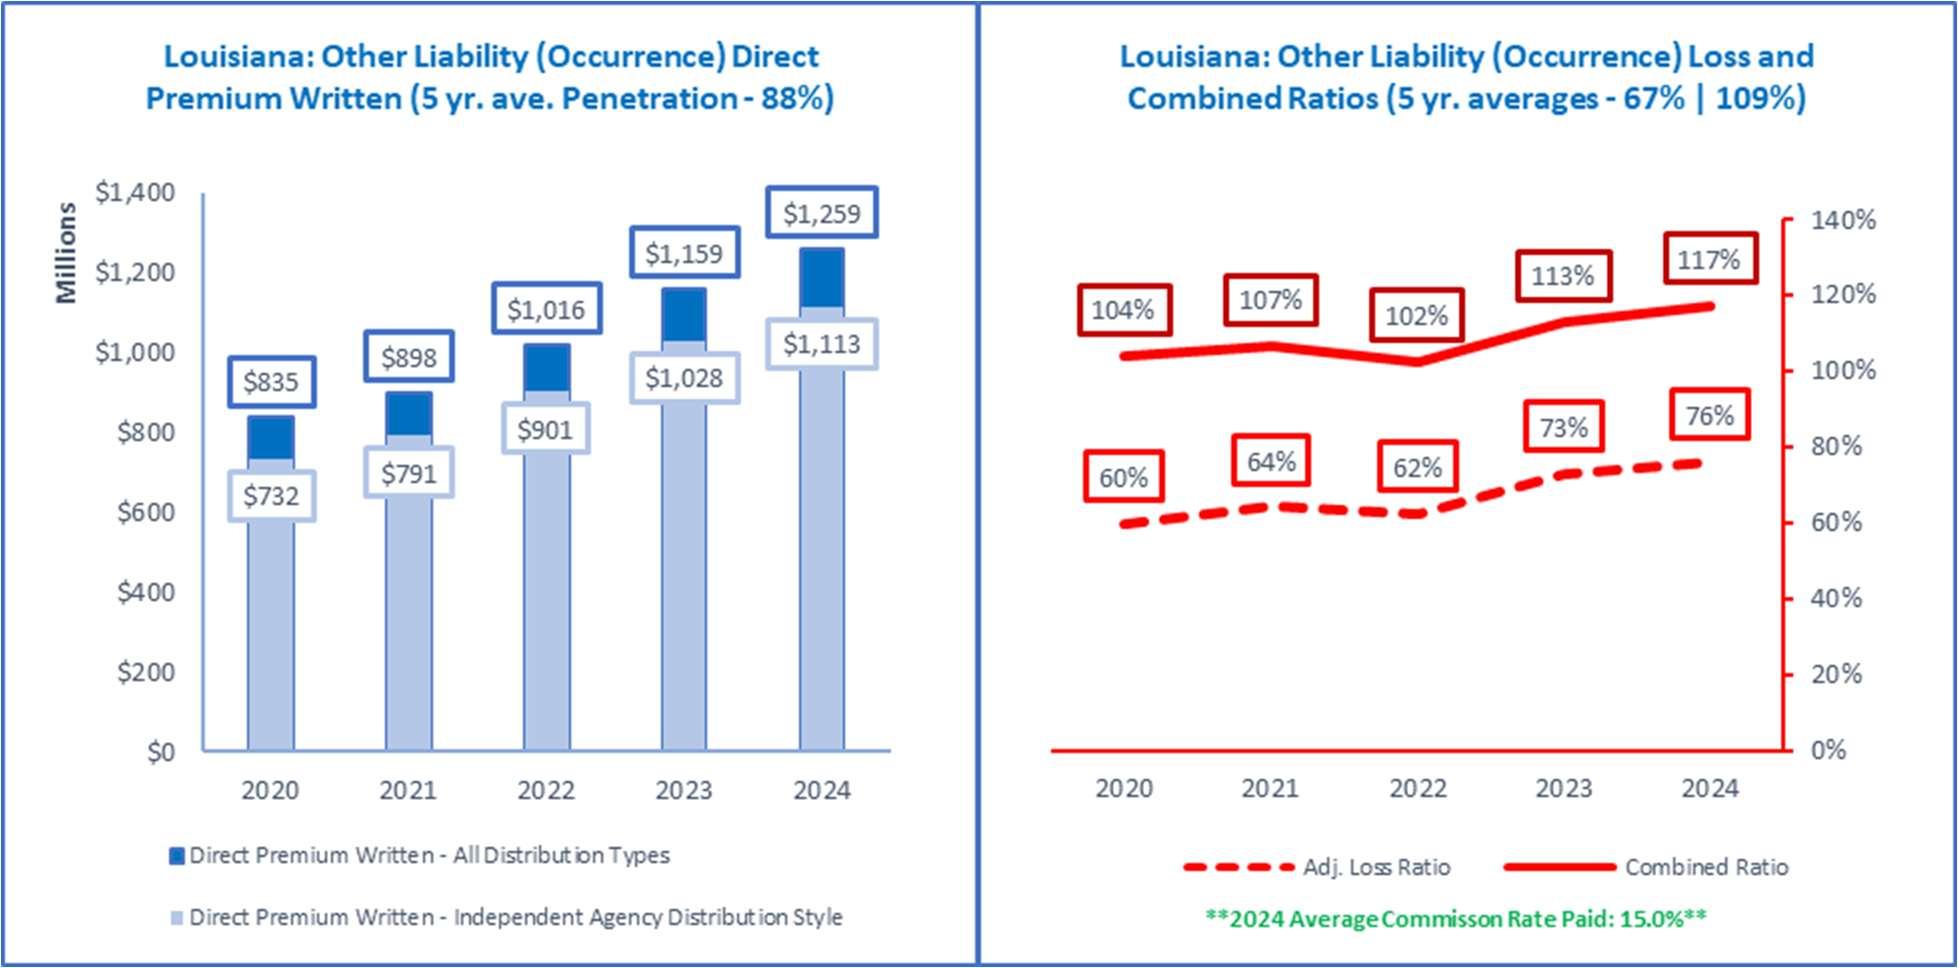
Source: © A.M. Best Company — used by permission. (Included in the above data are all P&C policies issued in Louisiana to cover legal liability losses liability losses from a wide variety of exposures that are issued on an occurrence basis. Examples include premises, completed operations, and umbrella.
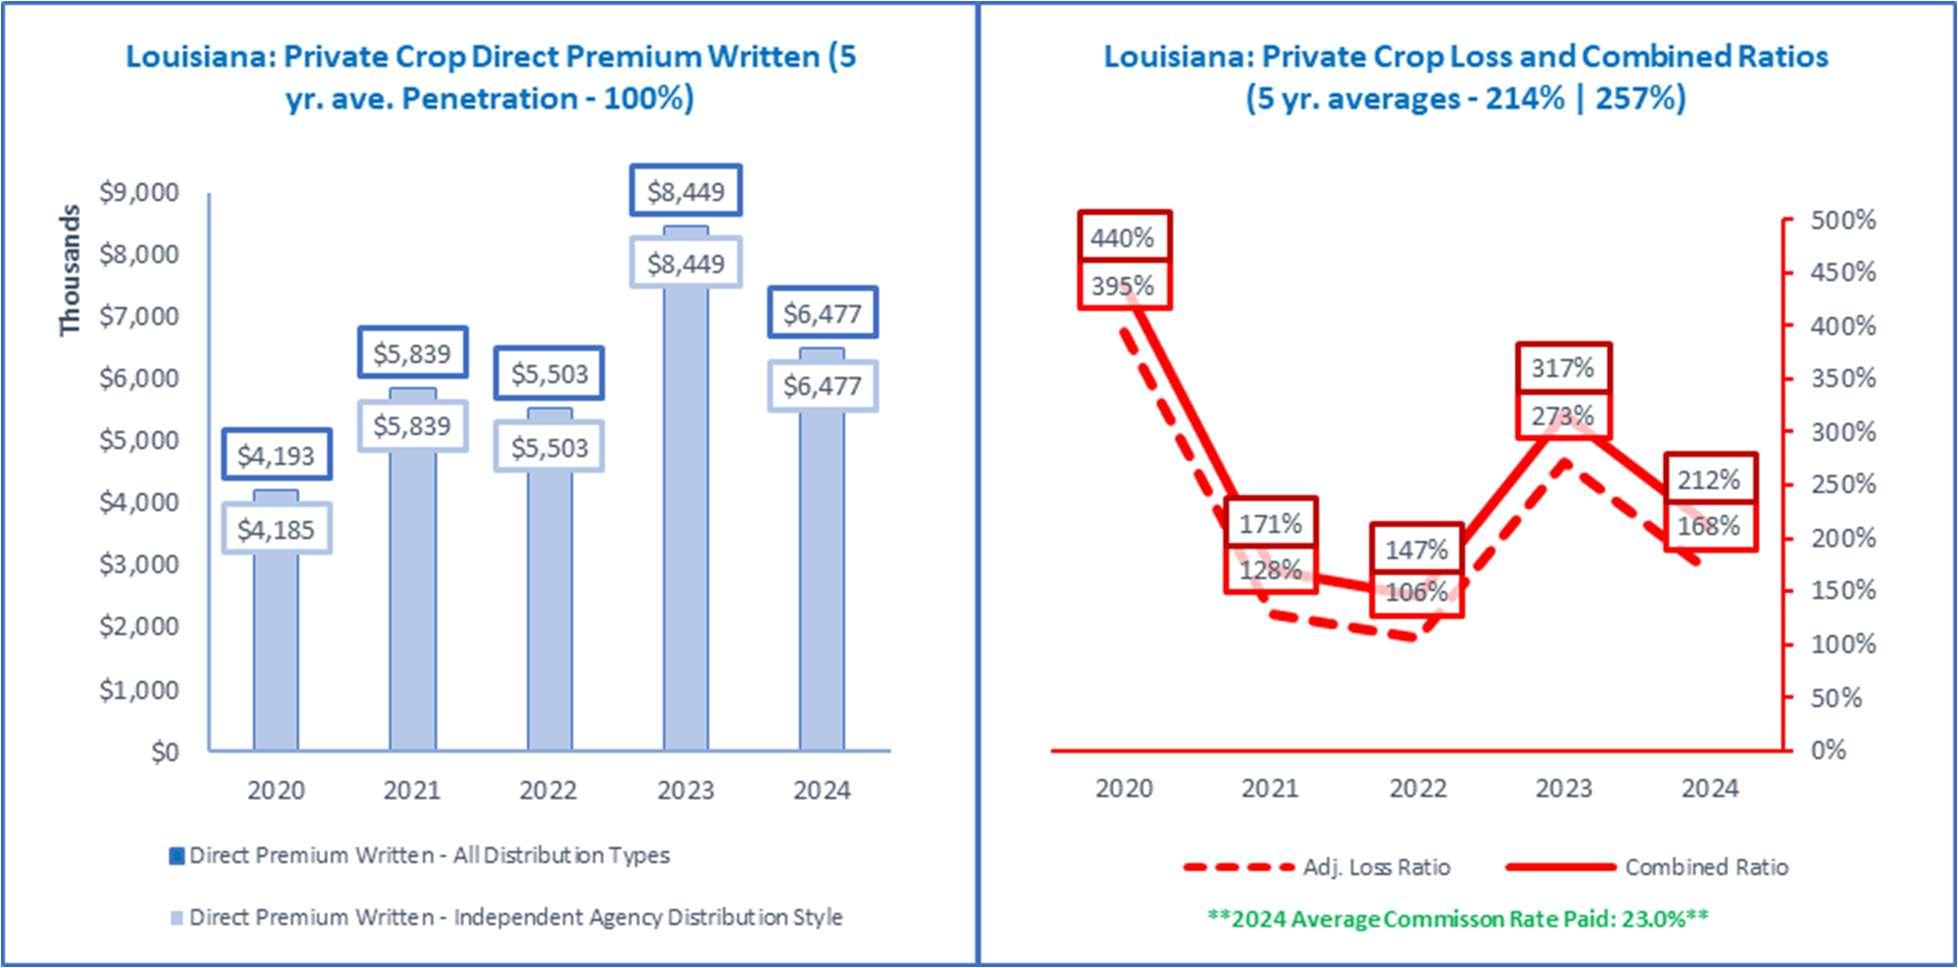
Source: © A.M. Best Company — used by permission. (Included in the above data are all P&C policies issued in Louisiana to cover crop hail and fire and other risks NOT subsidized or reinsured by the Federal Crop Insurance Corporation).
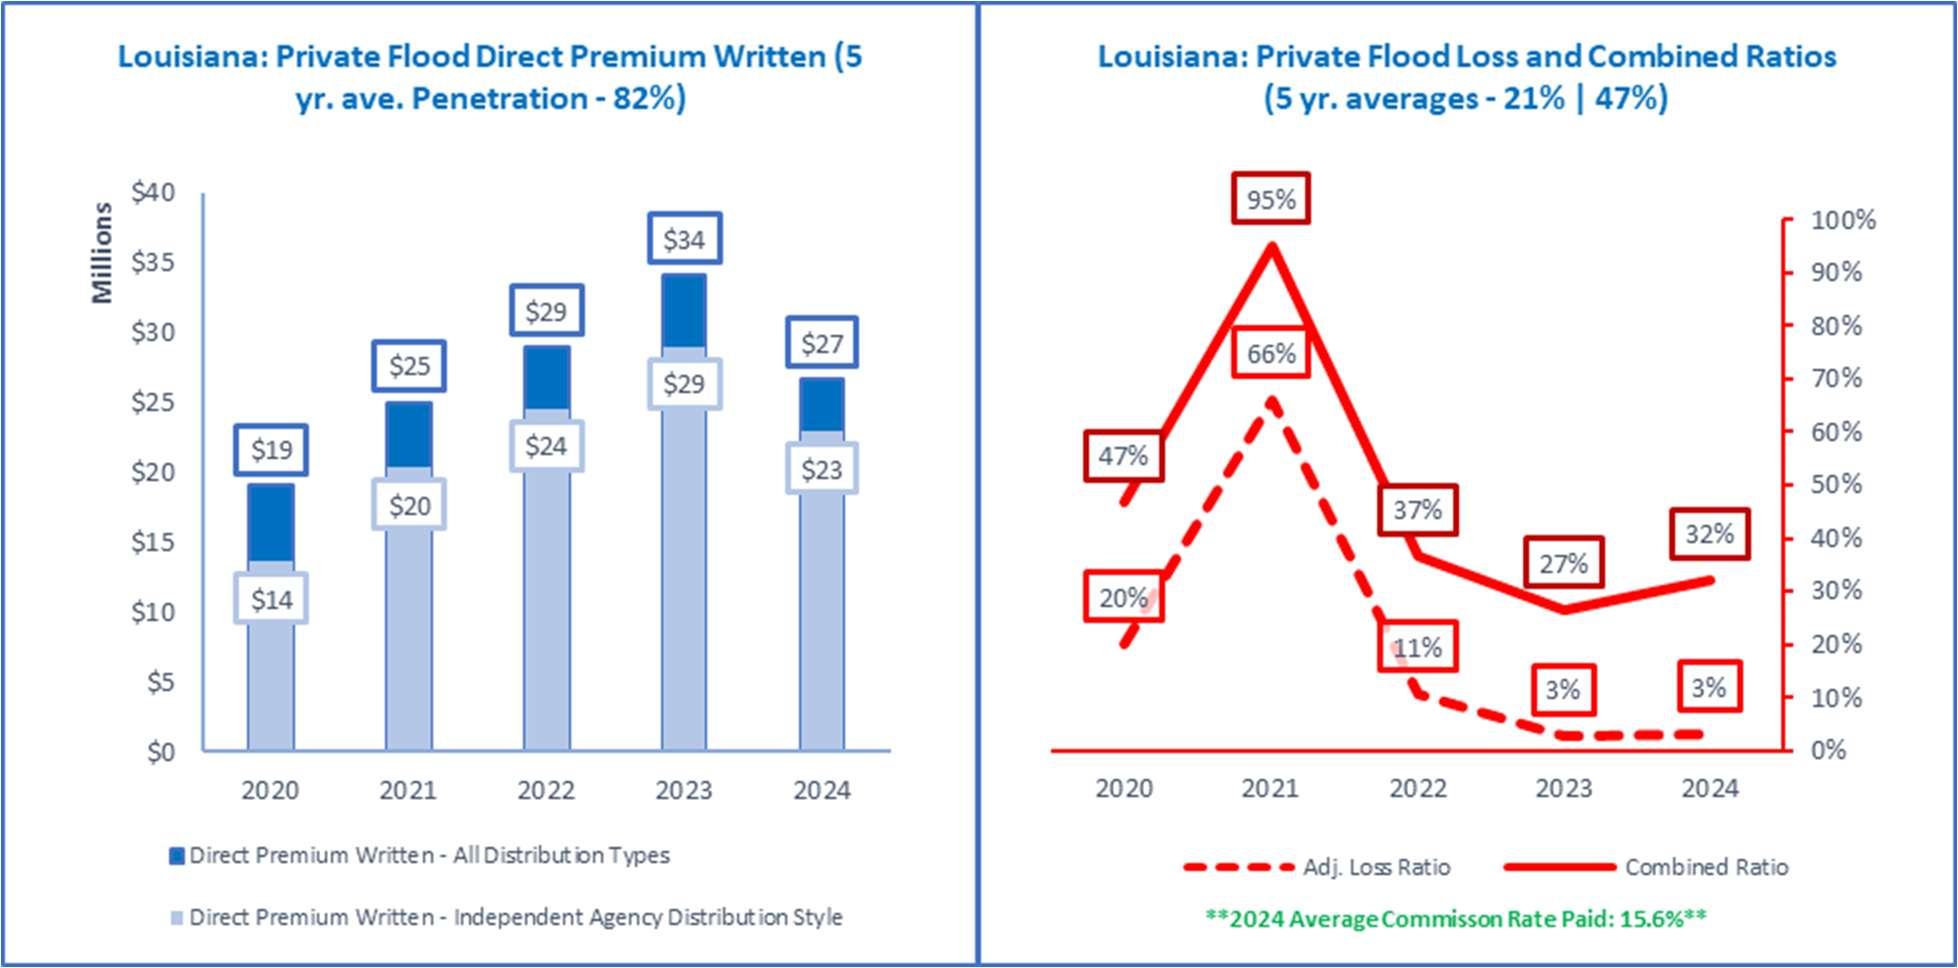
Source: © A.M. Best Company — used by permission. (Included in the above data are all P&C policies issued in Louisiana to cover flood and are NOT under the Federal Flood Insurance Program and its Write Your Own program).
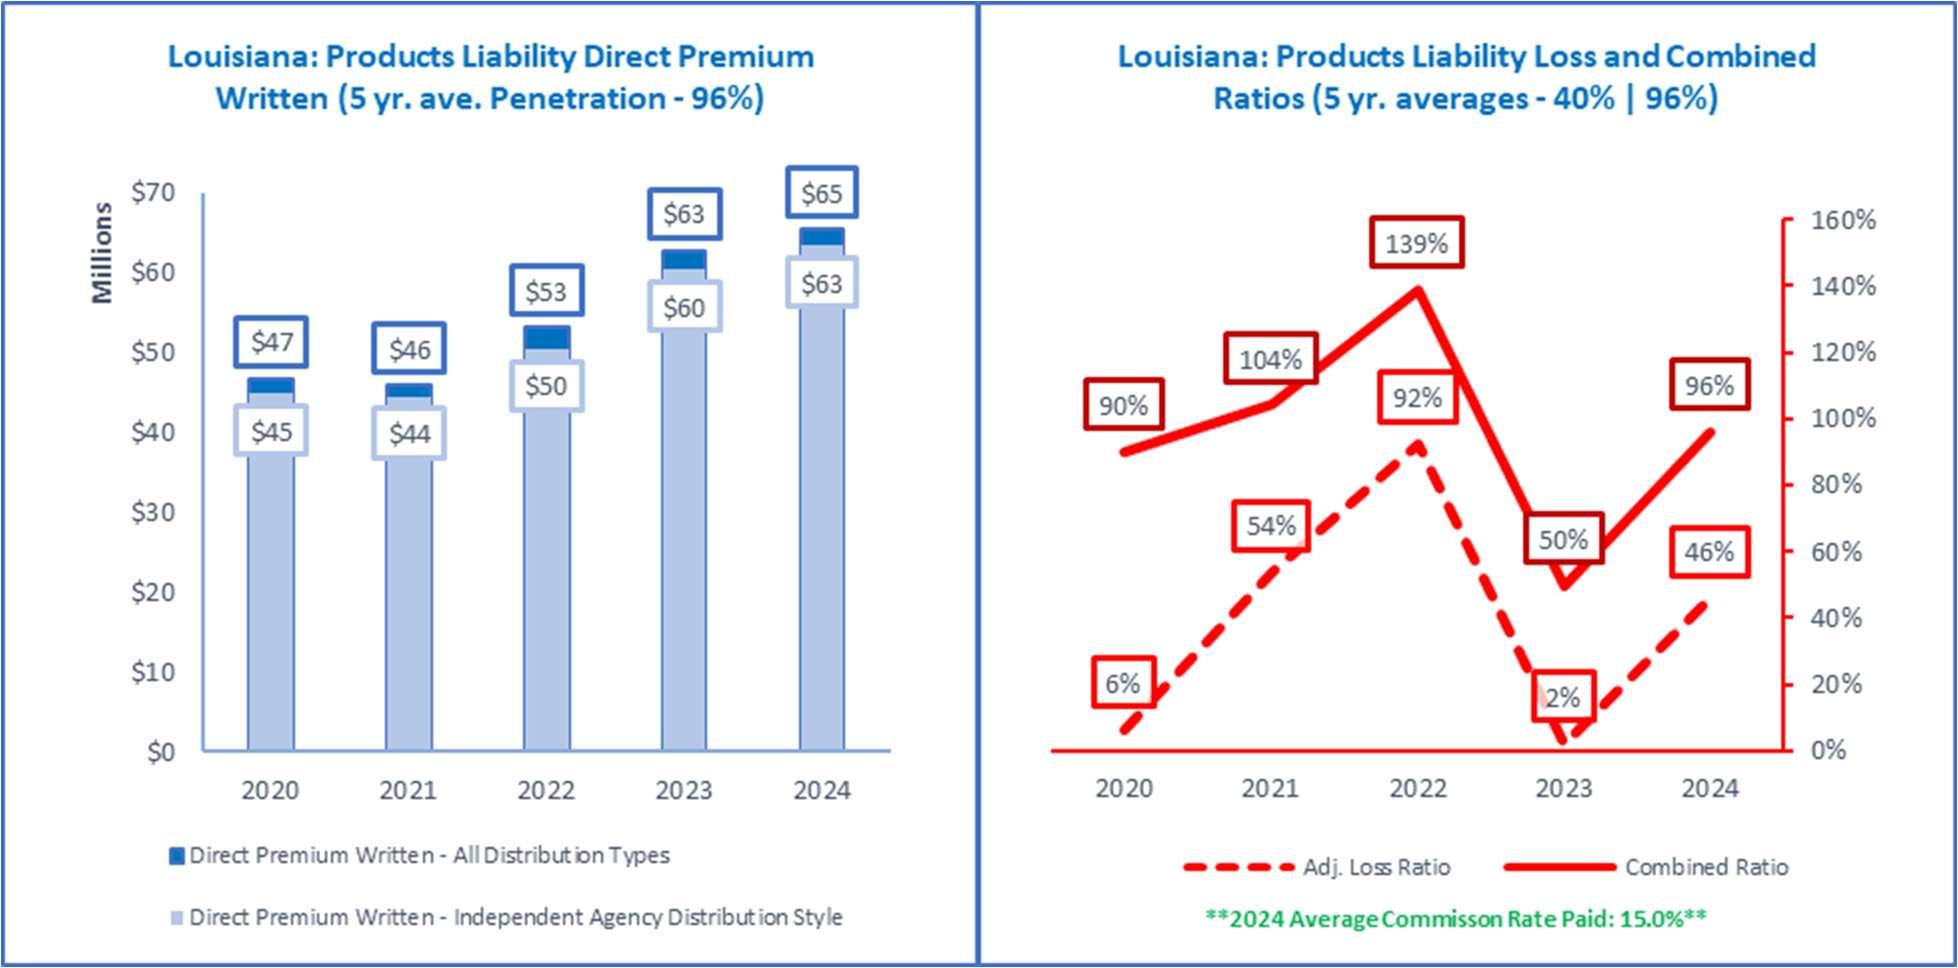
Source: © A.M. Best Company — used by permission. (Included in the above data are all P&C policies issued in Louisiana to cover liability from manufacturing or selling of defective products that cause injury or damage).
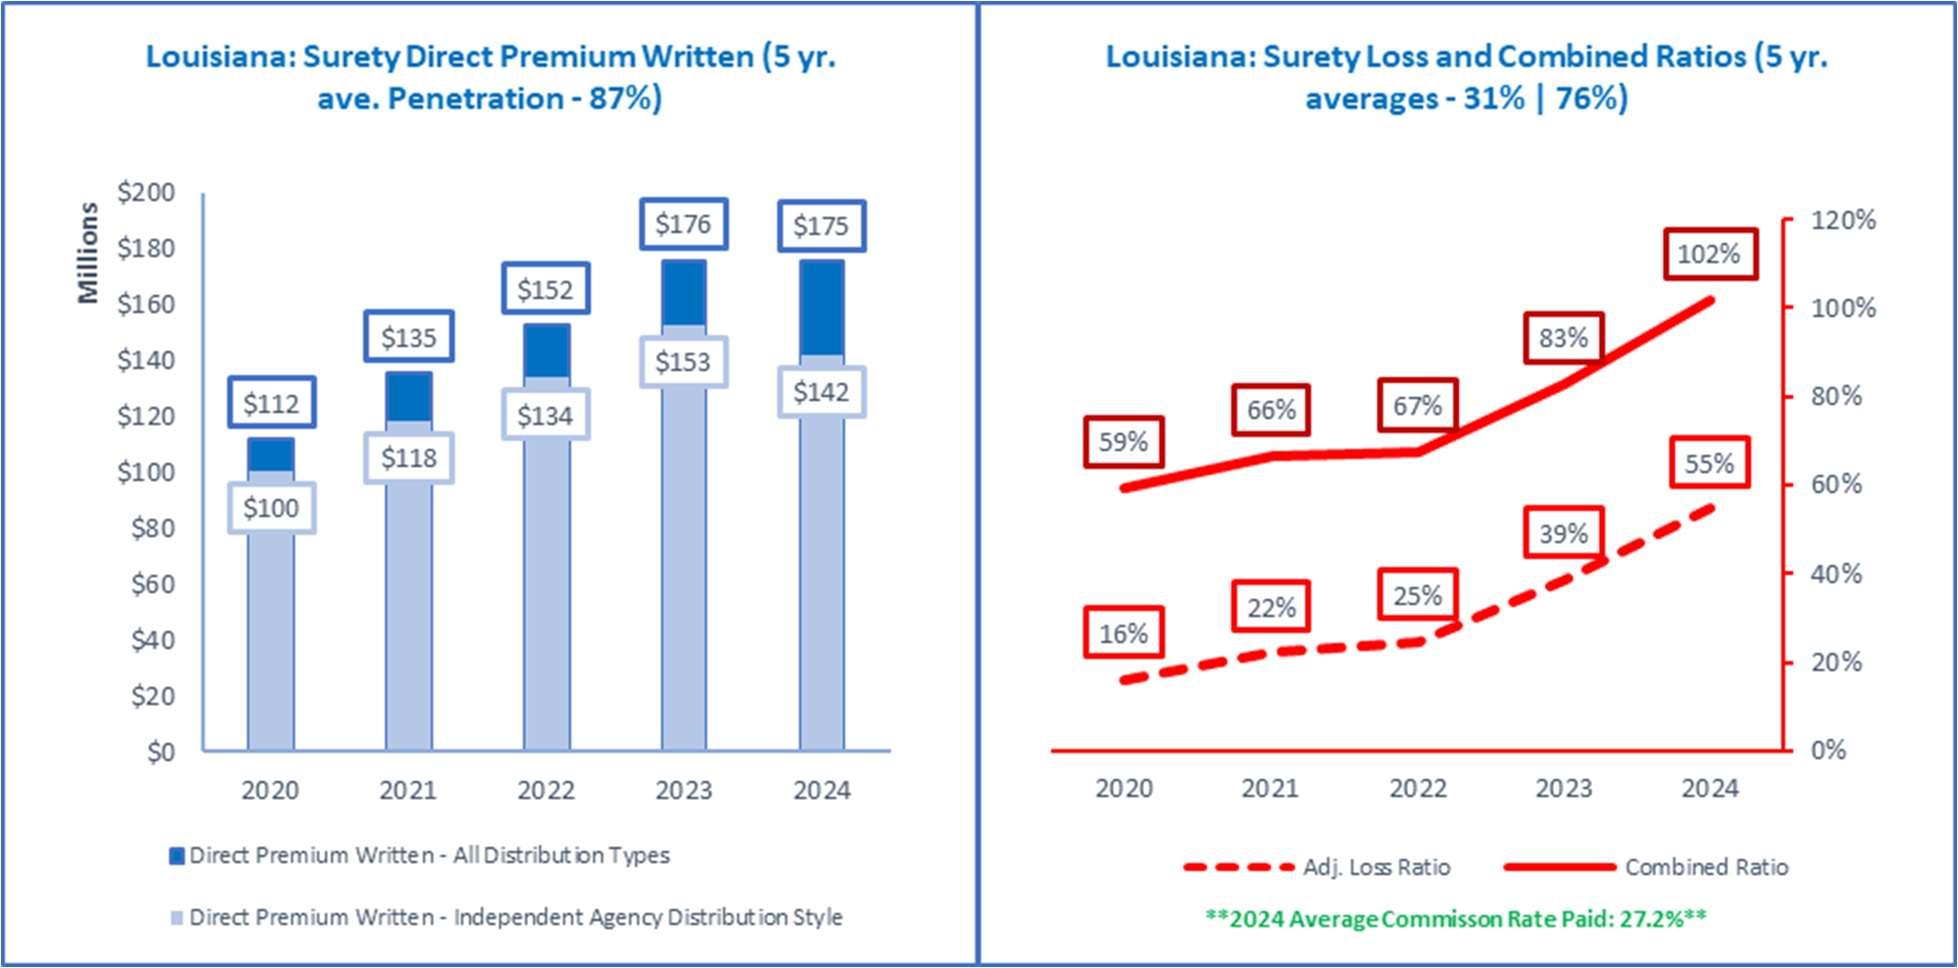
Source: © A.M. Best Company — used by permission. (Included in the above data are all P&C policies issued in Louisiana for 3party agreements covering the default of a principal on an obligation to an obligee).
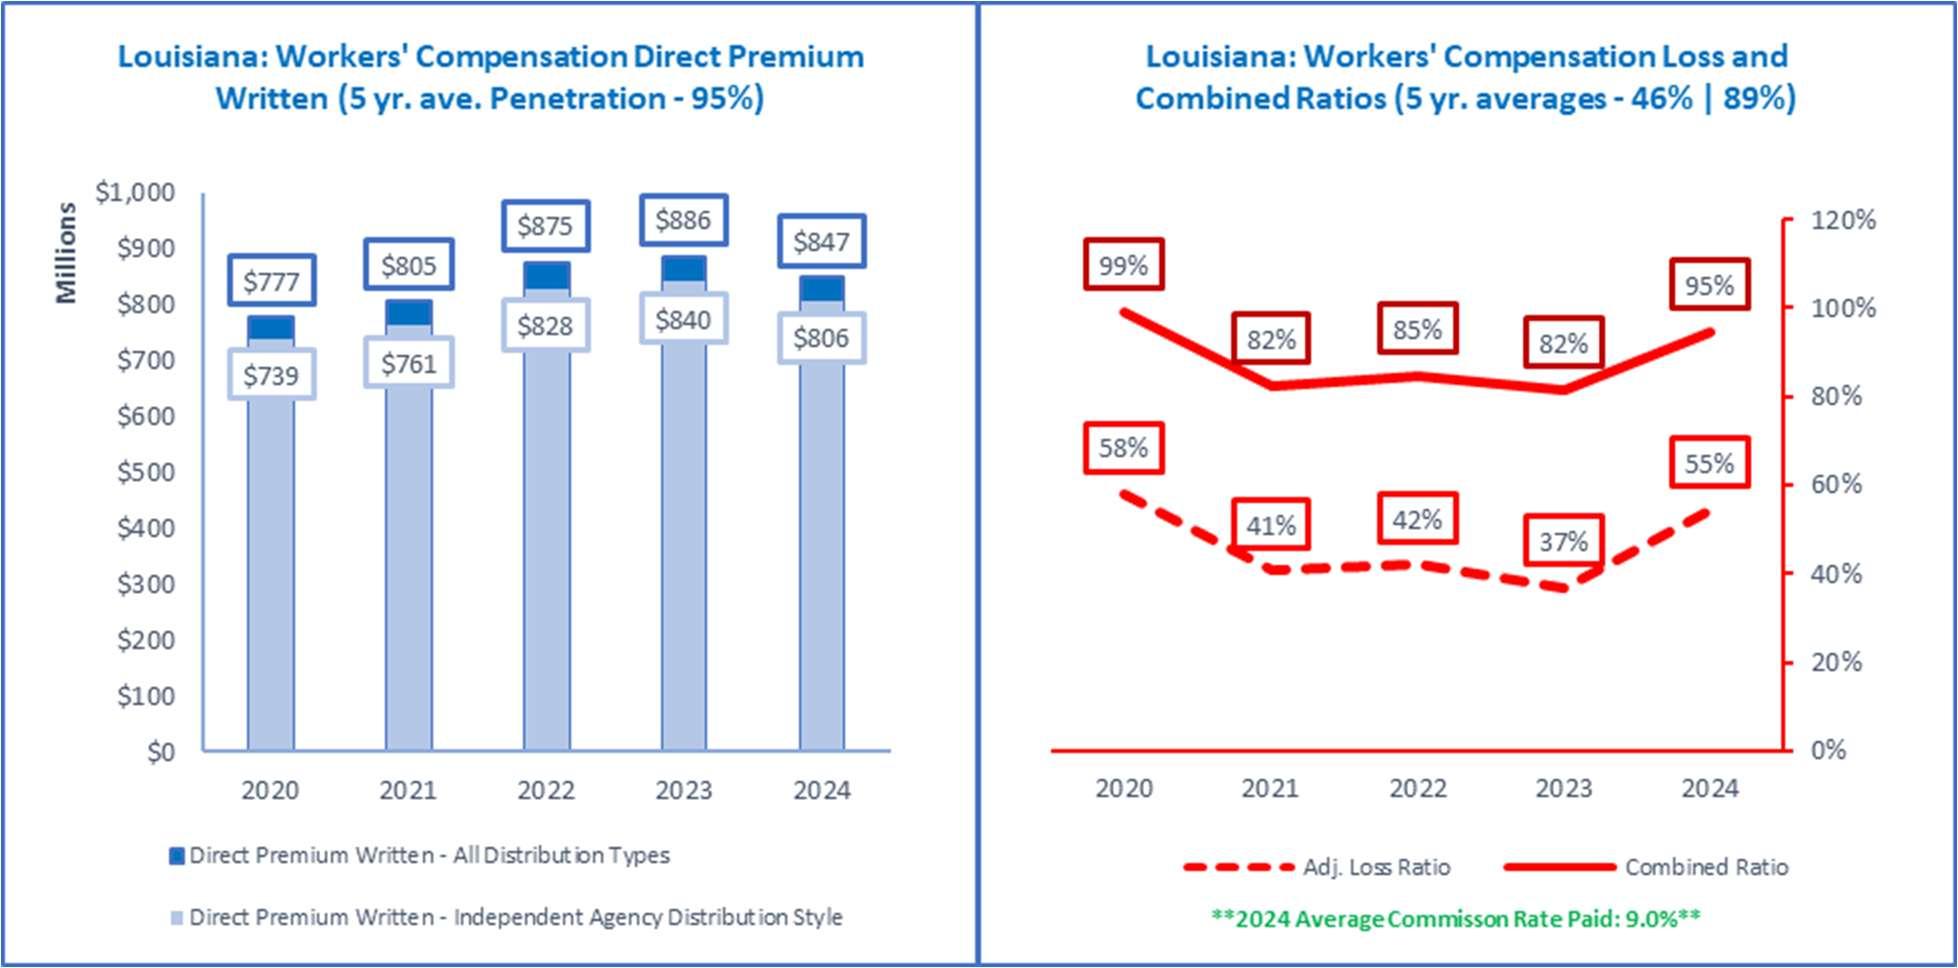
Source: © A.M. Best Company — used by permission. (Included in the above data are all P&C policies issued in Louisiana for liability for worker injuries under statutes or common law but not on excess basis. This includes Occurrence and Claims-Made policies).
This 2025 Louisiana Annual P&C Marketplace Summary classifies insurers into Distribution Styles based on the insurer’s reported Marketing Type(s). These Marketing Types are provided by A.M. Best as part of what is known as a “Galley Process.” Below are the various Marketing Types reported by insurers in 2024.
Affinity Group Marketing
Bank
Broker
Career Agent
Direct Response
Exclusive/Captive Agent
General Agent
Inactive
Independent Agency
Internet
Managing General Agent
Not Available
Other
Other Agency
Other Direct
Worksite Marketing
The approach used by this Summary is to take each insurer’s reported Marketing Type and classify data from that insurer into one of 6 Distribution Styles. Some insurer classifications are obvious and straight forward, others less so. When insurers report multiple Marketing Types, more weight is given to the Marketing Type listed first. About 10% of insurers have “Not Available” for their listed Marketing Type. However, these insurers represent less than 1% of all written premiums in 2024.
There are 6 Distribution Styles into which each insurer is classified in this Summary: (1) Pure Independent Agent (IA)/Broker, (2) Managing General Agent (MGA)/Wholesale, (3) IA-Mixed, (4) Exclusive/Captive, (5) Direct, and (6) Other. When general independent agent distribution figures are cited in this Summary, data for the first three Distribution Styles are combined. The remaining 3 Distribution Styles always stand on their own. Other industry analyses of distribution and penetration may vary, but generally the results are similar to the approach taken in this Summary.
By controlling the Distribution Style classification in this way, flexibility is attained in providing data that matches an independent agent’s view of the marketplace. It allows determination of approximate
penetrations of the Distribution Styles by Line of Business, and also the creation of lists of insurers by Line of Business for each Distribution Style. This is illustrated in the two tables below.
Featured in Table 10 below, 2024—Louisiana: All Lines of Business DPW by Distribution Style, is the Direct Premium Written (DPW) by Distribution Style in dollars, calculated based on the proprietary classification of insurers. The Direct Premium Written total of all 6 Distribution Styles combined are in the first column, followed by each of 6 Distribution Styles previously listed above. All 32 Lines of Business are included, but shown with asterisks are the 26 P&C Lines of Business focused on by independent agents (IA-Focused Lines). The sum of DPW for all 32 Lines is presented at the bottom of the table, followed by the sum of DPW for just the 26 IA-Focused Lines of Business.
(Direct Premium Written in Millions of Dollars)
Table 10 | Source: © A.M. Best Company — used by permission, and the Real Insurance Solutions Consulting proprietary classification of individual insurers, based on reported Marketing Types into Distribution Styles
Table 11 below, Top 10 Insurers by Distribution Style, illustrates this Summary’s approach to classifying Lines of Business data into the 6 Distribution Styles of: (1) Pure IA/Broker, (2) MGA/Wholesale, (3) IAMixed, (4) Exclusive/Captive, (5) Direct, and (6) Other. For Louisiana, the Top 10 insurers in each Distribution Style are listed, along with each insurer’s group, the individual insurer’s 2024 Direct Premium Written, and its listed Marketing Type, as reported by A.M. Best.
(Premium in Thousands)
Table 11 | Source: © A.M. Best Company —
The National Association of Insurance Commissioners (NAIC) provides the Official NAIC Annual Statement Instructions to insurers for completing their annual report, and especially for completing the “State’s Page,” formally referred to by NAIC as the Exhibit of Premiums and Losses (Statutory Page 14). Those instructions contain an expansive set of definitions pertaining to Property and Casualty Lines of Business.
Table 12 below, NAIC Annual Statement Instructions: Summarized Definitions of Property and Casualty Lines of Business summarizes and distills those NAIC Line of Business definitions into a more concise presentation for this Summary, for easier reader reference and use.
Note: The Fire and Allied Lines Line of Business has sub-lines of business that many Independent Agents are familiar with. The breakouts for the broader Fire & Allied Lines are significant, and the sub-lines are shown last, out of alphabetical order.
NAIC Annual Statement Instructions: Summarized Definitions of Property and Casualty Lines of Business
Line-ofBusiness (L.O.B.or Combination) NAICLine Numbers Definition Aggregate Write-ins Line34 Explainedcoveragewritteninthatdonotfitelsewhere.
Aircraft(all perils) Line22 Coverageforaircraft(hull)andtheircontents;aircraftowners’andaircraft manufacturers’liabilitytopassengers,airportsandotherthirdparties.
AlliedLines Line2 Extendedcoverage;glass;tornado,windstormandhail;sprinklerandwaterdamage; explosion,riotandcivilcommotion;rain;anddamagefromaircraftandvehicle.
All Commercial Auto Lines
19.3+19.4+21.1
AllPrivate Passenger Lines
19.1+19.2+21.1
CommercialAutoNo-Fault(PersonalInjuryProtection).OtherCommercialAuto PassengerLiability(Include-BI,PD,UMandUIM).CommercialAutoPhysicalDamage.
PrivatePassengerAutoNo-Fault(PersonalInjuryProtection).OtherPrivatePassenger AutoLiability(Include-BI/PD/UMandUIM).PrivatePassengerAutoPhysicalDamage. Boiler& Machinery Line27 Coverageforthefailureofboilers,machineryandelectricalequipment.Benefitsinclude: (i)propertyoftheinsuredthathasbeendirectlydamagedbytheaccident.(ii)Costsof temporaryrepairsandexpeditingexpenses.(iii)Liabilityfordamagetothepropertyof others.
Burglary& Theft Line26
Commercial MultiplePeril Line5
Credit Line28
Coverageforpropertytakenordestroyedbybreakingandenteringtheinsured’s premises,burglaryortheft,forgeryorcounterfeiting,fraud,kidnapandransom,andoffpremisesexposure.
Acontractforacommercialenterprisethatpackagestwoormoreinsurancecoverages protectinganenterprisefromvariouspropertyandliabilityriskexposures.Frequently includesfire,alliedlines,variousothercoverages(e.g.,differenceinconditions)and liabilitycoverage(suchcoverageswouldbeincludedinotherannualstatementlines,if writtenindividually).Includemulti-perilpolicies(otherthanfarmowners,homeowners andautomobilepolicies)thatincludecoverageforliabilityotherthanauto.(Builders’ RiskPolicies,Businessowners,CommercialPackagePolicies,ManufacturersOutput Policies,e-CommerceandDifference-in-Conditions).
Coveragepurchasedbyconsumers,manufacturers,merchants,educationalinstitutions orotherprovidersofgoodsandservicesextendingcredit,forindemnificationoflosses ordamagesresultingfromthenonpaymentofdebtsowedto/fromthemforgoodsor servicesprovidedinthenormalcourseoftheirbusiness.
Excess Workers’ Compensation
Line17.3
Farmowners Multiperil Line4
Fidelity Line23
Financial Guaranty Line10
Fire Lines1
Homeowners Multiperil Line3
InlandMarine Line9
Indemnificationcoverageprovidedtoself-insuredemployersonanexcessoflossbasis.
Apackagepolicyforfarmingandranchingrisks,similartoahomeownerspolicy,thathas beenadoptedforfarmsandranchesandincludesbothpropertyandliabilitycoverages forpersonalandbusinesslosses.Coveragesincludefarmdwellingsandtheircontents, barns,stables,otherfarmstructuresandfarminlandmarine,suchasmobileequipment andlivestock.Acommercialpackagepolicyforfarmingandranchingrisksthatincludes bothpropertyandliabilitycoverage.Coverageincludesbarns,stables,otherfarm structuresandfarminlandmarine,suchasmobileequipmentandlivestock.
Abondcoveringanemployer’slossresultingfromanemployee’sdishonestact(e.g.,loss ofcash,securities,valuables,etc.)
Asuretybond,insurancepolicy,orwhenissuedbyaninsurer,anindemnitycontractand anyguarantysimilartotheforegoingtypes,underwhichlossispayableuponproofof occurrenceoffinanciallosstoaninsuredclaimant,obligeeorindemniteeasaresultof failuretoperformafinancialobligation(seeFinancialGuarantyInsuranceGuideline (#1626)).
Coverageprotectingtheinsuredagainstthelosstorealorpersonalpropertyfrom damagecausedbytheperiloffireorlightning,includingbusinessinterruption,lossof rents,etc.
Apackagepolicycombiningbroadpropertycoverageforthepersonalpropertyand/or structurewithbroadpersonalliabilitycoverage.Coverageapplicabletothedwelling, appurtenantstructures,unscheduledpersonalpropertyandadditionallivingexpense aretypical.Includesmobilehomesatafixedlocation.(AlternativeWorkers’ Compensation,Employers’LiabilityandStandardWorkers’Compensation).
Coverageforpropertythatmaybeintransit,heldbyabailee,atafixedlocation,a movablegoodthatisoftenatdifferentlocations(e.g.,off-roadconstructionequipment) orscheduledproperty(e.g.,HomeownersPersonalPropertyFloater),includingitems suchasliveanimals,propertywithantiqueorcollector’svalue,etc.Thislinealso includesinstrumentalitiesoftransportationandcommunication,suchasbridges, tunnels,piers,wharves,docks,pipelines,powerandphonelines,andradioand televisiontowers.(AnimalMortality,EDPPolicies,PetInsurancePlans,Communication Equipment,EventCancellation,TravelCoverage,VehicleExcessWaiver,Boatowners, OtherCommercialInlandMarine,OtherPersonalMarineandCashandCashinTransit Insurance).
International Line-29
Medical Professional Liability Line11
Mortgage Guaranty Line6
OceanMarine Line8
OtherLiability (Claims-made)
OtherLiability (Occurrence)
Line17.2
Line17.1
IncludesallbusinesstransactedoutsidetheU.S.anditsterritoriesandpossessions wheretheappropriateLineofBusinessisnotdeterminable
Insurancecoverageprotectingalicensedhealthcareproviderorhealthcarefacility againstlegalliabilityresultingfromthedeathorinjuryofanypersonduetothe insured’smisconduct,negligence,orincompetenceinrenderingprofessionalservices. MedicalProfessionalLiabilityisalsoknownasMedicalMalpractice.
Insurancethatindemnifiesalenderfromlossifaborrowerfailstomeetrequired mortgagepayments.
Coverageforoceanandinlandwatertransportationexposures;goodsorcargoes;ships orhulls;earnings;andliability.
Sameas17.1butonaClaims-MadeBasis.Thesepoliciescoverinsuredeventsthatare reported(asdefinedinthepolicy)withintheeffectivedatesofthepolicy,subjectto retroactivedatesandextendedreportingperiodswhenapplicable.
OccurrenceBased:Thesepoliciescoverinsuredeventsthatoccurwithintheeffective datesofthepolicy,regardlessofwhentheyarereportedtothereportingentity. Insurancecoverageprotectingtheinsuredagainstlegalliabilityresultingfrom negligence,carelessnessorafailuretoact,causingpropertydamageorpersonalinjury toothers.Typically,coveragesincludeconstructionandalterationliability;contingent liability;contractualliability;elevatorsandescalatorsliability;errorsandomissions liability,environmentalpollutionliability;excessstoploss,excessoverinsuredorselfinsuredamountsandumbrellaliability;liquorliability;personalinjuryliability;premises andoperationsliability;completedoperationsliability,nonmedicalprofessionalliability,
Products Liability Line18
Surety Line24
Warranty Line30
Workers Compensation Line16
FireOnly Line1
AlliedLines Line2.1
Multi-Peril Crop Line2.2
FederalFlood Line2.3
etc.Alsoincludesindemnificationcoverageprovidedtoself-insuredemployersonan excessoflossbasis(excessworkers’compensation).(CompletedOperations, ConstructionLiability,ContingentLiability,ContractualLiability,Elevators,Errorand Omissions,EnvironmentalPollution,ExcessandUmbrella,PersonalLiability,Premises andOperations,ExcessWorkers’Compensation,CommercialGeneralLiability, ComprehensivePersonalLiability,DayCareCenters,DirectorsandOfficers,Employee BenefitLiability,Employers’Liability,EmploymentPractices,FireLegal,Municipal Liability,NuclearEnergy,Veterinarian,InternetLiabilityandCyberLiability).Excludes excessworkers’compensation.
Insurancecoverageprotectingthemanufacturer,distributor,sellerorlessorofaproduct againstlegalliabilityresultingfromadefectiveconditioncausingpersonalinjury,or damage,toanyindividualorentity,associatedwiththeuseoftheproduct.
Athree–partyagreementwheretheinsureragreestopayasecondparty(theobligee) ormakecompleteanobligationinresponsetothedefault,actsoromissionsofathird party(theprincipal).
Coveragethatprotectsagainstmanufacturer’sdefectspastthenormalwarrantyperiod andforrepairafterbreakdowntoreturnaproducttoitsoriginallyintendeduse. Warrantyinsurancegenerallyprotectsconsumersfromfinanciallosscausedbythe seller’sfailuretorectifyorcompensatefordefectiveorincompleteworkandcostof partsandlabornecessarytorestoreaproduct’susefulness.Includes,butisnotlimited to,coverageforallobligationsandliabilitiesincurredbyaservicecontractprovider, mechanicalbreakdowninsuranceandservicecontractswrittenbyinsurers.(Mechanical BreakdownandServiceContracts).
Insurancethatcoversanemployer’sliabilityforinjuries,disabilityordeathtopersonsin theiremployment,withoutregardtofault,asprescribedbystateorFederalworkers’ compensationlawsandotherstatutes.Includesemployer’sliabilitycoverageagainstthe commonlawliabilityforinjuriestoemployees(asdistinguishedfromtheliability imposedbyWorkers’CompensationLaws).Excludesexcessworkers’compensation.
Coverageprotectingtheinsuredagainstthelosstorealorpersonalpropertyfrom damagecausedbytheperiloffireorlightning,includingbusinessinterruption,lossof rents,etc.
Extendedcoverage;glass;tornado,windstormandhail;sprinklerandwaterdamage; explosion,riotandcivilcommotion;rain;anddamagefromaircraftandvehicle.
InsuranceprotectionthatissubsidizedorreinsuredbytheFederalCropInsurance Corporationforprotectionagainstlossesduetodamage,decreasesinrevenuesand/or grossmarginsfromcrop,livestockandotheragricultural-relatedproductionfrom unfavorableweatherconditions,drought,wind,frost,fireorlightning,flood,hail,insect infestation,diseaseorotheryield-reducingconditionsorperils.
CoverageprovidedbytheFederalInsuranceAdministration(FIA)oftheFederal EmergencyManagementAgency(FEMA)throughinsurersparticipatingintheNational FloodInsuranceProgram’s(NFIP)WriteYourOwn(WYO)program.Coverageissubject tothetermsandconditionsprovidedintheFinancialAssistance/SubsidyArrangement betweenthereportingentityandtheFIA.
PrivateCrop Line2.4
PrivateFlood Line2.5
Earthquake Line12
Privatemarketcoverageforcropinsuranceandagricultural-relatedprotection,suchas hailandfire,andisnotreinsuredbytheFederalCropIns
Privatemarketcoverage(primarystandalone,firstdollarpoliciesthatcovertheflood perilandexcessflood)forfloodinsurancethatisnotofferedthroughtheNationalFlood InsuranceProgram.(Sewer/waterbackupcoverageissuedasanendorsement homeownersorcommercialpolicy.)
Propertycoveragesforlossesresultingfromasuddentremblingorshakingoftheearth, includingthatcausedbyvolcaniceruption.Excludedarelossesresultingfromfire, explosion,floodortidalwavefollowingthecoveredevent.
Combination)
Fire Only Line 1
Allied Lines Line 2.1
Multi-Peril Crop Line 2.2
Federal Flood Line 2.3
Private Crop Line 2.4
Private Flood Line 2.5
Earthquake Line 12
Coverage protecting the insured against the loss to real or personal property from damage caused by the peril of fire or lightning, including business interruption, loss of rents, etc.
Extended coverage; glass; tornado, windstorm and hail; sprinkler and water damage; explosion, riot and civil commotion; rain; and damage from aircraft and vehicle.
Insurance protection that is subsidized or reinsured by the Federal Crop Insurance Corporation for protection against losses due to damage, decreases in revenues and/or gross margins from crop, livestock and other agricultural-related production from unfavorable weather conditions, drought, wind, frost, fire or lightning, flood, hail, insect infestation, disease or other yield-reducing conditions or perils.
Coverage provided by the Federal Insurance Administration (FIA) of the Federal Emergency Management Agency (FEMA) through insurers participating in the National Flood Insurance Program’s (NFIP) Write Your Own (WYO) program. Coverage is subject to the terms and conditions provided in the Financial Assistance/Subsidy Arrangement between the reporting entity and the FIA.
Private market coverage for crop insurance and agricultural-related protection, such as hail and fire, and is not reinsured by the Federal Crop Ins
Private market coverage (primary standalone, first dollar policies that cover the flood peril and excess flood) for flood insurance that is not offered through the National Flood Insurance Program. (Sewer/water backup coverage issued as an endorsement homeowners or commercial policy.)
Property coverages for losses resulting from a sudden trembling or shaking of the earth, including that caused by volcanic eruption. Excluded are losses resulting from fire, explosion, flood or tidal wave following the covered event.
Table 12 | Source: © National Association of Insurance Commissioners: Annual Statement Instructions Property/Casualty
Figure 18 below is a sample Line of Business In-Depth Detail page. Notations labeled letters A through I are provided, to assist in understanding the in-depth details for each Line of Business.
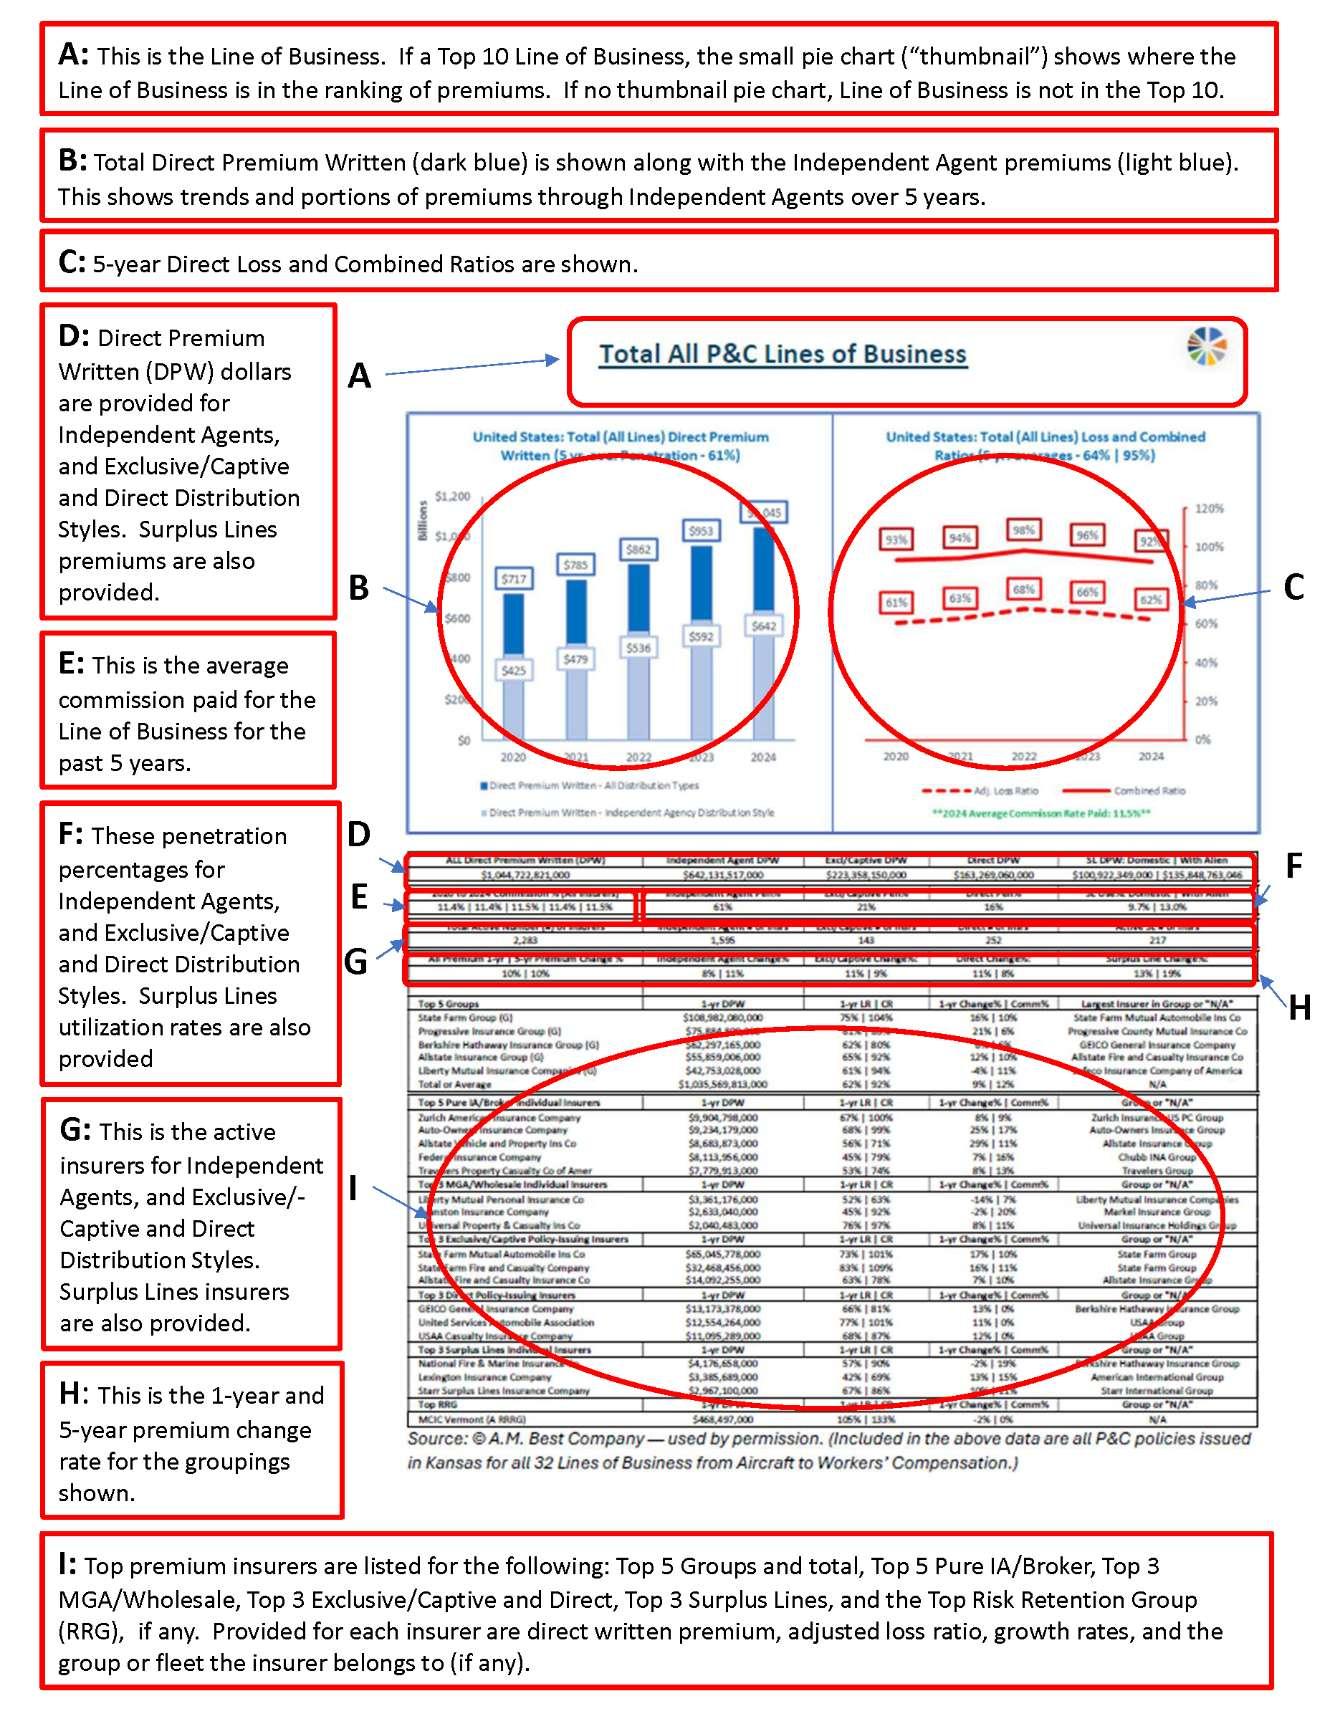
In this 2025 Louisiana Annual P&C Marketplace Summary abbreviations of key terms are often used. Explanations of these abbreviations are helpful, as unique abbreviations are utilized, in order to accommodate fitting an expanded view of each Line of Business on a single page.
Abbreviations are explained below, in the order in which they appear in this Summary:
ALL Direct Premium Written (DPW) is Direct Premium Written for all insurers together. This is specific to each Line of Business.
Independent Agent DPW is the Direct Premium Written (DPW) for Independent Agents generally, based on the combined Distribution Styles of Pure Independent Agent (IA)/Broker, Managing General Agent (MGA)/Wholesale, and IA-Mixed, also discussed in Appendix #1: Distribution Style Classifications. This is specific to each Line of Business.
Excl/Captive DPW is the Direct Premium Written (DPW) for the Exclusive/Captive Distribution Style. This is specific to each Line of Business.
Direct DPW is the Direct Premium Written (DPW) for the Direct Distribution Style. This is specific to each Line of Business.
Surplus Lines DPW is Surplus Lines Direct Domestic Premium, as discussed in the Surplus Lines section of this Summary. This is specific to each Line of Business.
2020 to 2024 Commission % (All Insurers) is the average Commission Rate paid by all insurers, for each of the five years in this summary, separated by a vertical line (“|”). This is specific to each Line of Business.
Independent Agent Pen% is the Independent Agent Penetration Percentage generally, based on the combined Distribution Styles of Pure Independent Agent (IA)/Broker, Managing General Agent (MGA)/Wholesale, and IA-Mixed Distribution Styles, as discussed in Appendix #1: Distribution Style Classifications. This is specific to each Line of Business.
Excl/Captive Pen% is the Exclusive/Captive Distribution Style Penetration Percentage. This is specific to each Line of Business.
Direct Pen% is the Direct Distribution Style Penetration Percentage. This is specific to each Line of Business.
Surplus Lines Use% is Domestic Surplus Lines Utilization Percentage (“Use%”), as discussed in Surplus Lines section of this Summary. This is specific to each Line of Business.
Total Active Number (#) of Insurers is the number of individual insurers with at least $1 of premium in 2024 for all Distribution Styles. This is specific to each Line of Business.
Independent Agent # of Insrs is the number of Independent Agent insurers generally with at least $1 of premium in 2024. This is specific to each Line of Business.
Excl/Captive # of Insrs is the number of Exclusive/Captive Distribution Style insurers with at least $1 of premium in 2024. This is specific to each Line of Business.
Direct # of Insrs is the number of Direct Distribution Style insurers with at least $1 of premium in 2024. This is specific to each Line of Business.
Active SL # of Insrs is the number of Domestic Surplus Lines insurers with at least $1 of premium in 2024. This is specific to each Line of Business.
All Premium 1-yr | 5-yr Premium Change % is the 1-Year (2023 to 2024) premium change for all insurers, and then, after the vertical line (“|”), the 5-Year (2020 to 2024) constant percentage change for all insurers. This is specific to each Line of Business.
Independent Agent Change% is the 1-Year (2023 to 2024) premium change for independent agents generally, and then, after the vertical line (“|”), the 5-Year (2020 to 2024) constant percentage change. This is specific to each Line of Business.
Excl/Captive Change% is the 1-Year (2023 to 2024) premium change for the Exclusive/Captive Distribution Style, and then, after the vertical line (“|”), the 5-Year (2020 to 2024) constant percentage change. This is specific to each Line of Business.
Direct Change% is the 1-Year (2023 to 2024) premium change for the Direct Distribution Style, and then, after the vertical line (“|”), the 5-Year (2020 to 2024) constant percentage change. This is specific to each Line of Business.
Surplus Line Change%: is the 1-Year (2023 to 2024) premium change for Domestic Surplus Lines insurers, and then, after the vertical line (“|”), the 5-Year (2020 to 2024) constant percentage change for Domestic Surplus Lines insurers. This is specific to each Line of Business.
Top 5 Groups is the Top 5 insurer Groups (G) based on Direct Premium Written with data provided for 1-yr DPW, 1-yr LR | CR, 1-yr Grow% | Comm%, and the Largest Insurer in Group or N/A, as each are defined in this Appendix. This is specific to each Line of Business.
Top 5 Pure IA/Broker Insurers is the Top five Pure Independent Agent (IA)/Broker Distribution Style individual insurers based on Direct Premium Written for 1-yr DPW, 1-yr LR | CR, 1-yr Grow% | Comm%, and the Group or N/A, as each are defined in this Appendix. This is specific to each Line of Business.
Top 3 MGA/Wholesale Insurers is the Top three Managing General Agent (MGA)/Wholesale Distribution Style insurers based on Direct Premium Written for 1-yr DPW, 1-yr LR | CR, 1-yr Grow% | Comm%, and the Group or N/A, as each are defined in this Appendix. This is specific to each Line of Business.
Top 3 Direct Insurers is the Top three Direct Distribution Style insurers based on Direct Premium Written for 1-yr DPW, 1-yr LR | CR, 1-yr Grow% | Comm%, and the Group or N/A, as each are defined in this Appendix. This is specific to each Line of Business.
Top 3 Surplus Lines Insurers is the Top three Domestic Surplus Lines individual insurers based on Direct Premium Written with details provided for 1-yr DPW, 1-yr LR | CR, 1-yr Grow% | Comm%, and the Group or N/A, as each are defined in this Appendix. This is specific to each Line of Business.
Top Individual RRG is the top Risk Retention Group (RRG) based on Direct Premium Written with details provided for 1-yr DPW, 1-yr LR | CR, 1-yr Grow% | Comm%, and the Group or N/A as each is defined in this Appendix. This is specific to each Line of Business. RRGs are not allowed to write some Lines of Business, in which case there is no RRG and this is shown as N/A.
1-yr DPW is the 2024 Direct Premium Written (DPW) as it applies to: the Top 5 Groups, the Top 3 Insurers for Pure Independent Agent (IA)/Broker, Exclusive/Captive, Direct, Surplus Lines, and the Top RRG. This is specific to each Line of Business.
1-yr LR | CR is the 2024 Adjusted Calendar Year Loss Ratio, and then, after the vertical line (“|”), the Combined Ratio for: the Top 5 Groups, the Top 3 Insurers for Pure Independent Agent
(IA)/Broker, Exclusive/Captive, Direct, and Surplus Lines, and the Top RRG. These are Direct Loss and Combined Ratios (before reinsurance). This is specific to each Line of Business.
1-yr Change% | Comm% is the 2023 to 2024 Premium Change, and then, after the vertical line (“|”), the Commission Percentage for: the Top 5 Groups, the Top 3 Insurers for Pure Independent Agent (IA)/Broker, Exclusive/Captive, Direct, and Surplus Lines, and the Top RRG. This is specific to each Line of Business.
Largest Insurer in Group or N/A is the largest individual insurer in each Group listed in the Top 5 Groups. For unaffiliated individual insurers who have no Group, that is shown as N/A.
The following pages, Appendix #4: 2024 Louisiana All Active Insurers List presents the year’s list of individual insurers with any Direct Premium Written (DPW) greater than $0, for all reporting insurers in Louisiana. Insurers are listed in alphabetical order.
The data provided for each insurer on the Louisiana All Active Insurers List includes:
Individual Insurer Name
Insurer Group (if any)
2024 Louisiana Direct Premium Written (DPW)
Direct Premium Written (DPW) Change from 2023 to 2024 in Dollars
2024 Louisiana Direct Premium Written (DPW) to U.S. Direct Premium Written (DPW) as a Percentage (%)
2024 Louisiana Adjusted Loss Ratio
This appendix allows you to quickly see basic information onthe many insurers that mightbe encountered by independent agents in their daily insurance agency operations. For more information about a particular insurer, check with your Independent Insurance Agents & Brokers of Louisiana staff.
Table 13 | Source: © A.M. Best Company — used by permission
This Appendix #5: 2024 Louisiana Fastest Growing Insurers, presents the fastest-growing insurers in Louisiana from 2023 to 2024, ranked by Direct Premium Written (DPW) change, for the four Line of Business groupings previously introduced in the Louisiana All Lines of Business Total Premium Comparisons section of this Summary. Each of the four Lines of Business groupings are covered in four separate tables in this appendix.
The four Lines of Business groupings are:
Total (All Lines of Business Combined) includes premiums for all 32 P&C Lines of Business.
Personal Lines includes All Private Passenger Auto, and Homeowners Multi-Peril.
Commercial Lines includes All Commercial Auto, Commercial Multi-Peril, Other Liability (ClaimsMade), Other Liability (Occurrence), Products Liability, and Workers’ Compensation.
Ag-Farm Lines include Farmowners Multi-Peril, Multi-Peril Crop, and Private Crop.
For each of the 4 Lines of Business groupings above, Tables 14-17 that follow expand upon and provide deeper insight into the market trends and shifts previously shown in Figures 9–12, in the Louisiana 5Year Penetration Rate Trends section of this Summary.
For the 25 insurers with the most premium growth Tables 14-17 include:
The Individual Insurer’s name
The insurer’s Group affiliation
Louisiana Direct Premium Written (DPW) Change from 2023 to 2024
Percentage DPW Change from 2023 to 2024
The Largest Line of Business in Louisiana
The Marketing Type reported by the insurer
For more information about a particular insurer, check with your Independent Insurance Agents & Brokers of Louisiana staff.
This 2025 Louisiana Annual P&C Marketplace Summary has provided the reader with both visual and numeric presentations of the 2020 through 2024 Louisiana P&C marketplace data. This data is provided to you as a benefit of your membership in the Independent Insurance Agents & Brokers of Louisiana.
Other informative insurance industry data products are offered by Real Insurance Solutions Consulting (R.I.S.C.), which also may be available to you as members:
Quarterly state-specific Marketplace Summaries are made available during the calendar year, as the data reported by P&C insurers becomes available.
Individual P&C Insurer Snapshots are available as requested, based on the same data provided in the annual and quarterly summaries, with in-depth data and information provided both on a national, and state-specific basis.
Annual state-specific Storm Event Summaries are made available upon request, based on data reported by the National Oceanic and Atmospheric Administration (NOAA) via its agency the National Center for Environmental Information (NCEI).
All questions, comments, need for further analysis, or orders for additional insurance industry data products are welcomed at the contact information below:
Real Insurance Solutions Consulting, LLC
Paul A. Buse, Principal www.realinsurancesc.com
301-842-7472

This 2025 Louisiana Annual P&C Marketplace Summary has provided the reader with both visual and numeric presentations of 2024 Louisiana P&C marketplace data. This data is provided to you as a benefit of your membership with the Independent Insurance Agents & Brokers of Louisiana.
Two additional, informative products are available from Real Insurance Solutions Consulting, which also may be available to you as members:
Quarterly state marketplace summaries are made available during the calendar year, as the data is reported by P&C insurers becomes available.
Individual P&C Insurer Snapshots are available, based on the same data provided in the annual and quarterly summaries, with in-depth data and information provided both on a national and Louisianaspecific basis..
All questions and comments, or need for further analysis are welcomed at the contact information below.