25 minute read
Supply and Pricing Upheavals Thrust LNG Industry into Uncharted Territory

by IGU
By Alex Forbes
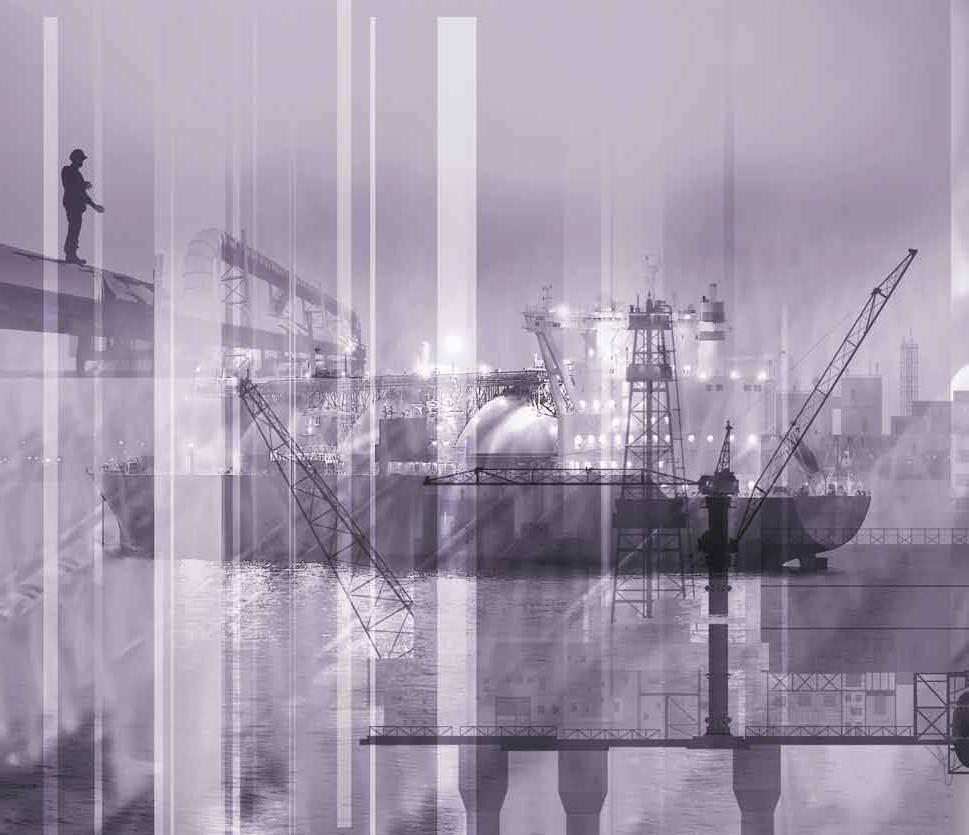
v Due to start up in
mid-2017, the Wheatstone LNG project will form part of the remarkable growth in Australian liquefaction capacity.
The LNG industry is no stranger to change. Over the past two decades it has grown astonishingly quickly. From being a niche fuel serving mostly a handful of markets without access to pipeline gas, LNG has become a mainstream source of natural gas supply, accounting for a growing share of interregional trade. Today, however, the industry faces unprecedented uncertainties. As its major players converge on Perth, Australia for LNG 18 – the triennial conference that is the industry’s largest gathering – they face big questions: How will markets react to the new waves of supply coming from Australia and the US? What impact will the oil price collapse ultimately have on gas/LNG pricing? What are the prospects for final investment decisions on new supply projects? How will the Paris Agreement on climate impact demand? And perhaps the biggest question of all: will Europe’s gas market now become the battleground that determines the future of not just LNG but the whole gas industry?
In 1998 – when I travelled to the Australian city of Perth to attend the LNG 12 conference, the last time it was held there – global production of LNG was around 90 million tonnes. By last year, according to preliminary data from Gas Strategies, output had grown to almost 250 million tonnes. This near-trebling of production represents an average annual growth rate of 6%.
And there is plenty more growth to come. As numerous new liquefaction projects come
on stream in Australia, the United States and elsewhere over the coming five years, LNG production could grow to more than 350 million tonnes by 2020, according to a forecast in the most recent Medium-Term Gas Markets Report (MTGMR) from the International Energy Agency (IEA). That would put LNG’s annual average growth rate between 1998 and 2020 at 6.5% – a rate that few other industries have matched, and close to three times faster than the annual growth in total natural gas production over the past decade.
But LNG’s importance stems not just from its rapid growth, impressive though that has been. Just as important has been its growing role in connecting markets with distant sources of supply, unreachable with pipelines.
This reach, combined with the flexibility inherent in transporting gas by LNG – given that ships, unlike pipelines, can choose which destination they will deliver gas to – has led to price signals being communicated between what once were separate regional markets. LNG’s role in creating connections between
regional markets, as flexible supply is attracted to the markets of highest value, will become ever more important in the evolution of the world’s natural gas markets over the coming decade. The IEA forecasts that inter-regional gas trade will grow by 40% between 2014 and 2020, surpassing 780 billion cubic metres (bcm) by 2020, with LNG accounting for 65% of the increase.

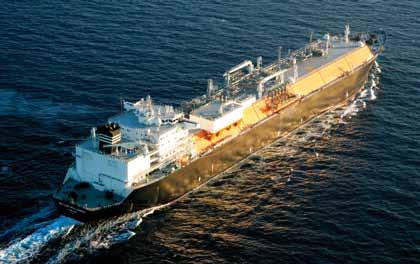
z Ship-based transporta
tion of LNG has changed the dynamics of regional markets.
c Lithuania became the
30th country to enter the LNG market in October 2014 with the arrival of the FSRU Independence at the port of Klaipe˙da.
Unforeseen market shifts
Over the past two decades, the LNG industry has, every few years, had to adapt to major, often unforeseen, market shifts, for example: ◆ At LNG 12 in 1998 no one could have conceived that the tiny emirate of Qatar – which had only recently started up its first liquefaction project, Qatargas 1 – would by 2011 dominate global LNG production with 77 million tonnes per annum (mtpa) of capacity. ◆ The widely held assumption during the first half of the 2000s that the United States would one day become the largest importer of LNG – overtaking Japan – was turned on its head by the North American shale gas revolution of 2007/08. The US is now well on its way to becoming the third-largest LNG exporter by 2020. ◆ Before 2010 Australia appeared to be set on an LNG trajectory that would keep it well
LNG by numbers
Global LNG trade
LNG trade rose marginally in 2014 to 241.1 million tonnes, according to the IGU’s World LNG Report – 2015 Edition*, launched at the World Gas Conference in June 2015. This was just short of the 241.5 million tonnes traded in 2011, the highest year for LNG trade on record. LNG accounted for 10% of global gas supply, up from 4% in 1990. Preliminary figures from Gas Strategies suggest that LNG trade in 2015 reached 248.6 million tonnes.
Long-term contracts accounted for 69% of global trade in 2014 while spot and short-term trade accounted for 27%; the remaining 4% was medium-term trade.
Liquefaction capacity
Global natural gas liquefaction capacity at the end of 2014 was 301 mtpa, up by more than 10 mtpa on the previous year, following the start-up of PNG LNG in Papua New Guinea, Arzew GL3Z in within the second league of producers.
Today there are seven new export projects in various stages of construction, commissioning and production ramp-up that together with existing projects will make Australia a bigger producer than Qatar before 2020. ◆ Before the Fukushima nuclear accident in
Japan in March 2011, the idea that all 54 of
Japan’s nuclear reactors would be shut down by September 2013 was unthinkable. Even today only three have re-started, leaving
Japan still much more dependent on imported LNG for electricity generation than anyone would have forecast before Fukushima.
It remains to be seen how many more reactors will re-start and over what timescale. ◆ Finally, the oil price collapse that began in the second half of 2014 and which continues to batter the oil and gas industry, with no end in sight, has major implications for the
Algeria, and Queensland Curtis LNG in Australia.
Regasification terminals
Global nominal regasification capacity at the end of 2014 was 724 mtpa, up from 693 mtpa in 2013. During 2014, Lithuania became the 30th country to enter the LNG market. Floating regasification capacity reached 54 mtpa with 16 active terminals in 11 countries.
Shipping fleet
The global shipping fleet at the end of 2014 numbered 373 carriers with a combined capacity of 55 million cubic metres. Twentyeight vessels were delivered during the year as speculative new builds entered the market. With ample tonnage open for charter, short-term charter rates came under pressure throughout the year.
* The report can be downloaded, free of charge, from: www.igu.org/sites/default/files/node-page-field_file/IGU-World%20 LNG%20Report-2015%20Edition.pdf
v Figure 1. LNG industry, not least because a lot of LNG is still sold under long-term contracts indexed to oil price. The many proposed LNG export projects that were hoping to take final investment decision (FID) in 2015 or 2016 now face a highly uncertain future, amidst intense pressure to reduce project costs. Some will not go ahead while others will literally have to go back to the drawing board.
Supply glut meets downgraded demand expectations
As industry players gather in Perth for LNG 18 in April, they will be confronting the impacts of all the factors above, compounded by downgraded expectations of demand for LNG over the short-to-medium term, in the face of a looming LNG supply glut.
The charts in Figure 1 from the IEA’s MTGMR show just how rapidly LNG production is forecast to grow over the coming five years, with much of the growth taking place during this year and next – as several new Australian liquefaction trains, and a couple in the United States, ramp up production (see separate article on p126).
In general, forecasting LNG supply over a five-year period can be done with reasonable certainty because it takes around that long for projects to go from FID to start up. So projects should already have reached FID by now if they are to start up by 2020.
LNG exports by region, 2014-20
Moreover, it remains unusual for projects that have reached FID to then be cancelled. That said, the scale of the oil price plunge means that that could conceivably happen to projects in the early stages of construction; those in the latter stages are unlikely to be cancelled because most of their capital cost is sunk and the short-run marginal cost (SRMC) of producing LNG is generally low.
Together, the “Magnificent Seven” new projects in Australia add 62.3 mtpa to the 24.3 mtpa capacity of earlier projects, giving a total of 86.6 mtpa, all of which should have ramped up to full production by around 2019. In the US, five projects have reached FID and are under construction, together totalling 64.5 mtpa of capacity – probably all on stream by 2020, making the US the third-largest producer after Australia and Qatar by the end of the decade.
Also likely to come on stream in this timeframe are: the re-built 5.2 mtpa Angola LNG project, which had to shut down soon after it started up in mid-2013 because remedial work was needed; three projects totalling 6.3 mtpa in Malaysia, consisting of two Floating LNG (FLNG) vessels and MLNG Train 9; and the 16.5 mtpa Yamal LNG project in Russia.
Several other projects are hoping to reach FID this year but in most cases the chances of
that happening are slim, meaning these
bcm
LNG exports by region
500
400
300
200
100
0
2014 2015 2016 2017 2018 2019 2020
Source: IEA, Medium-Term Gas Markets Report 2015.
LNG exports, annual change
Latin America bcm OECD Americas Middle East OECD Europe FSU/Non-OECD Europe OECD Asia Oceania Non-OECD Asia Africa 40
30
20
10
0
2015 2016 2017 2018 2019 2020
projects are unlikely to start up before 2020. They include several projects in the US and Canada, two in eastern Africa, the Fortuna LNG project in Equatorial Guinea, and the third train at Tangguh in Indonesia.
In its MTGMR, the IEA does not expect any of these to start up before 2020, partly because of the impact of the oil price plunge on project
LNG imports by region, 2014-20
economics, and partly because finding buyers will be difficult as the industry moves into a period of oversupply that is not expected to ease until the end of the decade.
The charts in Figure 2 from the IEA’s MTGMR show how LNG imports are likely to evolve in the various markets over the period from 2014
to 2020. Overall, the IEA sees LNG trade rising
2014
China 8%
Latin America 5%
OECD Americas 4%
OECD Europe 14%
Middle East 1%
Non-OECD Asia 14%
Source: IEA, Medium-Term Gas Markets Report 2015.
2020
China 14%
OECD Asia Oceania 54% OECD Europe 19%
Latin America 5%
OECD Americas 2% FSU/non-OECD Europe 0%
OECD Asia Oceania 37%
Middle East 2% Non-OECD Asia 21%
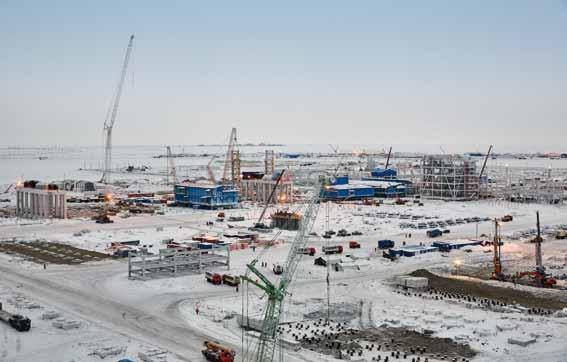
c Launch of the first LNG
production from Yamal LNG is planned for 2017.
c Figure 2.
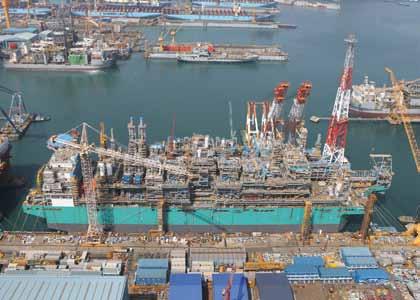
z The ability to release
the potential of stranded gas with Floating LNG platforms such as Petronas FLNG 1, seen here under construction, will bring further changes to the market.
by 45%, in line with forecast production, to reach 473 bcm (around 350 mtpa) in 2020, led by China, non-OECD Asia and Europe.
Europe once again emerges as a “residual market” (or market of last resort) “importing what other regions do not take due to its capability to arbitrage between LNG and pipeline flows”. The IEA sees its imports doubling to 91 bcm by 2020. Growth elsewhere means its share of the total rises from 14% to 19%.
China’s imports are forecast to grow rapidly, particularly in 2016-17 as large new sources of supply come on stream, though the recent economic slowdown in China – the full extent of which did not become clear until after publication of the MTGMR – means a high level of uncertainty over just how much it will import. This uncertainty spills over into Europe, of course, because of its perceived role as market of last resort.
Overpriced?
Despite the impressive rate of LNG demand growth forecast by the IEA, projected growth will not meet the industry’s expectations. This is partly because of economic difficulties – notably in Europe and more recently in some of the big emerging economies, such as China and Brazil – but also because in some markets gas has been simply too expensive.
At a natural gas summit in Paris towards the end of last year, Total CEO Patrick Pouyanné said: “We are shifting in the LNG business, in particular, from what was a sellers’ market to a buyers’ market. Following Fukushima we had some golden years because of the call for LNG by Japan, mainly, and so gas prices rocketed. However, when you have high prices you are happy as a producer but in terms of development of future demand you are not helping it to grow. And what we face today is that in most of the countries in Asia we did not develop the customer base at the pace that was anticipated.”
In some key markets, notably Asia and Europe, gas has been losing out to competition from coal, and increasingly from renewables, partly because of price differentials and partly because of subsidies – because policymakers have failed to create conditions conducive to gas market development.
A key message from Pouyanné was that Total – like the other major international oil and gas companies (IOGCs) – is well on its way to becoming more of a gas company than an oil company. Shell is already a bigger producer of gas than oil, while gas accounts for around half of BP’s upstream production globally and it won’t be long before that reaches 60%. “50% of our production is gas,” said Pouyanné, “and 40% of our revenues are linked to the gas business. We are more and more a gas company. And why? Because the gas market is growing quicker than the oil market.”
In this context it is important to remember that LNG trade is projected to grow at a much faster rate than the overall gas market – so much so that all the major IOGCs are putting increasing emphasis on growing their LNG activities. Shell’s decision to acquire BG was largely predicated on the world-leading LNG position that such a move would create.
Referring to the COP 21 climate talks, Pouyanné also had plenty to say about the role natural gas should be playing in the transition to a low-carbon energy economy:
“Gas is part of the solution for climate change if we are all serious about it. I know plenty of people consider all fossil fuels should be discarded, but the truth is that humanity needs energy; we need to bring that energy in a secure affordable way; and we need to advocate for gas.” (For a detailed look at the implications of the COP 21 Paris Agreement on climate for the natural gas industry, see pages 100-108).
Getting the price right
While the oil price plunge has created severe cash flow difficulties for oil and gas companies, it has, ironically, helped to bring down the price of gas – directly in the case of oil-indexed contracts, whether delivered by pipeline or LNG, and indirectly in the case of spot LNG cargoes and market hubs. In so doing, it has highlighted two key issues that the gas industry now has to confront.
The first is the indexation of many gas contracts to oil prices – a link that once was logical but increasingly looks an anachronism. In the words of former Cheniere CEO Charif Souki, speaking at the same Paris gas summit as Pouyanné:
“Our opinion is that it’s never made sense to use oil indexation because it’s fictitious. You really do need price as a signal from the consumer to the producer to either add capacity or stop. If you’re tying the price signal to a different commodity, the signal is not valid.
“And this is [one of the reasons] that we’ve been as successful as we’ve been. Because while we were introducing a new [commercial] model, the existing players stuck stubbornly to the old model, at a $100/barrel oil price, which made our marketing efforts much easier to accomplish.”
It is, of course, one thing to say that oil indexation is no longer appropriate and quite another to come up with a rational set of alternatives for those markets where oil indexation still prevails – such as long-term contracts for LNG imported into Asia.
That said, oil prices of around $30/barrel or less are helping to concentrate minds. A growing number of people in the industry appear to believe that it is time to free natural gas from “the tyranny of oil price volatility”. It happened long ago in North America, and – as the IGU’s regular reports on wholesale gas pricing graphically show – has been happening, albeit gradually, in Europe.
Pressure on project costs
The second issue highlighted by the oil price plunge, and by the struggle gas has been facing to compete against coal and renewables, is the need to bring down the costs of new LNG projects, especially liquefaction projects.
Even before the oil price plunge, the escalating costs of gas projects were a concern. Between 2004 and 2014, average capital expenditure on upstream and midstream gas projects more than doubled, while the cost of complex technologies such as LNG and gas-to-liquids (GTL) in some cases quadrupled.
There is a growing consensus within the oil and gas industry that there needs to be much more emphasis on driving down the intrinsic costs of projects, by careful consideration of design, engineering, procurement and construction activities. At last year’s World Gas Conference in Paris, Shell CEO Ben van Beurden said capital cost trends over the past two decades had become unsustainable, adding that the industry needed to become better at driving them down.
“The most important focus areas are design, engineering and construction,” he said. “Gas plants got more expensive largely because we make them more complex … because we take
more time to engineer them … and because we face lower productivity when we build them.
“So the core challenge is driving down cost inflation in design, construction and engineering. This won’t be easy, but it’s not impossible. Standardization and supply chain integration are key factors. Shell is stepping up its game in this field.”
Possible approaches to project cost reduction are many and varied but the ones being quoted most often at the moment are: simplification, standardization, modularization, integration, technology innovation, the use of controlled environments for construction, and, especially in the case of LNG projects, re-consideration of the use of expensive design competitions at the front-end engineering design (FEED) stage.
Most of these approaches are not new in themselves, and there is considerable overlap between them. But what some in the industry are arguing is that they need to be rediscovered and implemented in innovative ways.
“Our clients demonstrate increasing willingness to engage earlier and work differently with contractors,” says Thierry Pilenko, the CEO of Technip, a global engineering, procurement and construction (EPC) contractor with a extensive track record of executing natural gas projects, especially LNG, and most recently FLNG. “They want to make new projects viable and seem likely to accelerate the standardization and simplification of projects.
“These major changes in our environment are triggering new ways of thinking, new ways of working. You can see that the word integration is becoming more and more important across the board.”
How quickly companies will reverse their policy of delaying and cancelling projects is impossible to say, especially as the oil price outlook in the medium term continues to worsen – putting increasing pressure on dividend and investment policies. But, sooner or later, oil and gas companies will need to invest in new projects or see their production plummet.
“All our clients are telling us that at some stage the delays on projects or the cancellation on projects will impact their production,” says Pilenko. “Everybody agrees and everybody has started to model this impact.
“So it is clear that at some stage projects will have to start again – but they will have to start in a cost environment which has to be different.
The trigger for new projects to move forward will be when clients see that they have a cost environment which is predictable and which is structurally lower than it is today.”
Will Europe become a pricing battleground?
The dynamics of global gas markets are undergoing fundamental shifts that could potentially alter the behaviour of influential players in ways that even a couple of years ago would have seemed unlikely.
The softening of gas demand in Asian markets, combined with the big waves of new LNG that are on the way, first from Australia and later from the US, means that a lot of LNG could soon be looking for a market. With Europe seen as the market of last resort, several commentators have been speculating that Russia’s Gazprom might choose to preserve its market share in Europe, where it makes most of its pipeline gas export revenues, by radically altering its pricing strategy.
A detailed commentary on why and how this might come about was published by the Oxford Institute for Energy Studies in January 2016.
In it, author James Henderson writes: “Gazprom’s defence of its core European market will be of fundamental importance both to its own performance and to the Kremlin’s ability to use gas as a geopolitical tool.
“However, multiple threats now face the company’s business model in Europe. Many have been emerging over the past few years,
v Figure 3.
Ranges of Russian gas export revenues at various volumes and prices
Gross revenues ($ billion) 38
36
34
32
30
28
26
24
22 2016 2017
ACQ at US SRMC 70% ToP at Q4 2015 price Current volumes at NBP 2018 2019
Current volumes at Q4 2015 price 70% ToP at NBP
Current volumes at US SRMC
Assumptions
Volumes (bcm) ACQ 2015 70% Take or Pay 2016 191 160 133 2017 192 160 134 2018 193 160 134 2019 194 160 135
Prices ($/mmbtu) Russia Q4 2015 NBP Futures US LNG SRMC based on HH Futures 5.78 4.93 4.32 5.78 5.13 4.69 5.78 5.18 4.84 5.78 5.12 4.95
Source: Oxford Institute for Energy Studies, Gazprom – Is 2016 the Year for a Change of Pricing Strategy in Europe?
2020
2020 195 160 136
5.78 5.10 5.13
but a combination of warm weather in the 2015 winter, the potential impact of the COP 21 discussions in Paris in December 2015, the imminent export of LNG from the US, the continuing expansion of Australian LNG exports, and the ongoing antipathy towards Russian gas in Europe mean that 2016 could mark a turning point for Gazprom.”
In short, Henderson argues that Gazprom could choose to move away from its policy of indexing its gas exports to oil prices and instead move towards full participation in European hubs or even price its gas aggressively at or just below the SRMC of US LNG into Europe.
In so doing it could, says Henderson, pursue a number of objectives: price US LNG out of the European market; push coal out of European electricity generation; and even “announce and demonstrate a commitment to keeping prices below the level required for new LNG projects to attain FID, and hence defend and grow market share through the 2020s”.
At its extreme, such a strategy would have global ramifications. Qatar, for example, still has a significant proportion of LNG production
capacity that is not committed to long-term contracts. It has been selling this successfully in Asia but some of that supply could be pushed out as Australian LNG bought on take-or-pay terms comes on stream. So it would not be just US LNG looking for a market of last resort in Europe.
Figure 3, compiled by Henderson, shows how Russia’s gas export revenues would evolve in scenarios – based on the assumptions in the table – that Gazprom could adopt to defend its share of Europe’s gas market.
Two of the three worst outcomes (yellow and dark blue) emerge from the low-volume scenarios, in which volume is the minimum take-or-pay level of 70% of the Annual Contract Quantity (ACQ) in Gazprom’s longterm sales contracts.
The best outcome (light blue) comes from cutting price to the SRMC of US LNG exports and growing volumes to the full ACQ level.
Gazprom would be better off defending its current volumes by reducing its price to the US SRMC rather than seeking to maintain a National Balancing Point (NBP) forward price of just over $5/MMBtu and accepting a reduction in volumes to the 70% take-or-pay level.
In other words, writes Henderson: “Price competition with US LNG, based on full participation in European hubs and an acceptance of spot pricing, now looks like a logical defensive tactic, with potential upside if volumes can be increased towards the ACQ level.”
For now, Henderson’s suggestions are hypothetical. But they underline how the medium-term future of LNG in particular and natural gas in general could evolve along several possible paths, depending on how industry players and policymakers choose to react to the challenges they are facing.
Alex Forbes is an independent journalist and consultant who has been reporting on energy developments and analysing trends for three decades.
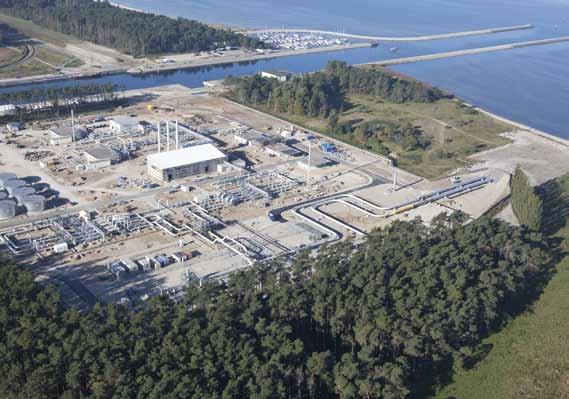
c The landfall of the Nord
Stream pipeline at the Lubminer Heide energy hub near Greifswald in Germany. The changing dynamics of the LNG market may cause re-evaluation of pricing models in other sectors.
Sustainability at Qatargas
Energy is one of the most important resources required in the development and growth of global economies as well as local communities. As the world’s population and economic prosperity continue to grow, so does the demand for energy. The challenge is to satisfy this demand in a responsible and sustainable manner. Through the provision of reliable and cost-effective energy, Qatargas is playing an integral role in supporting the needs of economies and local communities all around the world. Energy from Qatargas has reached almost two billion people to date. By supplying cleaner burning natural gas, Qatargas is also playing a critical role in supporting countries to lower their emissions, improve their air quality and transition to a low-carbon economy.
As set out in the Qatar National Vision 2030 (QNV 2030), Qatargas is committed to the optimum use of Qatar’s natural hydrocarbon resources, establishing a balance between reserves and production. Qatargas seeks to use technology and innovation to efficiently and responsibly convert these resources into national revenue which is then invested into the development and growth of Qatar. The Qatargas Direction Statement clearly outlines the company’s approach to delivering on its vision, with a focus on the integrated management of economic, environmental and social factors.
Qatargas has been in a continuous drive toward excellence in its operations, as it seeks to minimize carbon emissions. State-of-the-art solutions are being used to further improve the environmental performance of its production facilities. A Greenhouse Gas Management Programme and a Wastewater Recycling and Reuse Project are also currently under implementation.
The Jetty Boil-Off Gas (JBOG) Recovery facility, which started operations in October 2014, is already contributing to the reduction of flaring and greenhouse gas emissions. It results in a 90% reduction in flaring at the six LNG loading berths at Ras Laffan – a level equivalent to annual Green House Gas (GHG) savings of 1.6 million tonnes of CO₂. The project also helps recover 29 billion standard cubic feet (bcf) of gas per year, which is enough gas to produce 750 MW of power or to power 300,000 homes.
The JBOG Project demonstrates the commitment of the State of Qatar to balance industrial development with care for the environment and reinforces
Qatargas’ pioneering and leadership role in the energy industry.
Qatargas 1 has reduced its NO X
emissions by 30% since 2011, driven by the installation of a low NO X
combustion system in the older LNG trains. The positive environmental impact of Qatargas reducing its NO X
emissions by a third cannot be overstated: those gases – that is, nitric oxide (NO) and nitrogen dioxide (NO₂) – are potentially dangerous pollutants, which react to form smog and acid rain.
Another interesting and pioneering environmental project is the recent introduction of a Main Engine Gas Injection (MEGI) Project which sees the first slow speed two-stroke marine diesel engine to run on LNG on a Qatargas Q-Max type LNG carrier.
Qatargas’ approach to environmental management is aligned with the QNV 2030 objective of sustaining the environment for our future generations. Maintaining the highest standards for environmental protection and responsible resource utilization are fundamental requirements of the Qatargas Direction Statement and represent the premier ‘Qatargas way’ of doing business. We continue to promote the use of state-of-the-art solutions to further improve the environmental performance of our production facilities. Our key environmental focus areas have been compliance, flare reduction, GHG and air emissions management, wastewater recycling and reuse and waste management.
These are just some of the efforts Qatargas is making as part of its unwavering commitment to environmental sustainability and towards delivering on Qatar’s National Vision to produce and supply clean energy to the world.
As the world’s largest liquefied natural gas producer, Qatargas has emerged as the global leader in producing and supplying this valuable natural resource. Qatargas, with its large asset base in liquefaction and shipping capacity, is able to deliver to more than 28 countries. This has included delivering over 4,000 LNG cargoes safely and reliably, and currently, Qatargas delivers approximately 500 cargoes per year around the world. That’s a fact we are very proud of.