
17 minute read
Why New Waves of LNG from Australia and the US will Re-shape the Industry

by IGU
By Alex Forbes
The LNG industry is projected to grow by close to 50% between 2014 and 2020 as new waves of natural gas liquefaction capacity come on stream in Australia and the United States. If all goes to plan, by 2020 their combined production capacity will reach over 150 million tonnes per annum (mtpa), with Australia overtaking Qatar to become the world’s biggest supplier in 2018. But scale is not the only important factor. These new waves of supply will change the way LNG business is done. In the case of Australia, LNG indexed to oil price will be coming on stream at very low oil prices. This will be painful for producers but it will make LNG more competitive in Asia than it has been for a long while, with obvious implications for demand growth. As for the US, new commercial models will increase flexibility and pricing diversity. Five years from now the industry is likely to look very different to how it does today.
In January 2012 the LNG industry passed an historic milestone when the Japanese company Inpex announced that, along with its partners, it had reached final investment decision (FID) on Ichthys LNG. It was noteworthy because Ichthys is the first large-scale LNG liquefaction project to be operated by a Japanese company. It was also noteworthy because Ichthys is the largest-ever project financing in the LNG industry. But it was especially noteworthy because from that point on Australia had more LNG capacity in operation and under construction than Qatar – currently by far the world’s largest LNG producer, with 77 mtpa of capacity.
Inpex’s announcement brought to a close a remarkable 13 months – from January 2011 to January 2012 – during which seven onshore liquefaction trains and a floating LNG (FLNG) project, with a combined capacity of 33.7 mtpa, reached successful FIDs in Australia. Never before had so much LNG production capacity been sanctioned in such a short time – not even in Qatar, whose LNG achievements once looked unassailable.
The first two of those trains, sanctioned in January 2011, comprised the GLNG project in Queensland, one of three to be supplied with coal-seam gas (CSG, or coal-bed methane as it is called elsewhere). The following May, Shell announced FID on Prelude, the first implementation of its new FLNG technology. In July the partners in Australia Pacific LNG (APLNG), led by Origin Energy and ConocoPhillips, sanctioned the first train of their two-train CSG-supplied project. In September the partners in Wheatstone LNG, led by Chevron, sanctioned another two-train project. And in January 2012 Inpex made its announcement about the two-train Ichthys project.
Contenders for the “new Qatar”
During the latter half of the 2000s, when it was becoming increasingly clear that Qatar was determined to reach its 77 mtpa target, there was much speculation about which country might become the “new Qatar”. In other words, where might the next big wave of LNG production capacity come from? Two nations stood out as contenders – Nigeria and Australia. But both looked to be in a different league to Qatar.
Nigeria, already a major LNG player thanks to the multi-train Nigeria LNG project, had
several new projects on the drawing board, but not enough to challenge Qatar’s LNG primacy. Several years on, those proposed new projects remain on the drawing board. Australia too had several projects in the planning stage but, again, not enough to challenge Qatar’s lead, and most were making slow progress.
A decade ago, Australia had just one LNG project, the North West Shelf venture. Its five trains today have a total capacity of 16.3 mtpa. It was joined in 2006 by Darwin LNG, a singletrain project that added 3.7 mtpa and in April 2012 by Pluto LNG, another single-train project that added 4.3 mtpa, taking Australia’s total capacity to 24.3 mtpa.
The “Magnificent Seven”
However, as the 2000s began to draw to a close, a new wave of Australian projects began with the FID on the Chevron-led Gorgon project in 2009. In 2010 BG Group, as it then was, announced FID on the world’s first liquefaction project to be supplied with CSG – Queensland Curtis LNG (QCLNG). Then came the wave of FIDs outlined above, to be followed by FID on the second train of APLNG in July 2012.
Together these projects make up what some in the industry have taken to calling the “Magnificent Seven” (Table 1). As the chart on page 128 shows, their combined capacity of 62.3 mtpa, when combined with the capacity
x The LNG ship Seri
Bakti arriving at the Santos GLNG site on Curtis Island, Gladstone, Australia on 28 September 2015 to collect the project’s first cargo.
x Table 1.
Australia's LNG projects (March 2016)
Project company
North West Shelf Venture
Darwin LNG
Pluto LNG
Gorgon
Queensland Curtis LNG (QCLNG)
GLNG
Operating company
Woodside Energy
ConocoPhillips
Location Train
Karratha, Western Australia Train 1
Train 2
Train 3
Train 4
Train 5
Darwin, Northern Territory Train 1
Woodside Energy
Chevron Burrup Peninsula, Western Australia
Barrow Island, Western Australia Train 1
Train 1
Train 2
Train 3
QGC (BG Group's Australian subsidiary) Curtis Island, near Gladstone, Queensland
GLNG Operations (upstream assets are operated by Santos) Curtis Island, near Gladstone, Queensland Train 1
Train 2
Train 1
Train 2
Prelude FLNG Shell Browse Basin, 200km offshore Western Australia Train 1
Australia Pacific LNG (APLNG) ConocoPhillips
Wheatstone Chevron
Ichthys LNG INPEX Curtis Island, near Gladstone, Queensland
Ashburton North, Western Australia Train 1
Train 2
Train 1
Train 2
Darwin, Northern Territory Train 1
Train 2
Total capacity started up before 2013
Total capacity to be started up after 2013
Total capacity operational and under construction
Capacity (mtpa)
2.5
2.5
2.5
4.4
4.4
3.7
4.3
Shareholders
BHP Billiton Petroleum, BP Developments Australia, Chevron Australia, Japan Australia LNG (MIMI), Shell Development (Australia) and Woodside Energy. Each has a one-sixth share.
ConocoPhillips 57.2%, Eni Australia 11.0%, Santos 11.4%, Inpex 11.3%, Tokyo Gas/Tokyo Electric 9.2%
Woodside 90%, Tokyo Gas 5%, Kansai Electric 5%
Status
Operational
Operational
Operational
5.2
5.2
5.2 Chevron (47.3%), ExxonMobil (25%), Shell (25%), Osaka Gas (1.25%), Tokyo Gas (1%) and Chubu Electric Power Company (0.417%)
Under construction
Target start-up date
1989
1989
1992
2004
2008
2006
April 2012
First LNG cargo expected in "early 2016"
4.25
4.25
3.9
3.9
3.6
4.5
4.5
4.45
4.45
4.45
4.45
24.3
62.3
86.6
BG 50% and CNOOC 50%
BG 97.5% and Tokyo Gas 2.5% Operational December 2014
July 2015
Santos (30%), Petronas (27.5%), Total (27.5%) and Kogas (15%)
Shell (67.5%), INPEX (17.5%), Kogas (10%), CPC (5%) Operational
Under construction October 2015
Q2, 2016
Under construction Shell has not disclosed a date but shareholder INPEX has said around 2017
ConocoPhillips (37.5%), Origin Energy (37.5%), Sinopec (25%) Operational
Under construction
Chevron (64.14%), Kufpec (13.4%), Woodside Petroleum (13%), PE Wheatstone (8%) Kyushu Electric (1.46%)
Under construction
INPEX (62.245%), Total (30%), CPC (2.625%), Tokyo Gas (1.575%), Osaka Gas (1.2%) Kansai Electric (1.2%), Chubu Electric (0.735%), Toho Gas (0.42%)
Under construction January 2016
Q2, 2016
Mid-2017
Q3, 2017
x Remote project
locations such as Barrow Island, the site of Gorgon, have been a factor in rising costs.
of earlier projects, means that Australia is on a trajectory towards total capacity of 86.6 mtpa, perhaps as soon as 2020. At the time of writing, four trains have begun operation – two at QCLNG, one at GLNG and one at APLNG, with several more on the verge of so doing. All the trains are due on stream by 2018.
There have been no more liquefaction project FIDs in Australia since mid-2012, despite a still-long list of proposed projects, and none are expected for the foreseeable future – partly because of the oil price collapse and partly because of the looming LNG supply glut.
Resource constraint concerns
The sanction of so much capacity over such a short period raised concerns over whether it would be feasible to construct so many projects without resource shortages, not least of skilled engineers – raising the spectre of lengthy and costly delays.
In fact, delays – where they have occurred – have tended to be pretty minimal, in most cases just a matter of a few months. Only two projects are facing substantial delays – about a year-and-a-half in the case of Gorgon and sixto-nine months in the case of Ichthys – but delays on this scale are far from unusual in the LNG industry.
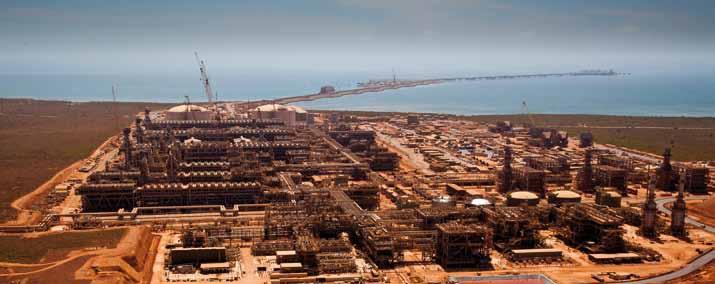
Several of the projects have however announced large cost overruns on what were already very high costs when compared with the projects launched a decade or so ago. High salaries for skilled staff such as welders, and even unskilled staff, have been compounded by the remote locations of some of the projects.
For example, Gorgon’s onshore facilities are on Barrow Island offshore Western Australia. The expected project cost at the time of FID in 2009 was $37 billion; it is now expected to cost $54 billion. In total, the Magnificent Seven are now expected to cost close to $200 billion, an overrun of more than $30 billion.
That said, the forward economics for projects whose capital costs are sunk still look attractive because operating costs will be low and because the projects will have operational lives measured in decades. Besides, not all the projects took FID in a $100+/barrel oil price world. When Gorgon took FID in 2009 and QCLNG in 2010 oil prices were well below that level.
Moreover, much of the LNG output from the Magnificent Seven projects will go to shareholders in the projects (Table 1) under longterm contracts indexed to oil price. Depending on shares in the projects and contract commitments, some companies will find that their reduced revenues from the project are partly or

x Figure 1. more than compensated by the lower prices in their sale and purchase agreements (SPAs).
For now, at least, there have been no suggestions that low oil prices will lead to any cancellations among the Magnificent Seven. So their impact on LNG markets – not just in Asia because of the growing interconnectedness of regional gas markets (see article on pages 112-123) – will be immense. A protracted period of low LNG prices in Asian and European markets would stimulate greater demand growth as natural gas becomes more competitive, especially in the power generation fuel mix.
The big US U-turn
The shift of the LNG spotlight from Qatar to Australia in the period 2009-2012 meant that it took a while for people to realise that something remarkable was happening in the United States.
In 2009, when the World Gas Conference took place in Buenos Aires, Argentina, the gas world was still coming to terms with the impact of the shale gas revolution on North American natural gas production. It was clear that previous expectations of the US becoming a major LNG importer were going to turn out to be wrong. But at that time there was no suggestion
LNG export capacity (as of March 2016)
Million tonnes per annum 160
140
120
100
80
60
40
20
0
2015
US 2016 2017
Australia 2018 2019 2020 2021 2022 2023 2024
that the US was on track to become a major LNG exporter.
The first company to apply for approval to export LNG from the US was Cheniere Energy. In August 2010 it filed for approval to export LNG to countries with which the US has a Free Trade Agreement (FTA). The following month it applied for approval to export to non-FTA countries, a more significant development, given that the only FTA country that is a major importer of LNG is South Korea.
LNG export stampede
In the six years since then, the US Department of Energy (DoE) – the authority responsible for deciding on LNG export licences under the Natural Gas Act – has received numerous applications in what amounts to nothing less than a stampede (mirroring the stampede to develop LNG import terminals a decade earlier).
Cheniere’s 2010 application for LNG export approval took many people by surprise and attracted a lot of attention and opposition. Somewhat taken aback, the DoE eventually gave its approval in 2011 but put all the other non-FTA applications on hold, while it awaited the conclusions of two studies into the issue: one produced by the Energy Information Administration (EIA), which looked at how different export scenarios would affect domestic gas prices, and a report commissioned from NERA Economic Consulting, which examined the wider potential impacts on the US economy.
The EIA report, which concluded that LNG exports would not have an unacceptable impact on domestic gas bills, was controversial enough. But it was nowhere near as controversial as the NERA report published by the DoE in December 2012, after a number of delays. Entitled Macroeconomic Impacts of LNG Exports from the United States, it concluded that: “for every one of the market scenarios examined, net economic benefits increased as the level of LNG exports increased. In particular, scenarios with unlimited exports always had higher net
x Table 2.
US Lower 48 LNG projects (March 2016)
Project company Operating company Location
Sabine Pass Liquefaction Project Sabine Pass Liquefaction, LLC (SPL) Cameron Parish, Louisiana
Freeport LNG Freeport LNG Expansion, L.P. Quintana Island, near Freeport, Texas
Train
Train 1
Train 2
Train 3
Train 4
Train 5
Train 1
Train 2
Train 3
Capacity (mtpa) Shareholders
4.5
4.5
4.5
4.5
4.5
4.64
4.64
4.64 Project company is controlled by Cheniere Energy Partners LP, a subsidiary of Cheniere Energy, Inc. (Blackstone currently has a 29% ownership interest in Cheniere Energy Partners LP through its ownership of Class B units.)
Freeport LNG Expansion, L.P. is a wholly owned subsidiary of Freeport LNG Development.
Target start-up date
Q1, 2016
H1, 2016
2017
2017
2019
September 2018
February 2019
August 2019
Dominion Cove Point LNG Dominion Cove Point LNG, LP (DCP) Lusby, Calvert County, Maryland Train 1 5.25 DCP is a subsidiary of Dominion Resources, Inc. Late 2017
Cameron LNG Cameron LNG Holdings, LLC Hackberry, Cameron Parish, Louisiana
Corpus Christi Liquefaction Project Corpus Christi Liquefaction, LLC Corpus Christi, Texas
Total capacity operational and under construction Train 1
Train 2
Train 3
Train 1
Train 2 5.0
5.0
5.0
4.5
4.5
65.7 Sempra Energy (50.2%), Engie (16.6%), Mitsui & Company (16.6%), Japan LNG Investment, LLC, a joint venture formed by Mitsubishi Corporation and Nippon Yusen Kabushiki Kaisha (16.6%).
Corpus Christi Liquefaction, LLC is a wholly owned subsidiary of Cheniere Energy, Inc. Early 2018
Mid 2018
End 2018
Q1, 2019
Q2, 2019
z Cheniere’s Sabine Pass
LNG paved the way for US exports.

economic benefits than corresponding cases with limited exports.”
For a long while the big question was: how large an LNG exporter would the US become? There were many interested parties, among them: consumers of gas in the US, some of whom feared that large-scale exports would drive up prices; LNG buyers, who hoped that US LNG could be a cheaper alternative to supplies from elsewhere; and the sponsors of proposed LNG projects in other countries, who worried that US LNG would amount to tough competition.
A clearer picture
Today, the answer looks pretty clear. As Table 2 shows, five projects have taken FID and begun construction, with aggregate capacity amounting to an astonishing 65.7 mtpa (this number has been changing slightly over time as projects announce new capacity figures for their trains, based on more detailed engineering).
Indeed, between August 2014 and June 2015, 47.7 mtpa of LNG capacity was sanctioned in the US – smashing even the record set by Australia in 2011/12.
Sabine Pass is currently commissioning its first of five trains, with a cool-down cargo already having arrived, and start up was due in late February or March. The project’s second train is expected to start up later this year.
There will then be a bit of a lull – because of the de facto moratorium on approvals imposed by the DoE after the Cheniere Energy approval – so that the next project to come on stream, Cameron LNG, is not due to do so until 2018, a year of very rapid growth as most of the other projects also start up trains. All the trains are due to have started up by 2019.
As for the lengthy queue of other projects, few are now expected to reach fruition for the same reasons that no more Australian FIDs are likely for some time, unless individual companies take a strategic decision to move ahead despite unfavourable-looking economics.
In short, the oil price collapse and the looming LNG glut together mean that we are unlikely to see capacity rise much higher than the 65.7 mtpa currently under construction for some time – though large uncertainties remain, not least because market development will depend to a large extent on policy decisions that have yet to be taken. For example, it will be some time before the full impacts of the COP 21 Paris Agreement on climate start to become clear (see article on pages 100-108).
Moreover, when new projects do start to move ahead in the US, the frontrunners are likely to be expansions of the projects already under construction, several of which already have permits – or have begun the permitting process – for more trains.
Ch … Ch … Ch … Ch … Changes
The significance of US LNG exports stems not just from the impressive volumes due to come on stream but arguably, and more importantly, from the new commercial models that have been developed for these projects.
The business model that Cheniere has developed for its liquefaction capacity in the US has involved signing sale and purchase agreements with customers under which they pay a fee for capacity whether they use it or not. If they choose to use it, they pay a Henry Hub-related price for the necessary gas feedstock. If they choose not to use it, they do not pay for gas but still pay the capacity fee. Other US projects have gone for tolling models, which are similar in their effect in that they pass gas price risk to the buyers.
“That was successful,” says Charif Souki, who until recently was CEO of Cheniere, “and it put us in a position where we were able to sanction seven trains based on that model, and other people were able to follow with a bunch of trains of their own.
“That change in the existing business model brought its own issues. The first and most important one is it adds dramatically to the liquidity in the market. And, if you add liquidity to the market, then the consumer starts thinking, “Do I really need to enter into a 20-year contract, or can I rely on the market?”
“We are in that transition phase now, where yet another business model needs to be developed because the liquidity is sufficient. You can probably, with price signals, attract enough natural gas if you’re a utility, on a global basis, certainly for the next five years with all the new trains that are coming from Australia and the US – and maybe for longer than that.”
Quite how the dynamics of LNG trading will evolve over coming years is hard to say but it is reasonable to assume that some of the rigidities which restricted flexibility in the past will continue to become less rigid or disappear entirely – an obvious example being contract clauses that restricted the ability of buyers to send LNG to destinations other than specified in long-term SPAs.
Pricing mechanisms also look set to change, with oil indexation looking less and less rational in a world where gas competes more with coal than it does with oil, notably in electricity generation. Interestingly, people’s thinking has already been changed by the development of US LNG exports, long before a single drop of LNG left for foreign shores – and the changes are far from over.
If anything, the reality of physical LNG deliveries will accelerate the rate of change, as people realize and adapt to new possibilities.
Alex Forbes is an independent journalist and consultant who has been reporting on energy developments and analysing trends for three decades.
