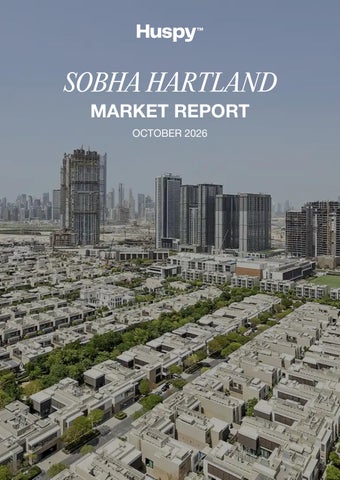
SOBHA HARTLAND MARKET REPORT OCTOBER 2026
SOBHA HARTLAND / OCTOBER 2026
OCTOBER AT A GLANCE Sobha Hartland | Residential sales
REGISTERED SALES
MEDIAN SALE PRICE
APARTMENT AED / SQ FT
87
AED 1.55M
2,024
-13.0% month-on-month
-18.2% month-on-month
+2.5% month-on-month
FEWER SALES. FIRMER PRICE PER SQUARE FOOT. October recorded 87 home sales: 86 apartments and 1 villa. The median home sale price was AED 1.55M; the apartment median price per sq ft rose 2.5% to AED 2,024.
Sales totals and median sale prices cover apartments and villas. AED / sq ft reflects apartments only. Land sales are excluded. Medians reflect sale mix, not a same-home index.
DLD Derived data
02
SOBHA HARTLAND / OCTOBER 2026
90-DAY MARKET TRENDS 3 August - 31 October 2026 | Three equal 30-day periods
RESIDENTIAL SALES
APARTMENT AED / SQ FT
263
1,988
257 apartments and 6 villas
Median across 257 apartment sales
APARTMENT PRICE PER SQUARE FOOT Apartment median AED / sq ft | Axis starts at 1,600
2,400
1,974
1,970
3 Aug - 1 Sep
2 Sep - 1 Oct
2,024
2,000
1,600
REGISTERED SALES
+7.4%: final vs first 30 days
95 81
3 Aug - 1 Sep
2 - 31 Oct
2 Sep - 1 Oct
87
2 - 31 Oct
Price points use apartments; sales counts include apartments and villas. Each period covers 30 days, within the 90-day window.
DLD Derived data
03
SOBHA HARTLAND / OCTOBER 2026
PRICES & TRANSACTIONS November 2023 - October 2026 | 36 complete months
APARTMENT PRICE PER SQUARE FOOT Apartment median AED / sq ft | Axis starts at 1,800
2,200
2,138
2,100
2,024 2,000
1,913 1,900
1,800 Nov 23
May 24
Nov 24
May 25
Nov 25
May 26
Oct 26
REGISTERED SALES Residential monthly transaction count | Zero-based scale
500
271 250 87 0 Nov 23
May 24
Nov 24
May 25
Nov 25
May 26
Oct 26
36 complete months; 4,459 home sales, including 4,377 apartments. All months have a median. History through July is archived; August-October is refreshed. Sale mix affects medians.
DLD Derived data
04
SOBHA HARTLAND / OCTOBER 2026
SALES & RENTAL BENCHMARKS 3 August - 31 October 2026 | Apartments
1-2 BEDROOM HOMES LEAD One- and two-bedroom apartments accounted for 225 of the 257 sales recorded across the 90-day period. Studio
3.1%
1 bedroom
51.8%
2 bedrooms
35.8%
3+ bedrooms
9.3%
88% 1-2 BEDROOMS
PRICE & RENT BY BEDROOM MEDIAN SALE PRICE / AED MILLIONS
Studio
MEDIAN ANNUAL RENT
AED 63,000
0.98
8 sales
1 bedroom
62 leases
AED 85,000
1.36
133 sales
2 bedrooms
1014 leases
AED 135,000
2.39
92 sales
3+ bedrooms 24 sales
506 leases
3.45
AED 200,000 146 leases
Rent medians use 365/366-day registered leases, including new contracts and renewals. Sales and rents are separate samples. Medians with fewer than five records are withheld.
DLD Derived data
05
SOBHA HARTLAND / OCTOBER 2026
TOP-SELLING TOWERS & BUILDINGS 3 August - 31 October 2026 | Apartments TOWER / BUILDING
SALES
Crest Grande
47
Sobha Creek Vista Heights Tower A
22
Sobha Creek Vistas Tower A
16
Sobha Hartland Waves
16
Sobha Creek Vistas Reserve
14
The Crest Tower B
14
Apartment source locations; two buildings tie for fifth place.
HIGHEST 90-DAY RESIDENTIAL TRANSACTION
AED 25,000,000 SOBHA HARTLAND ESTATES TOWNHOUSES 5 bedrooms | 7,704 sq ft built-up | 8,028 sq ft plot 10 August 2026 | Ready | Source type: Villa
LEADING SALES ACTIVITY Crest Grande led with 47 sales, accounting for 18.3% of the 257 apartment transactions recorded across the 90-day period.
DLD Derived data
06
SOBHA HARTLAND / OCTOBER 2026
RECENT TRANSACTIONS Selected October registrations | Residential The seven most recent residential transactions by registration date, with higher-value sales shown first where dates match.
DATE / 2026
SOURCE LOCATION
BEDS
PRICE / AED
STATUS
30 Oct
Crest Grande
2
2,850,000
Ready
30 Oct
Sobha Hartland Waves Opulence
1
1,950,000
Ready
30 Oct
The Crest Tower C
1
1,115,000
Ready
30 Oct
Sobha Hartland Waves
1
1,060,000
Ready
29 Oct
Sobha Creek Vista Heights Tower A
2
2,014,260
Off-plan
29 Oct
Sobha Hartland Waves
2
1,720,000
Ready
28 Oct
Sobha Creek Vista Heights Tower A
2
2,000,000
Off-plan
COMPARE LIKE WITH LIKE Floor level, layout, views, condition and completion status can change pricing materially within the same bedroom category. These are registered sales, not asking prices.
DLD Derived data
07
YOUR NEXT MOVE STARTS HERE. Find your next home. Explore your mortgage options.
REAL ESTATE
MORTGAGES
huspy.com/ae
Explore financing
SOBHA HARTLAND / OCTOBER 2026
HUSPY MARKET REPORT