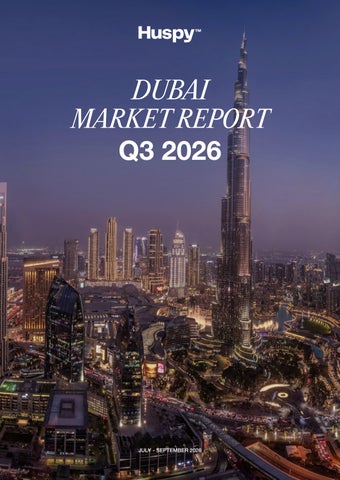
DUBAI MARKET REPORT
Q3 2026
JULY - SEPTEMBER 2026
Q3 2026 / DUBAI
THE QUARTER IN CONTEXT
DUBAI Dubai's residential market became more selective in Q3. The quarter brought slower overall trading alongside firmer activity in completed homes. Differences between new launches, ready stock and neighbourhoods make a single citywide number an incomplete guide to an individual property. [1, 2]
34,500
AED 70.8bn
-4%
-14%
Residential transactions
Residential sales value
Transaction count QoQ
Sales value QoQ
[1] Savills, Dubai Residential Market, Q3 2026; figures rounded. [2] Betterhomes, Q3 2026. This report uses residential coverage rather than all-property totals.
01
Q3 2026 / DUBAI
DIFFERENT COMMUNITIES, DIFFERENT DRIVERS
EMIRATE HIGHLIGHTS Dubai South 5,322 home sales in Projectory's sample. Azizi Venice accounted for 3,972 transactions citywide, illustrating the influence one development can have on reported activity. [3]
Jumeirah Village Circle 2,430 home sales in the same sample. Tower-level specifications, handover timing and service charges remain useful checks when comparing competing listings. [3]
Downtown Jebel Ali 1,830 home sales in the sample. Assess how much of an area's trading comes from a specific launch before treating the district average as a resale benchmark. [3]
Palm Jumeirah & prime communities Palm Jumeirah led secondary prime sales in Betterhomes' review, followed by Jumeirah Golf Estates and Dubai Hills Estate. Prime was defined as homes above AED 15m. [2]
[3] Projectory Research, DLD home-sale analysis, 16 Oct 2026; 34,002-sale sample. [2] Betterhomes Q3 2026. Source samples are distinct; area commentary is editorial interpretation.
02
Q3 2026 / DUBAI
PRICES AND RENTS
MARKET SNAPSHOT 1,404
1,638
404
Apartment sale AED / sq ft
Villa / townhouse AED / sq ft
Prime sales above AED 15m
September sale-price medians were 2.2% higher year-on-year for apartments and 4.1% higher for villas/townhouses in Betterhomes' analysis. [2]
Selected market indicators INDICATOR
CHANGE
COMPARISON
Apartment median rent
-3.8%
June to Sept 2026
Villa / townhouse median rent
-2.3%
June to Sept 2026
Dubai Marina apartment prices
+3.7%
Quarterly change
Changes in medians reflect the homes transacted. Use recent, comparable leases to assess a specific unit's rental potential, with service charges and operating costs included in the calculation.
[2] Betterhomes Q3 2026, published 15 Oct 2026. Sale-price medians above are September readings, not full-quarter averages. Rent changes compare June and September.
03
Q3 2026 / DUBAI
RESIDENTIAL VALUE AND MARKET MIX
SALES ANALYSIS Savills' residential series shows how total sales value evolved over five quarters. Off-plan value was AED 45.7bn in Q3; ready-home value was AED 25.1bn, compared with AED 21.3bn in Q2. [1]
Sales value (AED bn) 132.2
128.0
131.2
120
82.6 70.8
80
40
0
Q3 2025
Q4 2025
Q1 2026
Q2 2026
Q3 2026
Q3 sales value by registration status
Off-plan 64.5%
Ready 35.5%
Shares calculated from the rounded values above. The ready segment's improved contribution is a reason to examine the two markets separately.
[1] Savills Q3 2026. Residential sales values; AED bn. Ready/off-plan is a registration distinction and should not be assumed to equal resale/developer sales.
04
Q3 2026 / DUBAI
DEMAND, LAUNCH ACTIVITY AND SUPPLY
RECENT MARKET SIGNALS More activity at lower ticket sizes Projectory's DLD sample found that 41.4% of home sales were below AED 1m, up from 35.1% in Q2. A changing price mix can pull down the median without an equivalent change in every home's value. [3]
Completed homes gained share Ready homes represented 27.6% of transactions in the same sample, up from 21.6%. This supports a closer look at completed stock alongside off-plan opportunities. [3]
Supply remains a variable to watch Savills identifies more than 525,000 homes scheduled for 2027-2030. Scheduled supply is a pipeline, not a guarantee of completions on those dates. [1]
THE INTERPRETATION
A lower total sales value can reflect smaller homes, fewer premium transactions or a different launch mix. Pair the market headline with building-level evidence, a realistic leasing assumption and the buyer's intended holding period.
[3] Projectory, 16 Oct 2026, filtered DLD home-sale sample; plots and whole assets excluded. [1] Savills Q3 2026 supply estimate. Pipeline figures are forecasts.
05
Q3 2026 / DUBAI
A FRAMEWORK FOR THE NEXT QUARTER
STRATEGIC INVESTMENTS Select the property around the purpose of the purchase. The same market can offer very different outcomes for an owner-occupier, an income buyer and a buyer planning to hold through construction.
BUYER FOCUS
FIRST CHECK
DECISION TEST
Ready homes
Inspect the asset and verify the current lease.
Compare net income after service charges, vacancy and maintenance.
Off-plan homes
Map every payment to available cash.
Review construction progress, completion timing and competing supply.
Prime homes
Test the premium against close comparables.
Assess view, layout, scarcity and the depth of the resale market.
What to watch in Q4 Track whether ready-home demand continues to offset slower launches. Watch the balance between completions and leasing absorption in the exact community being considered.
Editorial due-diligence framework, not a property recommendation or return forecast.
06
Q3 2026 / DUBAI
HUSPY
FROM SEARCH TO HOME
ONE CONNECTED JOURNEY 01
02
03
Find the right fit
Compare the options
Plan the financing
Define your budget, preferred location, space needs and purchase timeline.
Review properties with market evidence and a clear view of the total cost.
Explore mortgage options and prepare the documents needed for the application.
Huspy service information: huspy.com. Financing remains subject to lender criteria and approval. Image Photography supplied supplied for thisinreport. the reference report.
07
TRUSTED BY 15,000+ HOMEBUYERS From finding the perfect property to securing the best mortgage, we make every step simple.
MORTGAGES
REAL ESTATE
huspy.com/ae/mortgage
huspy.com/ae/projects