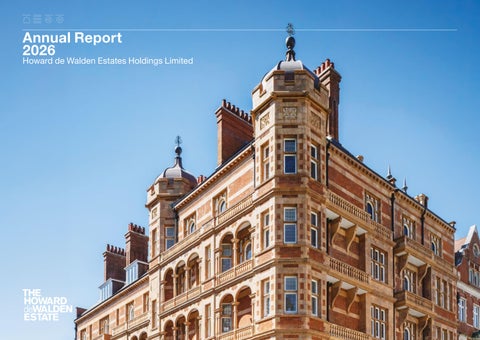
Annual Report 2026
Howard de Walden Estates Holdings Limited
2
The Howard de Walden Estate Annual Report 2026 Strategic report
1 Harley Street (rear).
Governance
Howard de Walden Estates Holdings Limited The Howard de Walden Estate 23 Queen Anne Street London W1G 9DL Contact us: +44 (0)20 7580 3163 enquiries@hdwe.co.uk hdwe.co.uk Company registered number 06439246
For more information please visit our website: www.hdwe.co.uk
Financial statements
Strategic report Our year in review Our business Chief Executive’s statement Property portfolio overview – Healthcare – Residential – Office – Retail Financial performance Principal risks and uncertainties Sustainability Our people Our community
3 4 6 9 11 12 13 14 15 16 21 24 26
Governance Officers and professional advisers Governance Section 172 statement Directors’ report Independent auditor’s report
30 31 33 35 37
Financial statements Group Statement of Comprehensive Income Group Statement of Financial Position Group Statement of Changes in Equity Group Statement of Cash Flows Company Statement of Financial Position Company Statement of Changes in Equity Notes to the Accounts
40 41 42 43 44 45 46
Additional information Five year summary Definitions
66 67
3
The Howard de Walden Estate Annual Report 2026 Strategic report
Governance
Financial statements
“This year’s performance reflects the resilience of the portfolio and strength of our location.”
Our year in review
Sir William Proby Chairman 2026 review
Operational highlights
Performance highlights
This has been a year of considerable progress for the Group. In a challenging economic environment, the portfolio has demonstrated its quality, resilience and enduring appeal, underpinned by disciplined investment, active management and the strength of its core location.
New lettings
Rental income
Investment property value
2025: £39.4m
2025: £164.1m 9.3% (2025: 7.8%)
2025: £4,273.3m 5.8% (2025: 2.5%)
For the year ended 31 March 2026, turnover increased by 9.6% to £180.8 million, revenue profit before tax rose by 27.5% to £96.5 million and investment property values grew by 5.8%. These results reflect high occupancy, rental growth and sustained demand across our estate.
Weighted average unexpired lease term (WAULT)
Marylebone Village and the Harley Street Health District remain central to our strategy and continued to perform well. Focused investment, careful curation and strong occupier demand supported progress across all sectors.
Number of new leases
External challenges remain, but with its conservative leverage and strong liquidity the Group is well positioned to continue delivering value for shareholders.
£41.8m
19.3 years 2025: 16.2 years
652
£179.4m 2026 2025 2024 2023 2022
£4,520.0m
179.4 164.1 152.2 147.8 135.4
Shareholders’ funds
Revenue profit before tax*
2025: £2,889.0m 7.0% (2025: 2.9%)
2025: £75.7m 27.5% (2025: 1.5%)
£3,091.5m
4,520.0 4,273.3 4,168.4 4,449.1 4,635.8
£96.5m
* Revenue profit before tax is the Group’s preferred measure of profitability. Calculation on page 15.
2025: 774
Energy intensity (tCO2e/m2)
2026 2025 2024 2023 2022
2025: 0.035
Gearing**
0.025
2026 2025 2024 2023 2022
3,091.5 2,889.0 2,806.9 3,071.1 3,191.2
See financial performance in full on page 15.
19.3%
2025: 21.1% 8.6% (2025: 1.9%) ** G earing is the proportion of the Group’s net assets funded by net debt. 2026 2025 2024 2023 2022
2026 2025 2024 2023 2022
19.3 21.1 21.5 18.0 17.9
96.5 75.7 74.6 74.9 64.2
4
The Howard de Walden Estate Annual Report 2026 Strategic report
Our business
Governance
Financial statements
Howard de Walden Estates Holdings Limited (‘the Company’) and its wholly owned entities (‘Howard de Walden’, ‘the Group’) manage a portfolio of over 800 property interests, the majority of which are freehold-owned, in a 95 acre area of Marylebone, central London. The Group oversees a diverse community of residents, businesses and amenities, including Marylebone Village’s retail and leisure offering and world-class healthcare providers in the Harley Street Health District. The Group is beneficially owned by members of the Howard de Walden family (‘the Family’) and the estate has been under the Family’s control since 1879. Howard de Walden aligns shareholder prosperity with the wellbeing of the community, the environment and its other key stakeholders.
Our purpose To create the setting for Marylebone to flourish.
Our mission To enhance the community through our stewardship, service and unique offering. When you are here, we want you to feel part of something exceptional.
Our values Collaboration Cultivating great relationships with customers, colleagues, community and other stakeholders. Responsiveness Approachable and partnering with our stakeholders. Innovation We offer buildings and spaces that provide modern‑day amenities, designed and suited to our customers’ lives and livelihoods. Excellence We want Marylebone to continue to be known as a fantastic place to live, visit and do business. Inclusiveness We recognise that diverse and inclusive businesses grow prosperity.
Our strategic objectives Grow rental income and efficiently manage expenditure. Provide property and services that customers want. Avoid property obsolescence and plan for net zero carbon emissions by 2040. Diversify our property income, where possible. Make organisational and operational improvements to deliver higher performance.
Our culture and behaviours We take a long-term approach in everything we do. We are respectful to each other, the community and our valued stakeholders. We support and empower each other and continue to learn while connecting people and places. We take pride in everything we do.
5
The Howard de Walden Estate Annual Report 2026 Strategic report
Governance
Financial statements
The Howard de Walden Estate
Ownership boundary in the context of central London
REGENT’S PARK
Marylebone
Edgware Road
Euston
Baker Street
King’s Cross St Pancras International (Eurostar)
Regent’s Park MARYLEBONE ROAD Paddington ED
Great Portland Street
AR GW
Paddington
Fitzrovia
REG
Marylebone
ER OA D
Edgw are R oad
Marble Arch
Mary lebon e
ENT
’S PA
RK
Bake r Stre et MARYLE
BONE RO AD
Regent’s Park
OXFORD STREET
PORTLAND PLACE
WEYMOUTH STREET
STREET
NEW CAVENDISH STREET WIMPOLE STREET
WELBECK STREET
HYDE PARK
Paddington Street Gardens
E HIGH
Mayfair
EBON
Soho
HARLEY STREET
DEVONSHIRE STREET
BAKER STREET
Padd ingto n
Oxford Circus
MARYL
Bond Street
QUEEN ANNE STREET
Howard de Walden Head office WIGMORE STREET
Marb le Ar ch
GREEN PARK
ST JAMES’S PARK
Cavendish Square Gardens OXFORD STR EET
HYD
E PA
RK
Bond Oxfor Stree d Cir t cus Bond SEstate Howard de Walden boundary treet Hano Bond Stree Squa ver t re Gros v e n or Sq
Grea Street Portlan d t
6
The Howard de Walden Estate Annual Report 2026 Strategic report
Governance
Financial statements
“Our continued positive performance reflects the strength of our long-term strategy, the resilience of our portfolio, and our commitment to disciplined investment.”
Chief Executive’s statement
Mark Kildea Chief Executive
Overview This year delivered exceptional financial and operational performance. Although the uncertain economic and geopolitical backdrop continued, our long-term focus, disciplined investment approach and the dedication of our people have enabled us to make significant progress. Our portfolio benefits from its unique concentration in central London, together with the strength of our dual destination brands, Marylebone Village and the Harley Street Health District. Demand across much of the portfolio was robust throughout the year and combined with the successful execution of our asset management and investment programmes, resulted in significant growth in underlying profit. The fundamentals of our markets remain encouraging. Demand for prime central London space continues to outstrip supply in key segments, particularly in healthcare, residential and best-in-class workspaces. Our long-term approach to asset management and development ensures we are well positioned to capture this demand. Our balance sheet remains robust, supported by rarely available premium assets with long-dated financing at fixed rates. With conservative leverage and substantial liquidity, we remain well positioned to pursue investment opportunities and continue delivering our strategic objectives. Our financial strength allows us to maintain a
Marylebone Village Marylebone Village continues to benefit from strong brand recognition and a carefully curated occupier mix, supporting consistent performance across our Retail, Office and Residential sectors. Our Retail portfolio has continued to perform strongly, with several new lettings and renewals enhancing and reinforcing Marylebone Village as a leading London lifestyle destination. Demand from both established brands and independent operators remains healthy. long‑term perspective, providing resilience through economic cycles, and gives us the flexibility to continue investing in our core portfolio while pursuing strategic opportunities as they arise. Operational and financial performance Rental income grew strongly during the year, underpinned by high occupancy levels and sustained occupier demand across all sectors.
The Residential portfolio continues to attract a diverse occupier base who add to the vibrancy of the village seven days a week. Our in-house lettings capability continues to outperform, securing most of our deals and renewals, as well as recording best‑in‑sector ratings of customer satisfaction. This is buttressed by a programme of high‑quality refurbishments designed to meet modern living standards and sustainability requirements.
Turnover increased by 9.6% to £180.8 million, while revenue profit before tax grew by 27.5% to £96.5 million. These results reflect strong leasing performance, rental growth across our core sectors and the benefits of investments and decisions made over recent years to upgrade and reposition our buildings. Investment property values increased by 5.8% during the year, driven largely by rental increases, contributing to a total accounting return of 8.7%.
In the Office sector, we have seen continued demand for flexible and high-quality workspace alongside a renewed demand for traditional leases. Elmtree, our flexible office offering, has expanded further following its successful launch, reflecting structural shifts in occupier requirements. Our strategy will be to further expand the Elmtree product in line with market demand and offer longer lease structures for mature businesses requiring greater security of location.
Harley Street Health District The Harley Street Health District continues to be a major strategic focus. Building on the momentum of recent years, the district has seen growing interest from a wide range of healthcare providers, clinicians and health technology businesses. We continue to build upon the district’s position as a globally recognised centre for healthcare excellence and innovation. During the year we continued to invest in new clinical, diagnostic and health technology facilities, supporting the growth of preventative, technology‑enabled and patient‑centred healthcare. These investments strengthen the district’s global reputation and create opportunities for long‑term sustainable growth. Hale House, our hub for HealthTech, has quickly established itself as an important part of this ecosystem, and we continue to assess opportunities to further enhance every aspect of our whole-health district. Demand for clinical and health-related space remains strong, driven by the shift to preventative care, innovation in healthcare delivery and ongoing pressures on public health systems. Our long-term ambition is to be the world’s leading location for independent healthcare, integrating clinical space, research, diagnostics and preventative care.
7
The Howard de Walden Estate Annual Report 2026 Strategic report
Chief Executive’s statement continued Portfolio activity and investment We continue to invest significantly in the fabric of our estate to modernise where required and add where we can unlock value. Acquisitions and disposals are aligned to the strategic objectives of growing the Marylebone Village and Harley Street Health District brands and complementing our existing portfolio. Our refurbishment, sustainability and placemaking programmes are enhancing customer experience, improving environmental performance and future‑proofing our portfolio. Sustainability remains a fundamental consideration in every investment decision we make, helping us meet regulatory requirements while creating more resilient and attractive buildings. This year’s 18% reduction in carbon emissions underlines the progress made in this vital consideration. Outlook Our focus remains on managing our portfolio with a long-term perspective, creating exceptional places that attract leading businesses, healthcare providers, residents and visitors while ensuring the estate evolves to meet changing occupier needs. While economic growth has been weak, the fundamentals underpinning our portfolio are strong and support the strategy. We expect continued demand for high‑quality, well-located space across all sectors, particularly in Healthcare, Office and Residential. At the same time, we remain mindful of the constraints from external risks, including economic uncertainty and cost pressures. The relentless execution of our strategy, combined with the quality of our portfolio, our robust balance sheet and the commitment of our team, position the business well to deliver sustainable long‑term value through future property and economic cycles.
I would like to take this opportunity to thank all our employees for their hard work and dedication over the last 12 months in exceeding our key measures of financial and operational performance. I would also like to thank our shareholders and our Board of Directors who have been extremely supportive in shaping delivery of our strategy over the last few years. Approval The Strategic report, covering pages 3 to 29, was approved by the Board of Directors on 12 August 2026 and signed on its behalf by:
27.5% growth in revenue profit before tax
Mark Kildea Chief Executive
David Mellor, 14 New Cavendish Street.
Varley, 104 Marylebone High Street.
1 Harley Street (rear).
Governance
Financial statements
8
The Howard de Walden Estate Annual Report 2026 Strategic report
Governance
Financial statements
Our brands Our brands [TBC] Marylebone Village
Marylebone High Street.
Elmtree
Harley Street Health District
Hale House
9
The Howard de Walden Estate Annual Report 2026 Strategic report
Governance
Financial statements
“Rental growth has been underpinned by strong leasing, an excellent development pipeline and occupier retention.”
Property portfolio overview
Julian Best Executive Property Director
Market overview Last year saw central London office investment volumes recover from their 2024 low, but despite a surge in Q4, they remained below the 10-year average. However, the higher average lot size of investment transactions in 2025, with several in excess of £100 million, pointed to improving investor confidence. Liquidity remained selective, with capital focused on prime, well-priced assets and strong competition for best‑in‑class. Secondary assets continued to see limited demand but there are signs of renewed interest for unique opportunities. Recent years have all begun optimistically before encountering a macro-economic event that quelled demand and dampened broader sentiment. 2026 was no different. Fortunately, London remains one of the most attractive cities for foreign investment and our selective disposals capitalised on this. Geopolitical uncertainty and the UK’s economic position remains unsettling for the debt markets and continues to challenge growth, particularly in the development environment. Central London leasing activity started 2026 in line with the long-term average, reflecting continued occupier confidence despite uncertainty. Demand was led by larger, higher‑quality requirements, with record pre-letting activity and a notable rise from the technology sector, particularly AI. Speculative supply remains limited, with most 2026 deliveries pre-let or under offer. Grade A supply in core sub-markets continues to tighten, compounded by limited
development pipeline, and high occupier retention rates. Continued investment to ensure the portfolio remains fit for purpose and meets current and future occupier needs has supported demand, alongside targeted marketing for Marylebone Village and the Harley Street Health District.
development caused by challenging viability. However, Marylebone is likely to benefit from three large mixed-use office schemes along Oxford Street, which should increase working populations and thus demand for our amenities. Valuation At 31 March 2026, the Group’s investment properties were valued at £4,520.0 million, up 5.8%, or 3.2% on a like-for-like basis. Healthcare and Residential remain the largest sectors, valued at £1,728.0 million and £1,197.2 million respectively. The predominant driver was rental value and income, whereas yields remained broadly static compared with 2025. Portfolio Performance Total rent for the year was £179.4 million, up 9.3% on 2025. The portfolio delivered rental growth across all four main sectors, underpinned by strong leasing, an excellent
As forecast last year, office occupancy increased significantly. A multi-year investment strategy to deliver differentiated products for a broad range of occupier demand has increased enquiries and converted into successful lettings. Our co‑working brands, Elmtree and Hale House, continue to attract new occupiers to the area, with occupancy moving towards, or reaching, maturity. The strategy continues to identify buildings suited to co-working and aligned with market demand. Acquisitions, developments and disposals The Group’s strategy remains focused on growing long-term sustainable income across a diversified portfolio. Targeting existing properties with value-add opportunities continues to be successful, with several long‑lease acquisitions completed during the year that will enable assets to be repositioned for enhanced returns and support the Group’s strategic ambitions. Examples include the acquisitions of 64 Wimpole Street, occupied by the British Dental Association (BDA), and 37 Wimpole Street, occupied by the General Dental Council. Both are versatile 1950s assets that will be substantially
refurbished and repositioned for modern healthcare. The acquisition of 85 Harley Street represented a step to consolidate ownership of the Harley Street Clinic building occupied by HCA. The Group also completed and let the flagship development at 1 Harley Street. The building has been let to 10M Healthcare and will become a state-of-the-art ambulatory surgery centre. We continue to dispose of non-core buildings, typically assets on the estate’s periphery that do not support our strategic objectives or offer limited asset management opportunities. During the year, disposals generated £42.2 million, including £3.1 million from enfranchisements. These proceeds will be reinvested into the portfolio in line with our strategic objectives.
Julian Best Executive Property Director
10
The Howard de Walden Estate Annual Report 2026 Strategic report
Governance
Financial statements
Property portfolio overview continued Valuation by sector (%) 2026 (2025)
Valuation Healthcare Residential Office Retail Educational Other
14.5% (14.0%) 1.8% 0.4% (2.4%) (0.4%)
38.2% (37.0%)
18.5% (18.4%)
Healthcare Residential Office Retail Educational Other
Year ended 31 March 2026 £m
Year ended 31 March 2025 £m
Increase/ (decrease) £m
Change %
1,728.0 1,197.2 837.9 654.9 82.4 19.6
1,582.1 1,187.0 786.2 597.0 102.0 19.0
145.9 10.2 51.7 57.9 (19.6) 0.6
9.2% 0.9% 6.6% 9.7% (19.2)% 3.2%
4,520.0
4,273.3
246.7
5.8%
A more detailed overview of our four biggest sectors can be found on pages 11 to 14.
26.5% (27.8%)
Rental income by sector (%) 2026 (2025)
13.3% (14.1%) 3.4% 0.4% (4.0%) (0.4%)
19.7% (19.1%)
22.8% (23.5%)
40.4% (38.9%)
Rental income
2026 £m
2025 £m
Increase/ (decrease) £m
Change %
Healthcare Residential Office Retail Educational Other
72.5 40.9 35.3 23.9 6.1 0.7
63.8 38.6 31.4 23.2 6.5 0.6
8.7 2.3 3.9 0.7 (0.4) 0.1
13.6% 6.0% 12.4% 3.0% (6.2)% 16.7%
179.4
164.1
15.3
9.3%
11
The Howard de Walden Estate Annual Report 2026 Strategic report
Governance
Financial statements
Property portfolio overview continued
Healthcare
Healthcare income totalled £72.5 million, an increase of £8.7 million (+13.6%) against the previous year. The Healthcare portfolio value is £1,728.0 million, an increase of £145.9 million (+9.2%) compared to the prior year (+3.7% on a like-for-like basis). Of the total portfolio, Healthcare represents 40.4% of income and 38.2% of the total property values.
Percentage of rental income (%)
40.4% (38.9%)
£72.5m Rental income 2025: £63.8m
13.6%
Change in rental income 2025: 4.8%
£1,728.0m Valuation 2025: £1,582.1m
3.7%
Change in like-for-like valuation 2025:1.6%
The Healthcare portfolio remains our largest sector in both income and value terms. Occupancy levels have remained high all year round and the portfolio at year end was 96.0% occupied. Positive income growth has been achieved through the year from the continued letting of new space and the renewal of leases from existing occupiers, including a significant rent review on one of our largest buildings. The portfolio sits within the Harley Street Health District (HSHD), which is one of our two key brands, alongside Marylebone Village. The district continues to be a magnet for global healthcare, attracting international and domestic patients, world‑leading providers and strengthening London’s position as a destination for both care and innovation. As detailed in our impact report, published in June 2026, HSHD represents around 11.2% of the UK’s and 40% of London’s independent healthcare market. HSHD continues to be a centre of excellence for all aspects of healthcare, particularly cancer. Chemotherapy is the most common procedure, followed by diagnostics and cataract surgery. Our ambition is to continue to attract the best‑in‑class global practitioners to the district, alongside innovators, researchers, clinical trials and key healthcare enablers. The launch of Hale House in April 2025 has achieved its aim of attracting successful and growing HealthTech occupiers to HSHD. Our goal is to continue to bring innovators to the area,
and work with them and our larger providers to collaborate in innovation and research. The portfolio continues to be refreshed and updated to ensure buildings are modernised and meet the current and future requirements of healthcare operators. During the year, Bupa completed its acquisition of King Edward VII’s Hospital, strengthening the range of services and treatments offered to patients in the HSHD. Key lettings during the year have been to a wide range of healthcare disciplines, emphasising our focus on delivering a whole health ecosystem. New specialists include psychiatry and mental health, gynaecology, phobias, wellness, diagnostics, treatment for acute allergies and health assessments. One of our most recent flagship developments at 1 Harley Street was let to 10M Healthcare. The property will be transformed into a new £100 million ambulatory surgery centre,
due to open in 2027. It will offer high-quality same‑day surgical treatments across a range of specialities including orthopaedics, neurology, women’s health, cardiology, dermatology, and ear, nose and throat (ENT).
96.0% 19a Cavendish Square.
5-10 Beaumont Street.
77-78 Wimpole Street.
20 Devonshire Place.
50-52 New Cavendish Street.
occupancy as at 31 March 2026
12
The Howard de Walden Estate Annual Report 2026 Strategic report
Governance
Financial statements
Property portfolio overview continued
Residential Percentage of rental income (%)
22.8% (23.5%)
£40.9m Rental income 2025: £38.6m
6.0%
Change in rental income 2025: 10.0%
£1,197.2m Valuation 2025: £1,187.0m
0.7%
Residential income totalled £40.9 million, an increase of £2.3 million (+6.0%) against the previous year. The Residential portfolio value is £1,197.2 million, an increase of £10.2 million (+0.9%) compared to the prior year (+0.7% on a like-for-like basis). Of the total portfolio, Residential represents 22.8% of income and 26.5% of total portfolio value. Our Residential portfolio is a key component of Marylebone Village and provides excellent diversification alongside our commercial assets. The portfolio consists of over 800 high‑quality homes of various sizes and price points. This allows us to attract and retain a diverse population who bring a vibrancy to Marylebone Village seven days a week. The attractiveness of the location, together with the amenity-rich retail offering, high-quality units and responsive management team, ensures that customers feel Marylebone Village is a place they wish to reside. As a result, occupancy levels remained high all year round, ending the year at 98.6%.
Rent collection rate of
98.0% 32 Devonshire Place.
We continue to invest in our portfolio through a rolling refurbishment and refresh programme, ensuring that the quality of properties remains at the market levels. This provides the opportunity to upgrade services and finishes and meet sustainability and legislative requirements, with a focus on degassing properties and units as they become available. Examples of key refurbishments during the year included: — 1 Marylebone Street — 13 Devonshire Close — 32 Devonshire Place — 3 Bulstrode Street — 20 Wimpole Street — Bentinck Mansions — 126 Harley Street
9 Bentinck Mansions.
20 Wimpole Street.
13 Devonshire Close.
126 Harley Street.
Change in like-for-like valuation 2025: 0.2%
13
The Howard de Walden Estate Annual Report 2026 Strategic report
Governance
Financial statements
Property portfolio overview continued
Office Percentage of rental income (%)
19.7% (19.1%)
£35.3m Rental income 2025: £31.4m
12.4%
Change in rental income 2025: 16.3%
£837.9m Valuation 2025: £786.2m
2.2%
Office income totalled £35.3 million, an increase of £3.9 million (+12.4%) against the previous year. The Office portfolio value is £837.9 million, an increase of £51.7 million (+6.6%) compared to the prior year (+2.2% on a like-for-like basis). Of the total portfolio, Office represents 19.7% of income and 18.5% of total property values. There was strong leasing momentum throughout the year, with increased demand driven by the quality of product and the desirability of the area. The strategic investments made over previous years have ensured that the Office portfolio is meeting the needs of occupiers. Office occupancy levels continued to grow, rising to 97.5% at year end, up from 85.6% in April 2025. This increased demand for space, alongside positive rental growth, has underpinned the valuation movement.
Key traditional lettings during the year included new occupiers who specialise in violins, allergies, strategic risk advisory, recruitment, financial services and consultancy. This demonstrates the area’s attractiveness to a wide array of customers with the potential to add value to Marylebone Village.
Key lettings during the year demonstrate the wide array of occupiers that are attracted to the area: — J&A Beare (violin specialists) Queen Anne Street — G3 Good Governance (strategic advisory) Portland Place — Antal International (global recruitment) Welbeck Street — Sampson Fielding (accountants) Wigmore Street — RIAA Barker Gillette (law firm) Cross Keys Close — HGH Consulting (planning consultancy) Welbeck Street
40
new leases signed in the year.
Our Office portfolio is an integral part of the Marylebone Village brand, alongside Retail and Residential. One of the defining characteristics of the village is that it brings people together to work, live, eat and shop. Office occupiers play a significant role within this community. The desirability of an amenity‑led, proactively managed area is evidenced by the high demand for space from existing and new occupiers. Our strategy is to offer a diversified range of space to meet the requirements of occupiers. As well as the more traditional single‑let model, we offer flexible workspace for office and HealthTech occupiers, including our Elmtree and Hale House products. Our flexible buildings now total five (three Elmtree and two Hale House), with future additions to this portfolio being considered, in line with occupational demands.
22 Cross Keys Close.
2 Bentinck Mews.
29 Queen Anne Street.
51 Welbeck Street.
Change in like-for-like valuation 2025:0.5%
14
The Howard de Walden Estate Annual Report 2026 Strategic report
Governance
Financial statements
Property portfolio overview continued
Retail Percentage of rental income (%)
13.3% (14.1%)
Retail income totalled £23.9 million, an increase of £0.7 million (+3.0%) against the previous year. The Retail portfolio value is £654.9 million, an increase of £57.9 million (+9.7%) compared to the prior year (+8.6% on a like-for-like basis). Of the total portfolio, Retail represents 13.3% of income and 14.5% of total property values. The Retail portfolio includes our retail, hospitality and leisure businesses. Central to our Marylebone Village brand, it continues to attract residents, workplace occupiers and shoppers. Income growth has been driven by strong demand for space within Marylebone Village with occupancy remaining high all year round. At year end, the portfolio was 94.8% let, with significant demand for the remaining space. Strong income growth has also been the key driver behind the valuation uplifts supported by footfall and occupier trading levels.
£23.9m
Marylebone Village offers a shopping point of difference to nearby retail locations found in central London. Our core aim is to ensure that we have a well-balanced and curated occupier mix, filled with vibrant and exciting traders, distinct from the mainstream high street. Highlights in the past year included welcoming Tekla to the High Street with its first UK store; womenswear brand Soeur also opened on the high street; Space NK upsized its footprint, leaving its previous store to be occupied by
With Nothing Underneath; the South African inspired restaurant KUDU opened its doors to much acclaim, while Waitrose underwent a full comprehensive refit.
10 Marylebone High Street.
83 Marylebone High Street.
Rental income 2025: £23.2m
94.8%
3.0%
occupancy.
Change in rental income 2025: 7.9%
£654.9m Valuation 2025: £597.0m
8.6%
Change in like-for-like valuation 2025: 5.4% 86 Marylebone High Street.
76 Marylebone High Street.
15
The Howard de Walden Estate Annual Report 2026 Strategic report
Governance
Financial statements
“Our strong results reflect the care we take in managing the estate, investing for the long term and supporting the continued appeal of Marylebone.”
Financial performance
Andrew Griffith Chief Financial Officer
Overview Turnover increased by 9.6% to £180.8 million (2025: £165.0 million) driven by strong rental growth across all sectors, with significant increases in the Healthcare (+13.6%) and Office (+12.4%) portfolios. Healthcare benefited from new lettings and lease renewals, while Office demand remained buoyant, reflecting the quality of the product and the area’s appeal. Sustained investment in Residential spaces delivered further year-on-year income growth (+6.0%), continuing the positive momentum seen in the prior year. Retail revenue also increased (+3.0%), reflecting strong occupier demand and its contribution to the area’s village-like character. The year-end development pipeline had an ERV of over £10 million per annum across all sectors and remains a key source of future income growth. Revenue profit before tax remains our key financial metric, as it excludes gains and losses on disposals and annual asset and liability revaluations. It increased by 27.5% to £96.5 million (2025: £75.7 million). Revenue profit before tax is grown by increasing rental income and managing operating and borrowing costs. This year, income rose by £15.3 million and property costs fell by £7.2 million, assisted by higher occupancy levels and lower refurbishment costs. Net finance costs decreased from £24.3 million to £23.7 million. The average amount borrowed was £670.1 million, an increase of £20.9 million from the previous
Financial performance Profit before tax Adjustments: Gain on revaluation of investment properties Profit on sale of investment properties Fair value loss/(gain) on derivative financial instruments Gain on foreign currency exchange*
Year ended 31 March 2026 £m
Year ended 31 March 2025 £m
335.8
172.0
(231.2) (7.8) 9.4 (9.7)
(87.0) (6.4) (0.1) (2.8)
96.5
75.7
Revenue profit before tax
*Year ended 31 March 2025 includes rounding of £0.1m where reporting converts £000 to £m.
year (2025: £649.2 million). The average rate paid on borrowing remained relatively flat, dropping slightly to 3.9% (2025: 4.0%). Headline profit before tax was £335.8 million (2025: £172.0 million), including revaluation gains of £231.2 million (2025: £87.0 million). The reconciliation to revenue profit before tax is set out in the table above. The total accounting return for the Group was 8.7% (2025: 4.7%). Balance sheet and borrowings The value of the property portfolio increased by 5.8% to £4,520.0 million (2025: £4,273.3 million). Shareholders’ funds increased by 7.0% to £3,091.5 million (2025: £2,889.0 million). Year-end borrowings increased from £638.3 million to £680.2 million (at forward contracted rates – see page 59), following a new £100.0 million private placement in July 2025 at a blended rate of 5.63% to
refinance maturing debt and provide additional investment capacity. Cash and cash equivalents at 31 March 2026 were £83.4 million (2025: £27.8 million), mostly held in a high interest-bearing bank account. These cash balances together with the undrawn £100.0 million revolving credit facility, in place until February 2032, provide significant financial headroom. At 31 March 2026, the Group’s average debt maturity was 12.1 years (2025: 12.4 years). The level of net borrowing to net assets (the gearing ratio) decreased from 21.1% to 19.3%. The Group’s low level of borrowing is comfortably supported by interest cover of 5.1 times (2025: 4.1 times). Distributions Distributions of £48.7 million (2025: £50.3 million) were paid to shareholders, comprising dividends
on ordinary shares of £48.7 million (2025: £46.3 million), and ‘A’ shares of £nil (2025: £4.0 million). Five-year financial performance The comparative figures below refer to the year ended 31 March 2022 as shown in the five-year financial performance table on page 66. Over the period, rental income increased by 32.5% from £135.4 million to £179.4 million. Revenue profit before tax increased by 50.3% from £64.2 million to £96.5 million. Investment property values decreased by 2.5% from £4,635.8 million to £4,520.0 million, while shareholders’ funds decreased by 3.1% from £3,191.2 million to £3,091.5 million.
Andrew Griffith Chief Financial Officer
16
The Howard de Walden Estate Annual Report 2026 Strategic report
Governance
Financial statements
Principal risks and uncertainties
Overview The Group is a long-term investor focused on high-quality real estate assets in Marylebone and seeks to enhance its reputation and grow rental income and profitability. The successful delivery of strategic objectives relies on the identification and management of principal risks and uncertainties, and is underpinned by organisational values which prioritise excellence, responsiveness, innovation, collaboration and inclusiveness. The Group is experiencing strong demand across all sectors; however, macroeconomic and geopolitical pressures are linked to inflation and interest rates which are impacting the Group, and its customers and supply chain. Shifts in trade policy, conflicts, regulatory changes, inflation and capital markets could continue to influence investor sentiment, financing costs, occupational demand and operating expenses, travel patterns, consumer behaviour and real estate valuations. Decarbonisation, leasing
polarisation and occupier expectations remain drivers of obsolescence risk which are pro-actively managed through strategic and operational objectives. The Group’s portfolio strategy and technology investment initiatives are designed to improve decision making while enhancing growth and returns in response to these challenges. The geographic concentration of the estate, exposure to property market cyclicality and operation of heritage buildings are accepted risks which are offset by maintaining a diverse portfolio in a prime location and carrying low financial risk. Risk management framework and process The diagram below outlines the Group’s risk management governance structure, which is aligned to a three lines of defence model for effective risk identification, management, monitoring, escalation and independent review. During the year, the risk management framework and processes were revised to accommodate structural alterations,
Risk management structure Board
Audit Committee
Risk Committee
Assurance
strengthen senior leadership oversight and promote greater collaboration. Business units (first line) escalate risks to the Senior Leadership Team (SLT) who collectively review risks and agree appropriate responses, ensuring a wider perspective. The assurance, risk and compliance team consolidates internal oversight from specialist areas such as health and safety, sustainability and IT (second line), providing updates to senior leadership and the Risk Committee as appropriate. External audits and independent reviews represent third line activities and key risks are reviewed twice yearly by the Risk Committee and reported to the Audit Committee. The Risk Committee also meets at least once per year to discuss future uncertainties. This structure ensures the Board has Group-wide and consistent visibility of material risks to strategic objectives. Principal risks and uncertainties The Group operates in a dynamic environment and is exposed to a range of risks and
The principal risks set out below reflect the Board’s current view of the most significant risks, taking into account changes to the external environment and the Group’s activities during the year. Each risk is accompanied by key controls and mitigations and an indication of any change in risk profile compared with the prior year. As a result of updates to the risk framework and a thorough stakeholder review, some risks have been slightly redefined or regrouped; however, the principal risks remain materially unchanged overall.
Principal risks Governance Identification Assessment Response Reporting Monitoring Assurance
Risk movement
1. Market, macroeconomics and geopolitics 2. C limate change, decarbonisation and building obsolescence 3. Strategic execution and resilience 4. Rental income and occupier default 5. Regulatory change and compliance 6. Operational resilience and optimisation of people resources 7. Health and safety 8. Cyber security and information protection Risk movement:
Business function leaders
uncertainties that could affect the delivery of its strategy, financial performance, business model and long‑term value. Effective identification, assessment and management of these risks is integral to how the Board oversees the business and protects the interests of stakeholders.
Increasing
Decreasing
No change
17
The Howard de Walden Estate Annual Report 2026 Strategic report
Governance
Financial statements
Principal risks and uncertainties continued 1. Market, macroeconomics and geopolitics
2. Climate change, decarbonisation and building obsolescence
3. Strategic execution and resilience
Description Long-term growth, capital value and resilience may be affected by adverse external conditions, including competition, inflation, interest rates, global conflict and market volatility. These can increase costs, reduce demand, affect income and returns, and weaken valuations, investment strategy and access to capital.
Description Failure to adapt the portfolio to physical and transition climate risks, and evolving occupier and regulatory requirements, could affect long term asset value, income and reputation. This may reduce demand, increase obsolescence and repositioning costs, create carbon costs and cause reputational harm.
Description Execution of the strategic plan, including acquisitions, disposals and development, may be affected by economic and political conditions, competition, structural market shifts, property cycles, or overexposure to sectors or key customers. Failure to identify, acquire, develop, refurbish or let suitable assets could affect returns, valuations and reputation.
Outlook Inflation, interest rates and geopolitical uncertainty remain challenging. Demand is strong across Marylebone and the Group’s sectors, particularly for quality, sustainable properties in desirable locations. This is positive but may increase polarisation risk for older assets and reinforces the need for disciplined capital allocation and delivery.
Outlook Climate risks must be addressed over both short and long‑term horizons. Regulatory and market expectations on energy performance and decarbonisation continue to evolve, while climate risk remains uncertain. Adapting heritage buildings is challenging and increases obsolescence risk.
Impact Higher development and operating costs, increased vacancies, slower rental growth, lower valuations and reduced ability to recycle capital.
Impact Assets may become non-compliant, weather-exposed or less attractive, leading to prolonged voids, reduced access to cost‑effective insurance or funding, unplanned capital expenditure and obsolescence.
Trend: Increasing
Key controls and mitigations • Board-approved strategy and capital allocation. • Diversified portfolio of high-quality properties and customers across and within sectors. • Conservative external borrowing with interest rate protection preferred and strong liquidity maintained. • Sufficient financial headroom is maintained. • Regular review of financial forecasts and budgets.
Outlook Delivering suitable products to market is critical to financial strength, income growth and avoiding obsolescence. Supported by a sound strategy, strong balance sheet and encouraging demand, the Group continues to pursue acquisitions and development while managing UK and US political and economic instability, regulatory change, planning pressures and supply chain challenges. Impact Challenges achieving target rents or returns, or delays to schemes, could defer income, increase costs and reduce returns.
Trend: No change
Trend: No change
Key controls and mitigations • Science‑based reduction targets and KPIs monitored and reported to the Board. • Net zero and climate considerations incorporated into investment and development decisions. • Compliance and net zero strategies incorporated into asset management plans for the managed portfolio. • Physical climate risks assessed with information available and considered in cyclical maintenance and asset planning. • Sustainable development framework with green certification targets, gas avoidance policy, and sustainability charter. • Green leases and supplier and occupier engagement. • Board level oversight over ESG performance.
Key controls and mitigations • Regular review of strategic plans, initiatives and asset plans. • Growth from investment and development in core locations and through lease renewals and regears. • Simplified sector strategies to allow agile response to customer demand. • Monitoring of portfolio balance and key customers. • Investment Committee and robust investment and project approval processes are in place. • Supplier onboarding and monitoring framework and fixed‑price contracts. • Large projects have dedicated project managers for governance and cost monitoring.
18
The Howard de Walden Estate Annual Report 2026 Strategic report
Governance
Financial statements
Principal risks and uncertainties continued 4. Rental income and occupier default
5. Regulatory change and compliance
6. Operational resilience and optimisation of people resources
Description Failure to adapt and maintain buildings to meet changing occupier needs could constrain market rents or create voids and obsolescence. Macroeconomic and affordability pressures may increase arrears or defaults, reducing rental income, asset values, cash flow and income growth.
Description Failure to maintain appropriate resources, skills, culture, controls and monitoring could result in non-compliance with legal and regulatory requirements.
Description Major events, including natural disasters, public health emergencies, utility failures, supply chain disruption, cyber incidents, civil unrest, serious crime or terrorism in central London, could threaten business continuity and resilience. Digital transformation, change readiness and recruiting and retaining skilled staff are also critical to operational success.
Outlook Demand for quality assets remains strong and voids are low, but macroeconomic pressures require active monitoring and engagement. Impact Increased management time for arrears, material income loss or higher incentives may be required. Trend: No change Key controls and mitigations • The portfolio is well diversified, avoiding overexposure to sectors, customer groups or single customer representation. • Focus on developing high‑quality properties in prime areas. • Quality occupiers, strong due diligence processes, deposits and guarantees, and ongoing monitoring. • Focus on customer retention, regular engagement and early intervention. • Active arrears management and in-house credit control. • Conservative borrowing and sufficient financial headroom maintained.
Outlook A dynamic regulatory pipeline across building safety, sustainability, tenancy reform and local government requirements continues to increase compliance and governance risk. Recent changes have affected energy efficiency, health and safety (H&S), leasehold and finance, with further changes expected, including implementation of the Building Safety Act, leasehold reform, Renters’ Rights Act and local policies. Impact Non-compliance could lead to scrutiny, enforcement, fines, increased costs, loss of licence to operate and reputational harm. Trend: No change Key controls and mitigations • Teams regularly scan the horizon for changes and stay informed with updates from relevant associations, advisors and peer groups. • Policies and procedures are updated in line with good practice, government guidance and advice from advisors. • Governance is delivered through Senior Leadership Team and the Risk and Audit Committees. • Regular policy updates and staff training. • Assurance activities in key areas. • External financial audit.
Outlook Many events are outside the Group’s control but could have severe stakeholder impacts. Preparedness remains a priority, supported by monitoring of internal and external risks. Staff turnover is stable and skills initiatives are progressing. A major digital transformation project to replace core systems has begun, supported by internal and external experts, including change management specialists. It aims to improve efficiency, data, costs and decarbonisation, but increases business-asusual risk during delivery and go-live, which is being closely monitored. Impact Events could disrupt operations, customers and suppliers, affect portfolio condition, reduce letting or retention capability and ultimately impact financial performance. The transformation project temporarily increases disruption risk as critical systems and people balance business-as-usual with project delivery. Trend: Increasing
Key controls and mitigations • Horizon scanning, crisis management and business continuity planning. • IT accreditations, network monitoring and disaster recovery planning. • Key supplier identification and monitoring. • Comprehensive insurance cover. • Clear articulation and encouragement of values and behaviours. • Succession planning and leadership development training. • Key roles and skills analysis. • Competitive employment packages. • Business projects and change projects are overseen by relevant groups and Executive Directors. • Skilled transformation project team and carefully mapped and managed risks.
19
The Howard de Walden Estate Annual Report 2026 Strategic report
Principal risks and uncertainties continued 7. Health and safety (H&S)
8. Cyber security and information protection
Description A serious H&S incident, accident or compliance failure at head office, a portfolio building or development site could harm people, damage property and reputation, and disrupt operations, including the ability to let buildings.
Description A cyberattack, material data loss, data integrity issue or system disruption could significantly affect business continuity, decisionmaking, income, cost recovery and reputation.
Outlook The Group is committed to stakeholder safety and H&S compliance. Development activity carries higher risk, particularly in occupied buildings and busy estate locations, while ongoing management and maintenance also present risks. A dynamic regulatory environment may further increase compliance risk as new requirements are interpreted and implemented. Impact Incidents or breaches could cause life-changing injury, fatality, significant property or environmental damage, fines or legal consequences for the Group and its Directors. Trend: No change Key controls and mitigations • Quarterly H&S Committee meetings to update on compliance and progress improvement opportunities. • Relevant policies and procedures, assurance activities and KPI reporting. • Qualified in house H&S team. • Third‑party site H&S audits. • Contractor accreditation monitoring scheme. • Construction phase plans and fire strategies submitted before projects start. • Near miss, incident and accident log and reporting. • Wellbeing initiatives in place for colleagues.
Outlook Cyber threats are increasing in sophistication and volume, while reliance on digital systems, technology and third-party providers increases operational and information risk. The Group continues to prioritise cyber security and invest in protective systems and technology. Impact Inadequate protection of infrastructure, systems and data could cause business disruption, personal or commercial data loss or compromise, regulatory penalties, legal claims and reputational damage. Trend: No change Key controls and mitigations • Active internal network monitoring and testing. • Robust policies and system access controls. • Disaster recovery plan and crisis management plans are in place. • Cyber Essentials Plus accreditation is maintained. • Periodic third‑party network penetration testing. • All staff are provided with regular awareness and training.
Governance
Financial statements
20
The Howard de Walden Estate Annual Report 2026 Strategic report
Tekla, 10 Marylebone High Street.
Governance
Financial statements
21
The Howard de Walden Estate Annual Report 2026 Strategic report
Governance
Financial statements
“Our deCarbon strategy focuses on high‑impact areas where we can drive the most meaningful change.”
Sustainability
Simon Tranter Head of Sustainability
High
2025-26 Carbon footprint by Scope
36.8% Downstream leased assets
Risk
57.6% Purchased goods & services 2.1% Electricity consumption
0.2% Employee commuting Low
1.7% Gas consumption 0.4% Refrigerants
1.2% Fuel and energy related activities
Low
Managing our buildings efficiently Objectives:
Scope 1 Scope 2 Scope 3
<0.1% Operational waste Operational control
deCarbon This year represented a step-change in progress under our sustainability strategy, deCarbon; turning intent into practical action. Examples of the momentum now developing across our business activities include the refresh of our sustainable development framework, an estate-wide sub-metering improvement project, trialling artificial intelligence to develop net zero carbon‑aligned improvement plans for our managed properties, and planning for the removal of 19 landlord‑controlled gas boiler systems.
0.1% Business travel
<0.1% Fuel for transport High
Our seven sustainability KPIs have supported carbon reductions across all three emissions scopes, through building energy efficiency and optimisation, the removal of gas systems, and stronger measurement of embodied carbon and supplier emissions. All landlord procured power and gas was 100% REGO and RGGO certified. In March 2026 we signed a five-year sleeved power purchase agreement, which means from April 2026 all landlord electricity is sourced directly from UK renewable energy providers. Our full results and methodology for our Scope 1, 2 and 3 emissions are provided on page 23, reporting a combined reduction of 18% across all three emissions scopes.
— Our buildings will be free from fossil fuels and will maximise renewable energy technology — Our managed buildings will perform in line with recognised energy performance standards — We will reduce the environmental footprint associated with our property management operations Emissions linked to occupied properties represents our second largest source of emissions (36.8%, 2026). We extended our AI‑driven pilot with MapMortar Ltd by onboarding 40 managed buildings where digital twins were generated for each building, utilising machine learning to simulate building energy profiles. We have identified interventions to reduce energy and carbon and meet minimum compliance obligations (e.g. EPCs) including optimisations, system upgrades and heat decarbonisation. This work builds on the 14 net zero carbon assessments completed under our commitment to Westminster City Council’s Sustainable City Charter. We have delivered 21% of the recommended short-term measures, including low cost and quick win solutions, minor building improvements to lighting, controls and monitoring capabilities. Next year we plan to develop internal guidance specifically to scale optimisation and energy management practices.
The phased replacement of fossil fuel heating systems with net zero carbon‑ready technologies is a key focus of our decarbonisation strategy. We have now established a structured approach to this transition, prioritising landlord-controlled heating systems alongside removing gas during refurbishments of occupied spaces. In the year we started work on establishing an estate-wide metering and monitoring improvement programme for existing assets and development projects. The programme will create a scalable framework to improve how energy and utility data are captured, analysed, and used to inform investment and operational decisions. We intend to establish technical design standards and procure a centralised
1 Portland Place: Delivering net zero carbon-aligned improvements Following a 2025 Net Zero Carbon Assessment, the building is now a strong example of how targeted refurbishment can transform operational performance. The refurbishment successfully removed gas from the building, transitioned operations to 100% renewable electricity, and improved the EPC profile from a range of E–C to an overall A. Operational energy performance was significantly reduced from a baseline of 180kWh/m²/yr (GIA) to a predicted 99kWh/m²/yr (GIA).
22
The Howard de Walden Estate Annual Report 2026 Strategic report
Governance
Financial statements
Sustainability continued platform for monitoring and reporting. Expected outcomes include improved visibility of energy and carbon performance, occupier billing based on measured consumption, stronger operational oversight, and performance‑led decision‑making. Delivering low carbon refurbishments and redevelopments Objectives: — Our refurbishment and redevelopment projects will achieve net zero carbon in operation — Our refurbishment and redevelopment projects will achieve net zero embodied carbon — All of our projects will align with the core principles of our sustainable development framework Our sustainable development framework (SDF) has guided sustainable design and construction decision-making across projects since 2022. In this period both market expectations and internal ambition for sustainable development have evolved. We have structured our requirements under five new sustainable development principles, which introduced categories for health and wellbeing, and climate adaptation. The updated SDF places greater emphasis on interventions that deliver low-carbon, energy‑efficient buildings, including measuring and understanding operational performance once assets are occupied. These principles are now reinforced through an enhanced project briefing process, enabling stakeholders to define how sustainability targets will be realised. We have improved monitoring throughout the design and construction stages, creating a clearer and more robust reporting process for tracking sustainability targets through each development stage.
Emissions from development activity, particularly embodied carbon, remain our largest source of carbon emissions (41%, 2026). We continue to prioritise emissions measurement using the RICS whole life carbon assessment methodology and use the QFlow data platform to record materials used in refurbishment projects. Our development of 76-78 Portland Place was reported last year to be taking part in the UK Net Zero Carbon Building Standard’s pilot programme. The building met both operational energy (96kWhe/m²/yr(GIA)) and embodied carbon (269kgCO2e/m²) limits for the corresponding year of development. The project has also obtained a Nabers design‑reviewed target rating of 4.5. Our current development at 1 Marylebone High Street is targeting a similar Design for Performance rating. Training and educating our colleagues Objectives: — Our people will be committed and understand the role they play in everything they do — Our people will develop the skills and competencies needed to innovate — Our people will recognise the benefits of being active leaders in sustainable development across our estate This year, we updated role-specific guidance for setting sustainability objectives within the annual appraisal process, with a particular focus on colleagues in our property management and projects teams. This was supported by a half-day training course for asset managers on economic, social and governance issues relating to real estate. We continued to build sustainability awareness across the business through e-learning modules along with internal presentations on utilities management and sustainability processes. Colleague engagement was strengthened through our annual sustainability webinar
Sustainable development principles Energy efficiency and GHG reduction Circular economy Nature and biodiversity Health and wellbeing Climate adaptation which highlighted our progress and featured a discussion with the Chair of the UK Net Zero Carbon Building Standard on the business case for net zero carbon and the role of large estates in driving change across London. We reinvigorated our Office Sustainability Action Group for the head office by welcoming new colleagues and refining focus areas across energy, waste and biodiversity. We introduced a new energy dashboard using half-hourly consumption data and enhanced planting on the third‑floor terrace to support biodiversity. An independent assessment confirmed these improvements delivered a 106% increase in the Biodiversity Net Gain score at our head office. Working with our customers and suppliers Objectives:
our progress in implementing the principles of our policy. These reviews provided valuable insight into current compliance, along with strategic recommendations for improvement across each policy theme. As part of this policy, our supplier pre‑qualification questionnaire sets expectations for suppliers to begin measuring their carbon emissions. To date, 146 (21%) new and existing suppliers have completed the questionnaire, with 65 (45%) confirming they have set a net zero carbon target. To accelerate progress in measuring supplier emissions we have partnered with Planet Mark Ltd to trial an enhanced supply chain engagement model. The pilot has enabled us to partially incorporate verified supplier-reported emissions into our Scope 3 reporting (representing 17% of reported emissions from suppliers). If we can increase coverage of measured emissions in future years this will support a structured and targeted approach to supplier engagement, while providing opportunity to influence procurement decisions over time.
— Our supply chain partners will demonstrate their commitment to carbon reduction — Our customers will value our expertise and work with us to reduce their carbon emissions — We will adopt responsible business practices throughout our value chain Nearly 58% of our carbon emissions come from goods and services purchased through our supply chain. We are therefore focused on implementing our Sustainable Procurement Policy and improving the quality and reporting of supplier emissions (Scope 3). Tetra Tech supported a series of internal reviews assessing
Planet Mark Winner Supply Chain Engagement In November 2025, we were announced as winners of a Planet Mark award in the Supply Chain Engagement category. This recognition highlighted our efforts to actively engage our suppliers, including embedding our Sustainable Procurement Policy.
23
The Howard de Walden Estate Annual Report 2026 Strategic report
Governance
Financial statements
Sustainability continued Since the introduction of green clauses as standard in 2022, the proportion of commercial occupiers with these provisions included in their leases has continued to rise year on year. At the time of writing, green clauses are included in almost 20% of healthcare leases, 31% of office leases, and 59% of retail leases. The remaining gap is attributable to leases that pre-date 2022. Since completing our environmental risk assessment in 2021, we have strengthened our approach to managing climate‑related risks. This includes building on the Financial Value at Risk Assessment and Transition Risk Assessment undertaken last year, which were aligned with the recommendations of the Task Force on Climate-related Financial Disclosures (TCFD). This work resulted in the inclusion of climate adaptation requirements within our sustainable development framework for the first time, alongside the development of a Climate Adaptation Risk Assessment. The assessment uses climate data to create risk profiles for individual assets, supporting asset managers in reviewing risk exposure and prioritising investment decisions for both existing assets and proposed developments. Although we are not currently required to disclose climate‑related financial risks, our approach to climate resilience remains aligned with the TCFD framework and its recommended principles. Streamlined Energy and Carbon Reporting (SECR) Our SECR disclosure presents our carbon footprint across Scopes 1, 2 and 3, together with an appropriate intensity metric and our total energy use. During the year, our measured Scope 1 and 2 emissions (marketbased) totalled 441 tonnes of CO2 equivalent (tCO2e), a decrease on last year. The primary reasons for this reduction are: — Scope 1 emissions have seen a reduction compared with 2024-2025 through our phasing out of natural gas. — Our Scope 2 emissions have reduced
year‑on-year primarily due to a reduction in our void space consumption. — Scope 3 emissions have seen a decrease year-on-year through three key areas: — Improvements in our supplier data we have collected this year reducing our emissions for purchased goods and services. — Tracking our embodied carbon across our refurbishment sites moving away from spend based approach. —R eduction in energy consumption for our tenanted areas. Our contracted electricity and gas supplies are from certified renewable sources (i.e. REGOs and RGGOs, respectively). We have again procured additional REGO and RGGO certificates from the secondary market for our remaining non-contracted electricity and gas supplies to ensure 100% renewable energy coverage for every unit of electricity and gas purchased. Our energy consumption has decreased for both our landlord areas and tenant supplies this year as shown in the adjacent table. This is largely due to decreased average consumption across our commercial void units and removal of fossil fuel plant as part of our targeted strategy to decarbonise our portfolio. Methodology The GHG emissions data is prepared by following the Greenhouse Gas (GHG) Protocol: A Corporate Accounting and Reporting Standard published by the World Resources Institute (WRI). We use the GHG Protocol operational control approach as this reflects where the Group has the ability to influence GHG emissions. The energy and carbon statements disclosed in this report have been calculated in accordance with the following standards: — WRI/WBCSD (2004). Greenhouse Gas Protocol: Corporate Accounting and Reporting Standard – Revised Edition. — WRI/WBCSD (2015). Greenhouse Gas Protocol: Scope 2 Guidance for market‑based reporting. — Department for Environment, Food & Rural Affairs and Department for Business, Energy & Industrial Strategy (2019): Environmental reporting guidelines: Including Streamlined Energy and Carbon Reporting requirements.
Streamlined Energy and Carbon Reporting (SECR) disclosure
2026
2025
Net Zero Base Line 2018
441
493
574
447 –
611 –
1,472 –
Total Scope 3 emissions (tCO 2e) Cat 1 – Purchased goods and services Cat 3 – Fuel and energy related activity Cat 5 – Waste generated in operations Cat 6 – Business travel Cat 7 – Employee commuting Cat 13 – Downstream leased assets
20,341 12,220 259 1 12 38 7,811
24,843 16,357 283 15 20 54 8,114
33,756 22,463 484 15 1 74 10,719
Carbon intensity ratio (tCO 2e/m2) Location-based
0.025
0.035
0.13
Total landlord energy use (MWh of electricity & gas)
4,478
5,524
4,871
Total tenant energy use (MWh of electricity & gas)*
32,752
33,133
32,013
Total Scope 1 emissions (tCO2e) Total Scope 2 emissions (tCO 2e) Location-based Market-based
Our reporting period covers 1 April 2025 through to 31 March 2026. Scope 1 is defined as direct emissions that include any gas data for landlord-controlled parts (including company vehicles) and fugitive emissions from air conditioning are included where it is our responsibility within the managed portfolio. Scope 2 is defined as indirect energy emissions which include purchased electricity within landlord-controlled areas such as lobbies, staircases or vacant units. The boundary of reporting excludes tenant consumption in our properties, as the leasing arrangements put responsibility for energy payment on the tenants. Therefore, these emissions fall within Scope 3 (leased assets) but exclude long‑lease assets (>99 year leases). Electricity used in refurbishment projects has been included where available or material. We quantify the carbon intensity of the portfolio based on its size (m2) rather than rental income which has little bearing on the efficiency of our buildings. Our emissions intensity for 2024-25 was 0.035 tCO 2e / m2 (Scope 1 & 2 location based). We have expanded our Scope 3 data quality through the use of greater activity data and less reliance on financial spend based approaches. Scope 3 categories 3, 5, 6, 7 and 13 are based on consumption information with the remaining Category 1 based on a blend of estimated consumption through financial spend, supplier data and embodied carbon calculations for our refurbishment activity. We have applied the appropriate greenhouse gas conversion factors from UK Department for Business, Energy Security & Net Zero (DESNZ) 2025 in addition to UK Standard Industrial Classifications (SIC) GHG intensities for 2023 (most recent published data) for our purchased goods and services where specific activity data is not available. In addition, we report Scope 3 emissions from sources not owned or controlled by the Howard de Walden Estate, including customer and supply chain emissions. We report Scope 3 emissions from the following sources: — Tenant energy consumption in our properties where the leasing arrangements put responsibility on energy operation and direct payment for supply on the tenants (excluding long-leasehold properties >99yr). We have improved the robustness of our data via data procurement methods. — Embodied emissions from the materials we use in our refurbishment projects. — Purchased goods and services from our suppliers. — Fuel and Energy related Activities (FERA) associated with Scope 1 & 2 activity. — Business travel and employee commuting. — Waste treatment and disposal, where waste collection is our responsibility within the managed portfolio. Energy efficiency improvements are detailed in our sustainability update. *Applies to leases within scope of MEES (EPC regulations).
24
The Howard de Walden Estate Annual Report 2026 Strategic report
Governance
Financial statements
“Significant investment has been made into the leadership and management development programme, with over a third of the workforce participating.”
Our people
Suzanne Tomlinson Chief People Officer
During the year, we began implementing elements of the people strategy to support the delivery of a higher level of individual and company performance, with a focus on developing our talent. Concurrently, we identified areas of the business that needed restructuring, redistributing work or implementing new processes in some cases while also creating new roles required to deliver the business plan. The Executive Committee (ExCo) was replaced by a Senior Leadership Team (SLT), focusing on the three critical areas of our business: strategy, property (asset management) and operations. The new structure includes previous ExCo members but has been broadened to embrace the wide range of talent and skills available in our business and involve more people in the most important decisions. This year, the Group’s voluntary employee turnover rate decreased to 10.1% (2025: 11.4%), a healthy turnover for the size of our business, with almost 50% of leavers due to retirement, moving away from the property industry or taking time out to pursue non‑business interests. We undertook a salary benchmarking exercise to review our compensation and benefits package. The results confirmed we are market leading in many aspects of our offering and few adjustments were required.
Developing our talent During the year, we commenced a leadership and management development programme, led by an external partner. Significant investment has been made into the programme with just over a third of the workforce participating across three cohorts: Senior Leadership Team; line managers; and those identified as future leaders. The year-long programme is comprised of both in-person and online sessions along with personality profiling. We are already starting to see the benefits, while priming our future leaders for success when they step into management or leadership roles.
Diversity, equity, inclusion & belonging (DEI&B) The Diversity, Equity, Inclusion & Belonging (DEI&B) Committee recruited new members and was renamed to Inclusion Committee to reflect a broader focus on inclusive working environments. The committee led on awareness events encompassing Pride, Black History Month, Social Mobility Day and Menopause Awareness Month.
The internal mentoring pilot scheme was a success with both mentors and mentees taking value from the experience. There were six mentoring partnerships with members of our leadership team taking on the role of mentor, supporting mentees with 10 years or less industry experience across technical and operational roles. The scheme will run again in 2026 with a new cohort of mentors and mentees. To support career progression and to future‑proof our business, a succession planning exercise was carried out. Next year, ‘career conversations’ will be held with these individuals and plans created to provide the relevant experience and exposure for development.
Launch of mentoring scheme with Circle Partnerships.
The Howard de Walden Estate, Pride.
25
The Howard de Walden Estate Annual Report 2026 Strategic report
Governance
Financial statements
Our people continued Gender pay gap For the seventh year we have voluntarily commissioned an external consultant to calculate our gender pay gap. In common with our real estate peers, we report a significant gender pay gap and are focused on steps to reduce this. The Group continues to employ more women than men. However, applying the pay gap calculations, as with previous years, men were again paid more on average than women. This year, we have refined the analysis to only consider head office staff and, accordingly, re-presented the 2025 comparative figures to be on the same basis. The mean gender pay gap for hourly pay decreased by 0.3% to 42.2% and the median widened by 1.5%. As with previous years, the three highest paid individuals are the Executive Directors, all of whom are men, which has a significant impact on the result. Looking at the bonus gender pay gap, the mean decreased for the third year (by 0.2%), while the median decreased by 2.2%. Increasing the representation of women in the upper quartile and decreasing in the lower quartile at greater pace continues to be key for narrowing the gender pay gap. We continue to make development opportunities available to women, including 10 of the 16 members of the future leaders cohort on this year’s leadership and management development programme. Mentoring partnerships with female mentors help to highlight the achievements of women within our business and demonstrate what is possible for young talents. Visibility encourages ambition and helps young women see a clear path forward.
Our gender pay gap Headline figures comparing the basic hourly pay of all employees inclusive of cash payments and allowances Mean
Median
Our gender pay gap 2026 Change* 2025 gap**
42.2% -0.3% 42.5%
29.9% 1.5% 28.4%
National average gap 2026 Change* 2025 gap**
13.4% -0.4% 13.8%
12.8% -0.3% 13.1%
Our gender bonus pay gap 2026 Change* 2025 gap**
66.3% -0.2% 66.5%
47.8% -2.2% 50.0%
A minus indicates the gap is in favour of females. *Percentage change figures are absolute change in percentage points. ** T he 2025 figures have been re-presented as we have amended our data coverage to only include head office-based staff.
Pay quartiles The proportion of male and female employees by quartile pay bands Quartile trends year on year Upper quartile Upper middle Lower middle Lower quartile
2026 2025** 2026 2025** 2026 2025** 2026 2025**
73% 72% 45% 48% 32% 32% 29% 31%
Male
27% 28% 55% 52% 68% 68% 71% 69%
Female
Chief Executive pay ratio 2026
2025**
75th percentile Median
12:1 18:1
12:1 18:1
25th percentile
23:1
19:1
26
The Howard de Walden Estate Annual Report 2026 Strategic report
Governance
Financial statements
“From customer relationships to community events, we invest in the people who make Marylebone thrive.”
Our community
Annette Shiel Head of Marketing & Communications
Customers We recognise the importance of our customers as the source of our income, and the role they play in creating our vibrant Marylebone Village community. We work hard to attract, retain and support customers and consider them a key part of our stakeholder network. We continue to support and invest in our customers and the area through engagement, marketing and communications. Building strong relationships with both our residential and commercial occupiers and understanding the needs and challenges they face is key to shaping our marketing and communication strategy. We work hard to nurture these relationships through regular face‑to‑face meetings, networking forums and community events. Connecting each of our customer sectors is hugely important, ensuring customers that live and work in Marylebone are aware of and benefiting from the area’s diverse mix of retail, restaurants and wellness facilities. To achieve this goal, local initiatives include our periodical, the Marylebone Journal, which promotes retail, restaurants and lifestyle, our two digital newsletters, Marylebone Village and the Harley Street Health District, promoting our healthcare and innovation offering, along with our Marylebone Village Privilege Card, which now offers over 8,000 local residents and businesses discounts and promotions across the village. All play a part in achieving this goal.
Partnerships and events Partnerships and community events remain a cornerstone of our community strategy. Following a successful launch last year, we continued our partnership with Amex and The Portman Estate to deliver the Marylebone‑wide London Restaurant Festival. The partnership showcased the rich and diverse food and beverage offering across Marylebone, drawing a new audience to explore the area. A Day on the Lane event returned bringing together Marylebone Lane’s retailers and restaurants alongside community groups for a day of shopping, dining and family‑friendly activities, while raising funds for local charity Young Westminster Foundation.
Our community investment encompasses our charitable giving and support for local institutions and initiatives and is aligned with our equity, diversity and inclusion aims. It is also recognised as a contributing factor in enhancing employee engagement. Our Community Investment Committee oversaw contributions of £0.9 million to many deserving local charities and community institutions. This year, our community investment continued to prioritise partnerships that address local need. We supported organisations responding to homelessness,
Our much-loved Marylebone Christmas Lights celebration launched the Christmas season in support of our local charity partner the Marylebone Project. To mark International Women’s Day, we hosted a panel event spotlighting the inspiring women behind some of the Marylebone Village brands. The panel was chaired by local resident and BBC radio broadcaster Jo Good. Community investment The Group’s community investment is guided by the principle that our income is generated in Marylebone and, therefore, our support should be focused predominantly in the local area. Recognising that there are areas of need just outside the 95 acres of our estate, we broaden our reach to support neighbouring communities in the City of Westminster.
International Women’s Day.
including St Mungo’s Westminster street outreach team and the Cardinal Hume Centre, which supports young people and families experiencing homelessness. For the Marylebone Christmas Lights event, we partnered with The Marylebone Project, a local women’s hostel. We also backed initiatives helping people access food through Felix, Marylebone FoodCycle and St Mary’s Social Supermarket. We continued our support for older people in our community through several initiatives with Age UK Westminster to alleviate isolation and improve health and wellbeing.
27
The Howard de Walden Estate Annual Report 2026 Strategic report
Governance
Financial statements
Our community continued Left: Marylebone Christmas Lights. Below left: Staff volunteering at ZSL London Zoo and participating in the LandAid Sleepout challenge.
“St Mungo’s is incredibly grateful to The Howard de Walden Estate for their continued support of our Westminster Street Outreach Service. Through their generous £25,000 donation, alongside additional employee fundraising, they have helped fund vital outreach work, enabling us to support hundreds of people to move away from rough sleeping and towards more stable futures. Partnerships like this are essential in tackling homelessness in Westminster, and we are proud to be working together to create lasting change.” Victoria Linney St Mungo’s (Corporate Partnerships Coordinator)
Our focus on widening access to education and careers in the property industry continues through our University of Westminster scholarships. These scholarships support students studying Real Estate courses who are experiencing financial hardship, helping them to focus on their studies and take the next steps towards a career in the sector. Scholarship recipients also have the opportunity to join us as paid interns during the summer, gaining experience, support and connections that can help launch their careers. We know that creating opportunities matters, and our colleagues took part in a range of employability activities with local secondary schools and organisations, including 2-3 Degrees and Young Westminster Foundation. This included welcoming students for estate tours, skills workshops, mock interviews and mentoring, helping
them to build confidence and learn more about careers in the property industry. We are proud to support a range of local health and wellbeing initiatives, from advancing medical care to funding programmes that provide mental health support in our community. This year, we funded a functional neurological disorder (FND) research programme through Evelina London Children’s Charity at Guy’s and St Thomas’ Hospital. The findings will help to inform improved care for children in hospitals across the UK. We also continued to support St John’s Hospice at Home programme and an art therapy programme for both staff and patients at St Mary’s Children’s Hospital. Beyond financial support, we encourage colleagues to give back to our community through volunteering. Colleagues dedicated an impressive 645 hours to volunteering directly with our charitable partners and
at local schools. Colleagues also raised a fantastic amount through various fundraising events: a quiz night raised more than £13,000 for the Story of Christmas, and an overnight LandAid SleepOut in March raised over £10,000. We also supported colleagues in other fundraising efforts, including charity runs, abseiling, and a range of other personal challenges. As part of our ambition to expand our reach and create greater impact, we also leveraged our supplier and contractor network to deliver practical support where it was needed most. Contractors helped prepare for the installation of a new kitchen at St Paul’s Church, helping Marylebone FoodCycle to continue providing community meals, and supported the creation of the Wonder Room at St Vincent’s Primary School, an SEN‑friendly space for school children.
28
The Howard de Walden Estate Annual Report 2026 Strategic report
Financial statements
Safety statistics
Suppliers and contractors This year, we have continued to strengthen our approach to supplier and contractor management, building on the standard terms and conditions and broader contract documentation framework to ensure greater consistency, transparency, and alignment with our strategic objectives. This was underpinned by the completion of an estate-wide soft services tender, which reviewed and rationalised the supply chain, clarified service requirements, and embedded enhanced governance, sustainability and performance expectations.
Governance
Employees
Contractors
Managed portfolio
Accident
3
0
1
Incident
0
1
5
Near miss
0
0
6
RIDDORs
0
1
0
Fatalities
0
0
0
Dangerous occurrences
0
0
0
Prohibition notices
0
0
0
Improvement notices
0
0
0
Data for year to 31 March 2026:
Refurbishment of 1 Harley Street.
Sustainability was further integrated into procurement activities through a formal supplier sustainability questionnaire, requiring suppliers to demonstrate alignment with our Sustainable Procurement Policy and net zero commitments. In parallel, enhanced supplier due diligence has been implemented through updated onboarding processes and policies, ensuring suppliers are assessed against key risk, compliance, and sustainability criteria prior to engagement. This has been complemented by the introduction of the Alcumus Safe Contractor platform as the Group’s primary contractor compliance solution, improving the consistency and visibility of health and safety accreditation and enabling more proactive management of supplier compliance. We remain committed to ensuring that our refurbishment and redevelopment programme creates minimal disruption and we look to appoint contractors who share this aspiration. The Considerate Constructors Scheme (CCS) is used to assess the impact of large‑scale projects. A CCS assessor scores construction projects across three categories: community, environment and
workforce. Due to the heritage constraints of the buildings in our portfolio and the estate’s location in a conservation area in the heart of London, it is very difficult to obtain the highest scores for many of our projects. This year, the Group scored an average of 40 (out of 45) across all our projects, which CCS considers an excellent result. This includes a maximum score for our development at 13 Devonshire Close, which was also nominated for an award at the National Site Awards 2026. Health and safety We are committed to providing a safe working environment through effective risk management, supported by qualified professionals with expertise in compliance across the built environment. Our strategic health and safety plan focuses on building compliance, fire safety, the Building Safety Act, contractor management, risk management and the development of
internal competence. Regular audits and risk assessments, including construction projects, are performed in partnership with our contractors. Findings are carefully reviewed, and recommendations implemented promptly to minimise risks. The health and safety team collaborates with internal stakeholders and contractors to ensure appropriate control measures in daily operations. This collaborative approach is reviewed by the Health and Safety Committee, comprised of senior representatives and overseen by the Chief Financial Officer. This governance structure supports continuous improvement and unbiased decision-making. Our approach to health and safety is centred on planning, controlling and monitoring activities to prevent harm and minimise disruption to anyone connected with our organisation and continually improve building safety.
Modern Slavery Act The Modern Slavery Act 2015 seeks to encourage a robust and diligent approach by commercial organisations in tackling modern slavery, which includes slavery, servitude, forced or compulsory labour, and human trafficking. The Group does not tolerate any form of modern slavery, within its own business or within its supply chain. We comply with all mandatory requirements of employment legislation and best practice. All workers engaged have chosen their employment freely and are treated with dignity and respect. In accordance with section 54 of the Act, the Group publishes an annual statement detailing the steps taken to prevent slavery and human trafficking from taking place in any part of its business or supply chain. The statement is available to be viewed on the Howard de Walden Estate website (www.hdwe.co.uk).
29
The Howard de Walden Estate Annual Report 2026 Strategic report
Carlotta, 77-78 Marylebone High Street.
Governance
Financial statements
30
The Howard de Walden Estate Annual Report 2026 Strategic report
Governance
Financial statements
Officers and professional advisers
Secretary Leonie Brock Registered office 23 Queen Anne Street London W1G 9DL Company registered number 06439246 Bankers Lloyds Banking Group plc 33 Old Broad Street London EC2N 1HZ Lloyds Bank plc 33 Old Broad Street London EC2N 1HZ National Westminster Bank plc 250 Bishopsgate London EC2M 4AA Royal Bank of Scotland plc 36 St Andrew Square Edinburgh EH2 2YB
Auditor S&W Audit 45 Gresham Street London EC2V 7BG Solicitors Charles Russell Speechlys LLP 5 Fleet Place London EC4M 7RD
Non-Executive Directors Sir William Proby Bt CBE DL The Lord Howard de Walden The Hon Mrs Buchan The Hon Mrs White The Hon Mrs Acloque Alexander Acloque Marc Gilbard Rt Hon Professor Lord Kakkar KG KBE PC Liz Peace CBE Sophia Ruck Toby Shannon Karl Sternberg Nicholas White
Executive Directors Mark Kildea Julian Best Andrew Griffith
31
The Howard de Walden Estate Annual Report 2026 Strategic report
Governance
Financial statements
Governance
Howard de Walden Estates Holdings Limited is privately owned, with the majority shareholder being the Lord Howard de Walden and Seaford’s Marriage Settlement Children’s Trust, which holds the shares for the benefit of current and future members of the Howard de Walden family. There are other family trusts and individual family shareholdings which hold the remaining shares.
The Audit Committee reports to the Board and oversees financial reporting and the statutory audit as well as monitoring internal controls, including risk management. The members of the Audit Committee are Toby Shannon, Marc Gilbard and Karl Sternberg with the attendance of the Chairman, Executive Directors and Director of Finance when required.
Howard de Walden Estates Holdings Limited is the holding company of Howard de Walden Estates Limited which, together with its wholly owned entities, form ‘the Group’, which owns all the property assets. Howard de Walden Estates Holdings Limited has no equity or debt securities listed on the London Stock Exchange and although exempt from compliance with the UK Corporate Governance Code, the Group’s approach is to apply best corporate governance practice appropriate to a large private company. This creates a high level of accountability, probity and clarity on decision making.
It is the nature of the property business that some investments are large and complex, therefore the Group operates an Investment Committee, which reports to the Board. The Investment Committee meetings allow members adequate time and preparation to explore, understand, challenge and approve any investment that exceeds the authority level delegated by the Board to the Executive Directors. This committee, chaired by Marc Gilbard, also comprises Sir William Proby, Toby Shannon, Karl Sternberg and the Executive Directors. Non-Executive Directors are also invited to informal update meetings and site visits, which provide an opportunity to meet senior management.
The composition of the Group Board of Directors (‘the Board’) is designed to ensure the effective management of the Group and to provide leadership, strategy and control. At the year end, there are six Non‑Executive Directors with CEO or equivalent experience on the Board, including the Chairman, and seven family shareholders, plus the three Executive Directors.
The Remuneration and Nominations Committee makes recommendations to the Board on the Executive Directors’ remuneration, based upon independent external professional advice. The members of the Remuneration and Nominations Committee are Sir William Proby, Liz Peace and Rt Hon Professor Lord Kakkar.
The roles of the Chairman and the Chief Executive are clearly defined. The Chairman is primarily responsible for overseeing the workings of the Board and its committees. The Board has ultimate responsibility for the Group’s strategy and policies, which are developed by the Chief Executive. The Chief Executive is responsible for the implementation of the policies and strategies set by the Board and management of the business. There were four changes to the Board during the year: the addition of The Lord Howard de Walden, Alexander Acloque, Sophia Ruck and Nicholas White to the Board, all appointed on the 23 September 2025.
The need to achieve environmental compliance across many heritage buildings is a strategic objective. The Sustainability Committee leads on the oversight and implementation of actions alongside the investment required to achieve compliance. The Sustainability Committee is chaired by Liz Peace, with Sir William Proby, Karl Sternberg, Mark Kildea, Simon Tranter and Hayley Fadoju (Sustainability Manager) as fellow members.
The Risk Committee complements our Audit Committee, aligning the Group with governance standards in place for listed entities by assisting the Board with its responsibilities for the oversight of risk. The Risk Committee is chaired by Andrew Griffith, with the other Executive Directors and assurance, risk and compliance team as fellow members. The committee operates as a third line of defence in our risk management framework and meets at least three times per year to consider any changes to the risk environment and any priority or escalated matters. During the year, the Board established a new Healthcare Committee to agree and oversee a revised health strategy. The Healthcare Committee is chaired by Rt Hon Professor Lord Kakkar, with Sir William Proby, Marc Gilbard, Andrew Griffith, Julian Best, Andrea Merrington, Jenny Shand (external consultant), and Annette Shiel (Head of Marketing & Communications) as members. Our experienced management team is integral to the continued success of the Group as it brings specialist skills to manage our diversified portfolio on an asset-by-asset basis. Senior management are typically department heads and interact daily with and report to the Executive Directors. During the year, the previous Executive Committee (‘ExCo’) was disbanded and replaced with an expanded cohort forming the Senior Leadership Team (SLT). The newly formed SLT focuses on three critical areas of our business: strategy, asset management and operations. The overarching aim of the SLT is to deliver on our strategic objectives in an efficient and effective manner.
32
The Howard de Walden Estate Annual Report 2026 Strategic report
Governance
Financial statements
Governance continued
The Board The Board delegates certain matters to its six principal committees, senior leadership team and supporting committees.
Supporting Committees
Audit Committee
Investment Committee
Remuneration and Nominations Committee
Senior Leadership Team
Reports to the Board and oversees financial reporting and the statutory audit as well as monitoring internal controls including risk management.
Reviews large and complex investment proposals, and approves any investment that exceeds the authority level delegated by the Board to the Executive Directors.
Makes recommendations to the Board on the Executive Directors’ remuneration, based upon independent external professional advice.
A newly created team, replacing the previous Executive Committee, aims to deliver on our strategic objectives utilising key employees across the business.
Sustainability Committee
Risk Committee
Healthcare Committee
Other Committees
Implements actions to improve our sustainability credentials and has oversight of projects against our strategic objectives.
Complements our existing risk management framework and considers any changes to the risk environment and any priority or escalated matters.
Oversees and monitors performance in achieving objectives set out in the healthcare strategy.
A number of supporting committees provide oversight on key business activities and risks such as health and safety, community investment and diversity, equity, inclusion & belonging.
33
The Howard de Walden Estate Annual Report 2026 Strategic report
Governance
Financial statements
Section 172 statement
This is the section 172 statement for the Group, covering Howard de Walden Estates Holdings Limited and its wholly owned entities, for the year ended 31 March 2026, which should be read in conjunction with the Strategic report as a whole. The requirement Section 172 of the Companies Act 2006 (‘section 172’) requires a Director of a company to act in the way they consider, in good faith, would be most likely to promote the success of the company for the benefit of its members as a whole, and in doing so have regard, amongst other matters, to: — the likely consequences of any decision in the long-term; — the interests of the company’s employees; — t he need to foster the company’s business relationships with suppliers, customers and others; — t he impact of the company’s operations on the community and the environment; — the desirability of the company maintaining a reputation for high standards of business conduct; and — the need to act fairly with members of the company. The Directors give careful consideration to the factors set out above in discharging their duties under section 172 for the Group.
The Board The Board, comprised of the three Executive Directors, six Non-Executive Directors and seven family shareholders, convened for five meetings in the year. While the primary activity of the Board is to oversee the operations of a property investment and management business capable of distributing a proportion of its profit to shareholders, the Board recognises that long-term success is dependent on maintaining relationships with all its key stakeholders and considering the external impact of the Group’s activities. The Group engages with a wide range of stakeholders to inform its decision making, including customers, suppliers, neighbouring communities, employees and shareholders, as well as considering its impact on the environment. As long‑term stewards of buildings in Marylebone, the Board actively considers the views of all stakeholders and strives to find a balance between them, as it looks to continue to deliver outstanding places to visit, live and work. The Board met throughout the year to discuss matters of strategic importance and to obtain an understanding of the performance and position of the Group. Decisions made by the Board consider the Group’s performance and the impact on stakeholders, with the Group’s reputation of paramount importance. The three Executive Directors head up the Senior Leadership Team, comprising the most senior non‑Board employees in the Group. The Senior Leadership Team is divided into three areas; strategy, asset management and operations, with at least one Executive Director attending meetings across these areas throughout the year. This provides a ground-level up perspective which facilitates a holistic approach across activities and provides clarity and depth of understanding for improving decisions made at Board level.
Stakeholders The following are considered the key stakeholders of the Group: — Customers Our occupiers are the centre of the community. Through careful selection, they bring vibrancy to the area and help to make Marylebone a desirable location to visit, live and work. — Employees The Group cannot satisfy its other key stakeholders without our employees. They are key to the long-term success of the Group. — Shareholders As a family-owned group, our family members’ interests are always considered when making key strategic decisions. A Shareholder Committee provides a platform for the shareholders to provide input on long-term strategic decisions. — Communities The Group is embedded within the local community. As responsible stewards, we need to play our part in supporting the community through events, direct charitable giving and our schemes which impact upon the local environment. — Suppliers We seek to work with suppliers and contractors who share our standards. When working on the estate, suppliers are an extension of Howard de Walden, so it is essential they maintain the Group’s reputation as considerate stewards. —D ebt providers We maintain a close working relationship with our debt providers who play an important role in the long-term financing of the Group. —L ocal authorities We work closely with the City of Westminster to ensure we maintain and enhance our buildings and spaces. Page 34 provides detail of the key activities and initiatives we have carried out in the year, including engagement with our key stakeholders. The table on the following page contains an overview of the key decisions taken by the Board during the year.
34
The Howard de Walden Estate Annual Report 2026 Strategic report
Governance
Financial statements
Section 172 statement continued Key decisions taken during the year Board decision
Considerations
Outcome
Approval of the healthcare strategy
— The need to future-proof the Harley Street Health District considering changes in healthcare delivery. — Maintaining the District’s position as a world‑leading healthcare cluster attracting best-in-class healthcare providers. — Strengthening long-term partnerships with our world class healthcare providers and understanding their property requirements. — Contributing to supporting high-quality, safe and accessible healthcare environments for patients. —E ngagement with local authorities in delivering the required spaces. — Supporting a globally recognised healthcare district and local economy, while having a positive impact on local residents and businesses. —E nsuring the strategy supports sustainable income growth and asset value enhancement.
— I n May 2025, the Healthcare Committee approved the adoption of the healthcare strategy. —O bjectives set in the strategy provide the Group with metrics to report against annually. — I nternal expertise improved in healthcare asset management leading to income and asset value growth. — Strengthened position as a responsible, long-term steward. — Longer term, the expected outcomes are: — The continued delivery of clinical space aligned to modern healthcare requirements. — Strengthened world‑leading tenant mix and clustering. — Enhanced patient experiences. — Establishing a diversified whole health ecosystem. — Resilience to changes in healthcare delivery.
Approval of the capital acquisitions and disposals for the year
— The requirement to deliver the strategy through disciplined investment decisions aligned to strategy. — Targeted disposals to allow re-investment into long-term strategic assets, making them desirable for customers, and to enhance the surroundings and environment.
—A pproval to acquire 37 and 64 Wimpole Street to reposition for modern healthcare facilities. —D isposal of non-core assets generating £42.2 million of capital to be reinvested.
Approved the appointment of four new family directors
—E nsuring succession planning and continuity of strategy is maintained between the company, shareholders and all other stakeholders.
— A ppointment of four family directors in September 2025.
Approved additional long-term debt financing
—E nsuring the refinancing maintains strong, transparent relationships with existing and new lenders. —M aintaining an appropriate level of gearing – balancing cash flow requirements with a low-risk approach to debt management.
— In June 2025, the sub-committee agreed on a new £100 million private placement at a blended rate of 5.63%, which completed in July 2025. — The funds allowed the Group to effectively replace a tranche of debt maturing from the 2010 private placement and provide additional capacity for investment opportunities.
35
The Howard de Walden Estate Annual Report 2026 Strategic report
Governance
Financial statements
Directors’ report
The Directors present their report and the financial statements for the year ended 31 March 2026. Directors’ responsibilities statement The Directors are responsible for preparing the Strategic report, the Directors’ report and the financial statements in accordance with applicable law and regulations. Company law requires the Directors to prepare accounts for each financial year. Under that law, the Directors have elected to prepare the accounts in accordance with United Kingdom Generally Accepted Accounting Practice (United Kingdom Accounting Standards and applicable law) including FRS 102 ‘The Financial Reporting Standard applicable in the UK and Republic of Ireland’. Under company law the Directors must not approve the accounts unless they are satisfied that they give a true and fair view of the state of affairs of the Company and of the Group and of the profit or loss of the Group for the financial year. In preparing these accounts, the Directors are required to: — s elect suitable accounting policies and then apply them consistently; — make judgments and accounting estimates that are reasonable and prudent; — state whether applicable UK Accounting Standards have been followed, subject to any material departures disclosed and explained in the accounts; and — prepare the accounts on the going concern basis unless it is inappropriate to presume that the Company and Group will continue in business.
The Directors are responsible for keeping adequate accounting records that are sufficient to show and explain the Company’s transactions and disclose with reasonable accuracy at any time the financial position of the Company and the Group and enable them to ensure that the accounts comply with the Companies Act 2006. They are also responsible for safeguarding the assets of the Company and the Group and hence for taking reasonable steps for the prevention and detection of fraud and other irregularities. The Directors are responsible for the maintenance and integrity of the corporate and financial information included on the Company’s website. Legislation in the United Kingdom governing the preparation and dissemination of accounts may differ from legislation in other jurisdictions. Disclosure of information to the auditor In the case of each person who was a Director at the time this report was approved: — so far as that Director was aware there was no relevant audit information of which the Company and Group’s auditor was unaware; and — that Director had taken all steps that the Director ought to have taken as a Director to make himself or herself aware of any relevant audit information and to establish that the Company and Group’s auditor was aware of that information. This confirmation is given and should be interpreted in accordance with the provisions of s418 of the Companies Act 2006.
Auditor A resolution to reappoint the auditor, S&W Audit (a trading name of S&W Partners Audit Limited), will be proposed at the next AGM. Company’s registered number The Company’s registered number is 06439246. Dividends During the year, the Group paid dividends of £48,654,000 (2025: £46,337,000) to ordinary shareholders and £nil (2025: £4,000,000) to ‘A’ shareholders. Risk management A summary of the principal risks and uncertainties is included in the Strategic report on pages 16 to 19. Going concern The Directors have considered the appropriateness of applying the going concern basis for preparing the financial statements. More detail can be found in note 2.2 to the accounts. Post balance sheet event Subsequent to the year end, the Group secured a new £100 million revolving credit facility. The facility replaces the Group’s existing revolving credit facility and further strengthens the Group’s liquidity and long-term funding arrangements.
36
The Howard de Walden Estate Annual Report 2026 Strategic report
Governance
Financial statements
Directors’ report continued
The Board members who served during the year and up to the date of this report are listed below: Sir William Proby Bt CBE DL Toby Shannon Mark Kildea Julian Best Andrew Griffith The Hon Mrs Buchan The Hon Mrs White The Hon Mrs Acloque Alexander Acloque (appointed 23 September 2025) Lord Howard de Walden (appointed 23 September 2025) Sophia Ruck (appointed 23 September 2025) Nicholas White (appointed 23 September 2025) Marc Gilbard Rt Hon Professor Lord Kakkar KG KBE PC Liz Peace CBE Karl Sternberg
Chairman Deputy Chairman Chief Executive Executive Property Director Chief Financial Officer Family Shareholder Family Shareholder Family Shareholder Family Shareholder Family Shareholder Family Shareholder Family Shareholder
Section 172 In compliance with section 172 requirements, a statement can be found on pages 33 and 34 of the Strategic report which includes details of the Directors’ regard for employee engagement and business relationships.
We consolidate our organisational boundary according to the operational control approach. The GHG sources that constituted our operational boundary for the year are: — Scope 1: Natural gas, transportation fuels and fugitive emissions from air conditioning. — Scope 2: Electricity. — Scope 3: Business travel mileage, water, purchased electricity and gas sub-metered to occupiers, and fuel and energy related activities.
Streamlined energy and carbon reporting In compliance with streamlined energy and carbon reporting, the Directors present the Group’s emissions and energy usage on page 23 of the Strategic report, as the matter is of strategic importance. Our annual emissions equate to 0.03 tCO2e/m2 (Scope 1 & 2 location based). The Group quantifies and reports its organisational greenhouse gas (GHG) emissions in alignment with the World Resources Institute’s Greenhouse Gas Protocol: Corporate Accounting and Reporting Standard and the corresponding guidance. We currently include six of the 13 Scope 3 categories.
Non-Executive Non-Executive Executive Executive Executive Non-Executive Non-Executive Non-Executive Non-Executive Non-Executive Non-Executive Non-Executive Non-Executive Non-Executive Non-Executive Non-Executive
We have used accurate consumption data to calculate emissions for most utility supplies. In some cases, where there is limited information, values have been estimated using either extrapolation of available data or data from the previous year as a proxy, to ensure complete coverage for the reporting year. We aim to continually improve the coverage, quality and scope of our data.
The reporting guidelines require that we quantify and report Scope 2 emissions according to two different methodologies: (i) the location-based method, using average grid emissions factors for the country in which the reported operations take place; and (ii) the market-based method, which uses the actual emissions factors of the energy procured and therefore, takes renewable energy sources into account. During the year, 100% of the energy we procured was from certified renewables. This report was approved by the Board of Directors on 12 August 2026 and signed on its behalf by:
Mark Kildea Chief Executive Director
Sir William Proby Bt CBE DL Chairman Director
37
The Howard de Walden Estate Annual Report 2026 Strategic report
Governance
Financial statements
Independent auditor’s report to the Members of Howard de Walden Estates Holdings Limited
Opinion We have audited the financial statements of Howard de Walden Estates Holdings Limited (‘the Company’) and its subsidiaries (‘the Group’) for the year ended 31 March 2026 which comprise the Group Statement of Comprehensive Income, the Group and the Company Statements of Financial Position, the Group and the Company Statements of Changes in Equity, the Group Statement of Cash Flows and the notes to the financial statements, including significant accounting policies. The financial reporting framework that has been applied in their preparation is applicable law and United Kingdom Accounting Standards, including FRS 102 “The Financial Reporting Standard applicable in the UK and Republic of Ireland” (United Kingdom Generally Accepted Accounting Practice). In our opinion, the financial statements: — give a true and fair view of the state of the Group’s and of the Company’s affairs as at 31 March 2026 and of the Group’s profit for the year then ended; — have been properly prepared in accordance with United Kingdom Generally Accepted Accounting Practice; and — have been prepared in accordance with the requirements of the Companies Act 2006. Basis for opinion We conducted our audit in accordance with International Standards on Auditing (UK) (ISAs (UK)) and applicable law. Our responsibilities under those standards are further described in the Auditor’s responsibilities for the audit of the financial statements section of our report. We are independent of the Group and the Company in accordance with the ethical requirements that are relevant to our audit of the financial statements in the UK, including the FRC’s Ethical Standard, and we have fulfilled our other ethical responsibilities in accordance with these requirements. We believe that the audit evidence we have obtained is sufficient and appropriate to provide a basis for our opinion.
Conclusions relating to going concern In auditing the financial statements, we have concluded that the Directors’ use of the going concern basis of accounting in the preparation of the financial statements is appropriate. Based on the work we have performed, we have not identified any material uncertainties relating to events or conditions that, individually or collectively, may cast significant doubt on the Group and the Company’s ability to continue as a going concern for a period of at least twelve months from when the financial statements are authorised for issue. Our responsibilities and the responsibilities of the Directors with respect to going concern are described in the relevant sections of this report. Other information The other information comprises the information included in the Annual Report, other than the financial statements and our auditor’s report thereon. The Directors are responsible for the other information contained within the Annual Report. Our opinion on the financial statements does not cover the other information and, except to the extent otherwise explicitly stated in our report, we do not express any form of assurance conclusion thereon. Our responsibility is to read the other information and, in doing so, consider whether the other information is materially inconsistent with the financial statements, or our knowledge obtained in the course of the audit or otherwise appears to be materially misstated. If we identify such material inconsistencies or apparent material misstatements, we are required to determine whether this gives rise to a material misstatement in the financial statements themselves. If, based on the work we have performed, we conclude that there is a material misstatement of this other information, we are required to report that fact. We have nothing to report in this regard.
Opinions on other matters prescribed by the Companies Act 2006 In our opinion, based on the work undertaken in the course of the audit: — the information given in the Strategic report and the Directors’ report for the financial year for which the financial statements are prepared is consistent with the financial statements; and — the Strategic report and the Directors’ report have been prepared in accordance with applicable legal requirements. Matters on which we are required to report by exception In the light of the knowledge and understanding of the Group and the Company and their environment obtained in the course of the audit, we have not identified material misstatements in the Strategic report or the Directors’ report. We have nothing to report in respect of the following matters in relation to which the Companies Act 2006 requires us to report to you if, in our opinion: — adequate accounting records have not been kept by the Company, or returns adequate for our audit have not been received from branches not visited by us; or — the Company financial statements are not in agreement with the accounting records and returns; or — certain disclosures of Directors’ remuneration specified by law are not made; or — we have not received all the information and explanations we require for our audit. Responsibilities of Directors As explained more fully in the Directors’ responsibilities statement set out on page 35, the Directors are responsible for the preparation of the financial statements and for being satisfied that they give a true and fair view, and for such internal control as the Directors determine is necessary to enable the preparation of financial statements that are free from material misstatement, whether due to fraud or error.
38
The Howard de Walden Estate Annual Report 2026 Strategic report
Governance
Financial statements
Independent auditor’s report continued In preparing the financial statements, the Directors are responsible for assessing the Group’s and the Company’s ability to continue as a going concern, disclosing, as applicable, matters related to going concern and using the going concern basis of accounting unless the Directors either intend to liquidate the Group or the Company or to cease operations, or have no realistic alternative but to do so. Auditor’s responsibilities for the audit of the financial statements Our objectives are to obtain reasonable assurance about whether the financial statements as a whole are free from material misstatement, whether due to fraud or error, and to issue an auditor’s report that includes our opinion. Reasonable assurance is a high level of assurance, but is not a guarantee that an audit conducted in accordance with ISAs (UK) will always detect a material misstatement when it exists. Misstatements can arise from fraud or error and are considered material if, individually or in the aggregate, they could reasonably be expected to influence the economic decisions of users taken on the basis of these financial statements. Irregularities, including fraud, are instances of non‑compliance with laws and regulations. We design procedures in line with our responsibilities, outlined above, to detect material misstatements in respect of irregularities, including fraud. The extent to which our procedures are capable of detecting irregularities, including fraud, is detailed below: We obtained a general understanding of the Group and the Company’s legal and regulatory framework through enquiry of management concerning their understanding of relevant laws and regulations, the entity’s policies and procedures regarding compliance, and how they identify, evaluate and account for litigation claims. We also drew on our existing understanding of the Group and the Company’s industry and regulations. We understand that the Group and the Company comply with the framework through: — Operating an experienced in-house legal team who update internal procedures, manuals and controls as legal and regulatory requirements change; — Close oversight by the Directors and key management, meaning that any litigation or claims would come to their attention directly; and — Outsourcing tax compliance to external experts.
In the context of the audit, we considered those laws and regulations which determine the form and content of the financial statements, which are central to the Group and the Company’s ability to conduct its business and/or where there is a risk that failure to comply could result in material penalties. We identified the following laws and regulations as being of significance in the context of the Group and the Company: — the financial reporting framework United Kingdom Accounting Standards including FRS102 ‘The Financial Reporting Standard applicable in the UK and Republic of Ireland’; — the Companies Act 2006; and — UK taxation law. We performed the following specific procedures to gain evidence about compliance with the significant laws and regulations identified above: — Discussion with management as well as those charged with governance, over their consideration of known or suspected instances of non-compliance with laws and regulation and fraud; — Reviewed legal expenses to identify any known or suspected instances of non-compliance; — Reviewed Board meeting minutes to identify any known or suspected instances of non-compliance; and — We obtained written management representations that they have disclosed to us all known or suspected instances of non-compliance with laws and regulations and accounted for and disclosed all known actual or possible litigation and claims in the financial statements. The Senior Statutory Auditor led a discussion with senior members of the engagement team regarding the susceptibility of the Group and the Company’s financial statements to material misstatement, including how fraud might occur. The areas identified in this discussion were: — Manipulation of the financial statements via the posting of fraudulent journal entries; — Incorrect recognition of revenue notably around the year end; and — Management bias in areas of estimation uncertainty for the valuation of the investment properties. The procedures we carried out to gain evidence in the above areas included: — Testing of a sample of manual journal entries, selected through applying specific risk assessments based
on the Group’s and Company’s processes and controls surrounding manual journal entries; — Testing a sample of revenue transactions to underlying documentation; and — Testing the validity of the data used in the investment property valuations due to the risk of manipulation of valuation inputs. To address this risk, we obtained and documented an understanding of the relevant controls over investment property valuations. We tested the valuation of a sample of investment properties by agreeing the details to the underlying lease agreements, recalculating the valuations, and comparing key valuation inputs, including yields, to those confirmed by the Group’s third-party valuer. We also investigated any significant departures from the valuer’s assumptions. A further description of our responsibilities is available on the Financial Reporting Council’s website at: www.frc.org.uk/auditorsresponsibilities. This description forms part of our auditor’s report. Use of our report This report is made solely to the Company’s members, as a body, in accordance with Chapter 3 of Part 16 of the Companies Act 2006. Our audit work has been undertaken so that we might state to the Company’s members those matters we are required to state to them in an auditor’s report and for no other purpose. To the fullest extent permitted by law, we do not accept or assume responsibility to anyone other than the Company and the Company’s members as a body, for our audit work, for this report, or for the opinions we have formed. Nicholas Jacques Senior Statutory Auditor, for and on behalf of S&W Audit Statutory Auditor Chartered Accountants 45 Gresham Street London EC2V 7BG 12 August 2026
39
The Howard de Walden Estate Annual Report 2026 Strategic report
Financial statements 29 Queen Anne Street.
Governance
Financial statements
40
The Howard de Walden Estate Annual Report 2026 Strategic report
Governance
Group Statement of Comprehensive Income for the year ended 31 March 2026
Note
2026 £000
2025 £000
4
180,762
164,954
Property outgoings and cost of sales
(31,880)
(39,043)
Gross profit
148,882
125,911
Administrative expenses
(28,708)
(25,990)
120,174 231,209 7,751
99,921 87,028 6,391
359,134 3,038 (26,701) (9,399) 9,699
193,340 1,436 (25,683) 148 2,711
335,771
171,952
(83,974)
(39,272)
251,797
132,680
(808) 202
(296) 74
Other comprehensive loss for the year
(606)
(222)
Total comprehensive profit for the year
251,191
132,458
Turnover
Operating profit before capital items Gain on revaluation of investment properties Profit on sale of investment properties Operating profit Interest receivable and similar income Interest payable and similar charges Fair value (loss)/gain on derivative financial instruments Gain on foreign currency exchange
12
5 6
Profit before tax Tax on profit
9
Profit for the year after tax Other comprehensive income Actuarial loss Deferred tax arising on actuarial loss
22 10
Financial statements
41
The Howard de Walden Estate Annual Report 2026 Strategic report
Governance
Group Statement of Financial Position as at 31 March 2026
Fixed assets Investment properties Tangible fixed assets Current assets Debtors: amounts falling due in more than one year Debtors: amounts falling due within one year Cash and cash equivalents
Creditors: amounts falling due within one year
Note
2026 £000
2025 £000
12 13
4,519,975 14,034
4,273,340 14,639
4,534,009
4,287,979
381 44,055 83,448
11,568 47,297 27,794
127,884
86,659
(119,168)
(125,808)
8,716
(39,149)
4,542,725
4,248,830
(635,049)
(593,597)
3,907,676
3,655,233
– (816,160)
– (766,254)
3,091,516
2,888,979
2,662 2,917 2,418,333 279,830 387,774
2,662 2,917 2,260,117 260,135 363,148
3,091,516
2,888,979
15 15
16
Net current assets/(liabilities) Total assets less current liabilities Creditors: amounts falling due after more than one year Net assets excluding provisions Provisions Defined benefit pension liability Deferred tax liability
17
22 10
Net assets Capital and reserves Called up share capital Merger reserve Revaluation reserve Other reserves Profit and loss account
19 20 20 20 20
Shareholders’ funds
The accounts were approved and authorised for issue by the Board of Directors on 12 August 2026 and were signed on its behalf by: Mark Kildea Director
Andrew Griffith Director
The notes on pages 46 to 65 form part of these financial statements.
Financial statements
42
The Howard de Walden Estate Annual Report 2026 Strategic report
Governance
Financial statements
Group Statement of Changes in Equity for the year ended 31 March 2026
At 1 April 2024 Profit for the year Other comprehensive loss
Called up share capital £000
Merger reserve £000
Revaluation reserve £000
Other reserves £000
Profit & loss account £000
Shareholders’ funds £000
2,667 – –
2,917 – –
2,210,750 – –
244,763 – –
345,766 132,680 (222)
2,806,863 132,680 (222)
Total comprehensive profit for the year Transfer of: — investment property revaluation gains — deferred tax arising on investment properties — realised profits
–
–
–
–
132,458
132,458
– – –
– – –
87,028 (19,708) (17,953)
– – 15,367
(87,028) 19,708 2,586
– – –
Redemption of share capital – A shares
(5)
–
–
5
(5)
(5)
Equity dividends paid
–
–
–
–
(50,337)
(50,337)
At 31 March 2025
2,662
2,917
2,260,117
260,135
363,148
2,888,979
At 1 April 2025 Profit for the year Other comprehensive loss
2,662 – –
2,917 – –
2,260,117 – –
260,135 – –
363,148 251,797 (606)
2,888,979 251,797 (606)
Total comprehensive profit for the year Transfer of: — investment property revaluation gains — deferred tax arising on investment properties — realised profits
–
–
–
–
251,191
251,191
– – –
– – –
231,209 (50,087) (22,906)
– – 19,695
(231,209) 50,087 3,211
– – –
Equity dividends paid
–
–
–
–
(48,654)
(48,654)
2,662
2,917
2,418,333
279,830
387,774
3,091,516
At 31 March 2026
43
The Howard de Walden Estate Annual Report 2026 Strategic report
Governance
Financial statements
Group Statement of Cash Flows for the year ended 31 March 2026
Note
Cash flows from operating activities Corporation tax paid
2026 £000
21
Net cash generated from operating activities Cash flows from investing activities Interest received and other fees Additions to investment properties Additions to tangible fixed assets Proceeds from sales of investment properties Proceeds from sales of tangible fixed assets
2026 £000
107,971 (17,500)
98,884
90,471 1,562 (48,821) (992) 27,111 –
(7,646)
Cash flows from financing activities Interest paid New long-term borrowings Long-term borrowings repaid Revolving credit facility drawn down Revolving credit facility repaid Capital distribution – A shares repaid Equity dividends paid
2025 £000
130,904 (32,020)
2,511 (51,593) (789) 42,185 40
Net cash used in investing activities
2025 £000
(28,822) 100,000 (58,108) 15,000 (15,000) – (48,654)
(21,140) (25,450) – (20,000) 10,000 (10,000) (5) (50,337)
Net cash used in financing activities
(35,584)
(95,792)
Net increase/(decrease) in cash and cash equivalents
55,654
(26,461)
Cash and cash equivalents at 1 April
21
27,794
54,255
Cash and cash equivalents at 31 March
21
83,448
27,794
44
The Howard de Walden Estate Annual Report 2026 Strategic report
Governance
Company Statement of Financial Position as at 31 March 2026
Fixed assets Investments
Note
2026 £000
2025 £000
14
145,886
140,058
5
2
(75)
(75)
(70)
(73)
145,816
139,985
2,662 36,931 106,223
2,662 36,931 100,392
145,816
139,985
Current assets Cash and cash equivalents Creditors: amounts falling due within one year
16
Net current liabilities Net assets Capital and reserves Called up share capital Other reserves Profit and loss account
19 20 20
Shareholders’ funds
No profit and loss account is presented for Howard de Walden Estates Holdings Limited as permitted by section 408 of the Companies Act 2006. The profit after tax for the financial year of the Company amounted to £54,485,000 (2025: £50,237,000). The accounts were approved and authorised for issue by the Board of Directors on 12 August 2026 and were signed on its behalf by:
Mark Kildea Director
Andrew Griffith Director
The notes on pages 46 to 65 form part of these financial statements.
Financial statements
45
The Howard de Walden Estate Annual Report 2026 Strategic report
Governance
Financial statements
Company Statement of Changes in Equity for the year ended 31 March 2026
Called up share capital £000
Other reserves £000
Profit & loss account £000
Shareholders’ funds £000
2,667
40,926
96,497
140,090
Profit for the year
–
–
50,237
50,237
Total comprehensive income for the year Transfer of realised profits Bonus issue of share capital – A shares Equity dividends paid
– – (5) –
– (4,000) 5 –
50,237 4,000 (5) (50,337)
50,237 – (5) (50,337)
At 31 March 2025
2,662
36,931
100,392
139,985
At 1 April 2025
2,662
36,931
100,392
139,985
Profit for the year
–
–
54,485
54,485
Total comprehensive income for the year Equity dividends paid
– –
– –
54,485 (48,654)
54,485 (48,654)
2,662
36,931
106,223
145,816
At 1 April 2024
At 31 March 2026
46
The Howard de Walden Estate Annual Report 2026 Strategic report
Governance
Financial statements
Notes to the accounts
for the year ended 31 March 2026
1. General information
2. Accounting policies
Howard de Walden Estates Holdings Limited (‘the Company’) is a private limited company, limited by shares, incorporated in England and Wales. The registered office is 23 Queen Anne Street, London, W1G 9DL. Its registered number is 06439246.
2.1 Basis of preparation of financial statements These financial statements have been prepared in accordance with applicable United Kingdom (UK) Accounting Standards, including Financial Reporting Standard 102 – ‘The Financial Reporting Standard applicable in the UK and Republic of Ireland’ (‘FRS 102’) and with the Companies Act 2006.
The principal activity of the Group is long-term property investment.
The financial statements have been prepared under the historical cost convention as modified by the revaluation of investment properties and the modification to a fair value basis for certain financial instruments as specified in the relevant accounting policies. The financial statements are prepared in sterling which is the functional currency of the Group and rounded to the nearest £000. Basis of consolidation The consolidated financial statements incorporate the financial statements of the Company and entities controlled by the Group. Control is achieved where the Group has the power to govern the financial and operating policies of an entity so as to obtain benefits from its activities. All intragroup transactions, balances, income and expenses are eliminated in full on consolidation. The Group financial statements consolidate the financial statements of Howard de Walden Estates Holdings Limited and all its subsidiary undertakings drawn up to 31 March each year. Exemptions under the reduced disclosure framework The Company meets the definition of a qualifying entity under FRS 102 and has therefore taken advantage of the reduced disclosure exemptions available to it in respect of these financial statements. Exemptions have been taken in relation to financial instruments and the presentation of a Statement of Cash Flows, as equivalent disclosures have been shown in the consolidated financial statements.
47
The Howard de Walden Estate Annual Report 2026 Strategic report
Governance
Financial statements
Notes to the accounts for the year ended 31 March 2026 continued 2. Accounting policies (continued) The following principal accounting policies have been applied: 2.2 Going concern Given the ongoing economic uncertainty, the Group’s financial forecasts were subject to some sensitivity analysis. All scenarios considered provided no concerns with regards to the Group’s ability to continue as a going concern. The Group’s financial forecasts continue to factor in the adverse economic conditions and rising costs.
2.5 Profit on sale of investment properties Profits or losses on the sale of investment properties are calculated by reference to the fair value at the end of the previous year, adjusted for any subsequent capital expenditure. Current year profits or losses are presented in the Statement of Comprehensive Income and realised profits or losses are subsequently transferred into the Other reserves. 2.6 Tangible fixed assets Land and buildings held and used in the Group’s own activities for administrative purposes are stated in the Statement of Financial Position at cost.
The forecasts demonstrate that the Group will have sufficient liquidity to fund its operations as well as appropriate headroom to comply with debt covenants.
Depreciation is provided on tangible fixed assets to write off the cost less estimated residual value of each asset over its expected useful economic life.
Based on these considerations, the Directors are satisfied that the Group remains a going concern and therefore, the Group continues to adopt the going concern basis in preparing its financial statements.
Freehold land and buildings are not depreciated, as the Group is satisfied that the residual value of these assets exceeds their carrying value.
2.3 Turnover and income recognition Turnover represents the amounts receivable for rental income, goods and services, net of VAT. Rental income is recognised on the basis of the amount receivable for the year. Where there is a rent free period and the amount is considered to be recoverable, the income is recognised evenly over the period of the lease term. The lease term is the non-cancellable period of the lease together with any further term for which the customer has the option to continue the lease, where, at the inception of the lease, the Directors are reasonably certain that the customer will exercise that option. Amounts received from customers to terminate leases or to compensate for dilapidations are recognised in the Statement of Comprehensive Income when the right to receive them arises. Rents charged in advance are shown as deferred income in the Statement of Financial Position. 2.4 Investment properties Investment properties are initially measured at cost, including any transaction costs. Investment properties are subsequently measured and included in the financial statements at fair value at each year end. For the purposes of these financial statements, in order to avoid double counting, the fair value reported is reduced by the carrying amount of any debtor balances resulting from the spreading of lease incentives. Any surplus or deficit on revaluation is recognised initially in the Statement of Comprehensive Income. All unrealised fair value gains and losses on investment properties are transferred to the non-distributable Revaluation reserve. Where a fair value deficit on an individual property is assessed by the Directors as representing a permanent diminution in value, the deficit is retained within the Profit and loss account reserve as an impairment and is not transferred to the Revaluation reserve. Reversals of such impairments are treated consistently. Deferred tax is provided on these gains or losses at the substantively enacted rate of UK corporation tax.
Depreciation is provided on assets at the following rates: Plant and machinery
— 10% of cost
Fixtures and fittings
— 15% of cost
Motor vehicles
— 25% of written down value
Office equipment
— 25% of cost
2.7 Investment in subsidiaries Investments in subsidiaries are accounted for at cost less provision for impairment in the individual financial statements. Amounts included as loans are recorded at transaction price and are receivable in more than one year. 2.8 Debtors Short-term debtors are measured at transaction price, less any impairment. Loans receivable are measured initially at fair value, net of transaction costs, and are measured subsequently at amortised cost using the effective interest method, less any impairment. 2.9 Creditors Short-term creditors are measured at transaction price. Other financial liabilities, including loans, are measured initially at fair value, net of transaction costs, and are measured subsequently at amortised cost using the effective interest method. 2.10 Cash and cash equivalents Cash and cash equivalents comprise cash at bank and in hand, net of bank overdrafts.
48
The Howard de Walden Estate Annual Report 2026 Strategic report
Governance
Financial statements
Notes to the accounts for the year ended 31 March 2026 continued 2. Accounting policies (continued) 2.11 Deposits received from customers Where deposits have been received from customers and placed in designated bank accounts, such amounts are not included in the Statement of Financial Position as assets of the Group nor as liabilities to customers. Amounts held at 31 March 2026 were £35,677,000 (2025: £29,964,000). 2.12 Operating leases: the Group as lessor Income in respect of operating leases is recognised within turnover in the Statement of Comprehensive Income on a straight-line basis over the lease term, in accordance with the policy for income recognition. 2.13 Operating leases: the Group as lessee Operating lease costs are recognised as an operating expense in the Statement of Comprehensive Income on a straight-line basis over the lease term. 2.14 Loan notes Interest bearing bank loans and loan notes are initially recorded at transaction price representing amounts drawn, net of any issue costs or arrangement fees. All borrowings are subsequently measured at amortised cost using the effective interest rate method. 2.15 Arrangement fees Costs incurred in the raising of loan finance are recorded as a deduction from the loan and subsequently amortised over the term of the loan using the effective interest rate method.
2.16 Financial instruments Financial assets and liabilities are offset and the net amount reported in the Statement of Financial Position when there is an enforceable right to set off the recognised amounts and there is an intention to settle on a net basis or to realise the asset and settle the liability simultaneously. Basic financial assets, which include trade and other receivables, cash and bank balances, are initially measured at their transaction price including transaction costs and are subsequently carried at their amortised cost using the effective interest method, less any provision for impairment. Discounting is omitted where the effect of discounting is immaterial. Basic financial liabilities, which include trade and other payables, bank loans and other loans are initially measured at their transaction price after transaction costs. Discounting is omitted where the effect of discounting is immaterial. Debt instruments are subsequently carried at their amortised cost using the effective interest rate method. Derivatives, including forward exchange contracts, futures contracts and interest rate swaps, are not classified as basic financial instruments. The Group uses financial derivatives, principally interest rate swaps and cross currency interest rate swaps, to manage its exposure to interest rate and foreign exchange risk and does not use them for trading. Such derivative financial instruments are initially recognised at fair value on the date on which a derivative contract is entered into and are subsequently re-measured at fair value at each year end. Amounts paid under interest rate swaps, both on obligations as they fall due and on early settlement, are recognised in the Statement of Comprehensive Income as interest payable and similar charges. Fair value movements on revaluation of derivative financial instruments are shown in the Statement of Comprehensive Income. The Group does not apply hedge accounting to its interest rate and cross currency interest rate swaps. Derivatives are carried as financial assets when the fair value is positive and as financial liabilities when the fair value is negative. Modifications to financial instruments which meet both of the following conditions are not considered a normal modification, rather the effective interest rate is amended with no gain or loss on modification: — The change is necessary as a direct consequence of interest rate benchmark reform; and — The new basis for determining the contractual cashflows is economically equivalent to the previous basis. The Group and the Company have applied the practical expedient in accordance with paragraph 11.20c of FRS 102.
49
The Howard de Walden Estate Annual Report 2026 Strategic report
Governance
Financial statements
Notes to the accounts for the year ended 31 March 2026 continued 2. Accounting policies (continued) 2.17 Foreign currencies Transactions in currencies other than the functional currency of the Group are initially translated at the spot rate of exchange on the date of the transaction and recorded in the Group’s functional currency. Monetary items denominated in foreign currencies at the reporting date are retranslated at the rate prevailing at the end of the reporting period. Non-monetary items that are measured at historic cost in a foreign currency are not retranslated. All exchange differences are recognised within the Statement of Comprehensive Income. 2.18 Current and deferred taxation Tax on profit represents the sum of the tax currently payable and deferred tax. The tax currently payable is based on taxable profit for the year. Taxable profit differs from the result as reported in the Statement of Comprehensive Income because of items of income or expense that are taxable or deductible in other years and items that are never taxable or deductible. The Group’s liability for tax is calculated using tax rates that have been enacted or substantively enacted by the end of the reporting period. Deferred tax is recognised on timing differences between the carrying amounts of assets and liabilities in the financial statements and the corresponding tax bases used in the computation of taxable profit. Deferred tax liabilities are generally recognised for all taxable timing differences. Deferred tax assets are generally recognised for all deductible temporary differences to the extent that it is probable that taxable profits will be available against which those deductible timing differences can be utilised. The carrying amount of deferred tax assets is reviewed at the end of each reporting period and reduced to the extent that it is no longer probable that sufficient taxable profits will be available to allow all or part of the asset to be recovered. Deferred tax assets and liabilities are measured on an undiscounted basis at tax rates which are expected to apply in the period in which the liability is settled or the asset is realised, based on tax rates (and tax laws) that have been enacted or substantively enacted by the end of the reporting period. The measurement of deferred tax liabilities and assets reflects the tax consequences that would follow from the manner in which the Group expects, at the end of the reporting period, to recover or settle the carrying amount of its assets and liabilities. Current and deferred tax for the year are recognised in the Statement of Comprehensive Income, except when they relate to items which are recognised in Other comprehensive income or directly in equity, in which case the current and deferred tax is also recognised in Other comprehensive income or directly in equity, respectively.
2.19 Pensions The Group runs a defined benefit scheme and a defined contribution scheme (‘Group Personal Pension Plan’) for its employees. Contributions payable to the Group Personal Pension Plan are charged to the Statement of Comprehensive Income as incurred. Pension costs relating to the defined benefit scheme are accounted for in accordance with FRS 102 section 28. The defined benefit scheme’s assets are measured at fair value, its obligations are calculated at discounted present value, and subject to meeting the conditions of FRS 102 section 28, any net surplus or deficit is recognised in the Statement of Financial Position. Operating and financing costs are charged to the Statement of Comprehensive Income, with service costs spread systematically over employees’ working lives, and financing costs expensed in the period in which they arise. Re-measurements, comprising actuarial gains and losses and the return on the defined benefit scheme assets (excluding amounts included in net interest), are recognised in Other comprehensive income in the period in which they occur. Professional actuaries are used in relation to the defined benefit scheme and the assumptions made are outlined in note 22. 2.20 Dividends Final equity dividends are recognised when they are approved. Interim equity dividends are recognised when they are approved and paid. 2.21 Related party transactions For the Company, advantage has been taken of the exemption provided by paragraph 33.1A of FRS 102 of not disclosing transactions with entities that are wholly owned members of the Group.
50
The Howard de Walden Estate Annual Report 2026 Strategic report
Governance
Financial statements
Notes to the accounts for the year ended 31 March 2026 continued 3. Significant accounting judgements and estimates
4. Turnover
In applying the Group’s accounting policies, the Directors are required to make judgements, estimates and assumptions concerning the future. Judgements, estimates and underlying assumptions are based on historical experience and other factors available when the financial statements are prepared. They are reviewed on an ongoing basis and revised when necessary. Revisions to accounting estimates are recognised in the period in which they occur, as well as future periods if the revision affects both current and future periods.
All of the Group’s turnover arises in the United Kingdom
In preparing the Group and Company financial statements, the judgements that may have a significant effect are those involving estimations which are explained below.
Turnover:
The estimates and assumptions that have a significant risk of causing material adjustment to the carrying amounts of assets and liabilities include:
Rental income Lease premiums Other income
Investment property valuations The Group carries its investment properties at fair value. In estimating the fair value, valuations are jointly overseen by the Group Executive Property Director and the Group Head of Investment, on the basis of market value in accordance with the Appraisal and Valuation Manual of the Royal Institution of Chartered Surveyors. The underlying rent, yield and capital value assumptions used in the valuation are independently reviewed by a third party, Newmark Gerald Eve LLP (‘Newmark’). Estimated future refurbishment and void costs are also factored into the valuations. More information regarding the valuation techniques and inputs used in determining the fair value of the property portfolio is disclosed in note 12.
2026 £000
2025 £000
180,762
164,954
2026 £000
2025 £000
179,357 400 1,005
164,094 142 718
180,762
164,954
2026 £000
2025 £000
1,662 7 244 1,125
1,085 14 – 337
3,038
1,436
Analysis by class of business:
5. Interest receivable and similar income
Bank interest receivable Net finance income relating to pensions Interest on corporation tax Other interest receivable
51
The Howard de Walden Estate Annual Report 2026 Strategic report
Governance
Financial statements
Notes to the accounts for the year ended 31 March 2026 continued 6. Interest payable and similar charges
Bank loans and overdrafts Unsecured loan notes Amortisation of loan issue costs Interest on corporation tax Loss on early settlement of derivative financial instruments
8. Directors and employees 2026 £000
2025 £000
1,094 24,663 236 317 391
613 24,768 302 –
26,701
25,683
2026 £000
2025 £000
Auditor’s remuneration: Fees payable to the Group’s auditor for the audit of the Company’s accounts
39
37
Fees payable to the Group’s auditor and its associates for other services: — Audit of the accounts of subsidiaries — Taxation compliance services — Taxation advisory services — Other non-assurance services — Audit of the Howard de Walden Estates Limited Retirement Benefits Scheme
160 181 11 195
154 175 17 185
22
21
Depreciation (note 13) Operating leases (investment properties) Operating leases (other)
1,356 94 311
1,221 94 338
Salaries Social security Pension costs
–
7. Profit before tax The profit before tax is stated after charging:
Staff costs, including Directors’ remuneration, were as follows:
2026 £000
2025* £000
16,341 2,444 970
14,379 1,913 1,526
19,755
17,818
The average monthly number of persons employed by the Group, including Directors, during the year was 151 (2025: 167). All were employed within the property investment business, with 132 (2025: 138) operating from head office and 19 (2025: 29) located in buildings across the estate. Where applicable, costs for those working in buildings across the estate are recharged to tenants either directly or via service charges. *The comparative figures have been restated by £555,000 to exclude costs relating to non‑employees. This restatement affects this note only and has no impact on any other financial statement balances or disclosures. The Group operates a defined contribution scheme (‘Group Personal Pension Plan’) for the benefit of the employees and Directors. The assets of the scheme are administered by an adviser. Directors’ remuneration Remuneration in respect of Directors was as follows: Aggregate emoluments Pension contributions
2026 £000
2025 £000
4,298 239
3,410 233
4,537
3,643
The Directors are considered to be key management personnel. The above aggregate emoluments represent employee benefits payable to key management personnel. Included within aggregate emoluments is £813,000 (2025: £489,000) in respect of long‑term incentive schemes. The above aggregate emoluments also include those in respect of the highest paid Director for the year ended 31 March 2026 of £1,402,000 (2025: £1,087,000) and a pension allowance of £94,000 (2025: £91,000). At 31 March 2026 there were three (2025: three) Directors accruing benefits under the Group Personal Pension Plan. The Company, Howard de Walden Estates Holdings Limited, did not employ any members of staff during the year (2025: nil). All Directors are remunerated through a subsidiary company, Howard de Walden Estates Limited.
52
The Howard de Walden Estate Annual Report 2026 Strategic report
Governance
Financial statements
Notes to the accounts for the year ended 31 March 2026 continued 9. Tax 2026 £000
Current tax: — UK Corporation tax — Adjustments in respect of previous years Total current tax charge for the year Deferred tax: — Origination and reversal of timing differences — On transition adjustments on financial instruments — On investment properties
2026 £000
2025 £000
2025 £000
32,143
18,794
1,723
543
33,866
19,337
21
116
– 50,087
111 19,708
Total deferred tax charge for the year
50,108
19,935
Tax charge on profit
83,974
39,272
Factors affecting tax for the year The tax for the year is higher (2025: lower) than the standard rate of corporation tax in the UK of 25% (2025: 25%). The differences are explained below: 2026 £000
2025 £000
Profit before tax
335,771
171,952
Profit multiplied by the standard rate of corporation tax in the UK of 25% (2025: 25%)
83,943
42,988
Effects of: Fixed asset differences Expenses not deductible for tax purposes Adjustments to tax charge in respect of previous years Non-taxable income Capital gains Other permanent differences
(2,310) 940 1,723 (63) (245) (14)
(5,337) 282 543 (183) 993 (14)
Total tax charge for the year
83,974
39,272
53
The Howard de Walden Estate Annual Report 2026 Strategic report
Governance
Financial statements
Notes to the accounts for the year ended 31 March 2026 continued 10. Deferred taxation
11. Dividends 2026 £000
2025 £000
(766,254)
At 1 April Profit and loss Other comprehensive income
2026 £000
(50,108) 202
At 31 March
2025 £000
(746,393) (19,935) 74
(49,906)
(19,861)
(816,160)
(766,254)
2026 £000
2025 £000
Included in provision for liabilities and charges
(816,160)
(766,254)
The liability for deferred tax comprises the following: — Accelerated capital allowances — Investment properties
(79) (816,081)
(260) (765,994)
(816,160)
(766,254)
Factors that may affect future tax charges The UK corporation tax rate was 25% for the year ended 31 March 2026 and the prior year. There are no known factors which may affect future tax charges.
Ordinary shares £9.14 per share paid on 7 April 2025 (2025: £8.70 per share paid on 8 April 2024) £4.57 per share paid on 30 September 2025 (2025: £4.35 per share paid on 24 September 2024) £4.57 per share paid on 12 December 2025 (2025: £4.35 per share paid on 6 December 2024)
‘A’ shares £nil paid in the year (2025: £7.51 per share paid on 24 September 2024)
2026 £000
2025 £000
24,328
23,169
12,163
11,584
12,163
11,584
48,654
46,337
–
4,000
48,654
50,337
After the year end, dividends of £24,327,000 on ordinary shares were approved and paid on 10 April 2026. Those dividends are not included in these accounts.
54
The Howard de Walden Estate Annual Report 2026 Strategic report
Governance
Financial statements
Notes to the accounts for the year ended 31 March 2026 continued 12. Investment properties (Group)
Valuation At 1 April 2025 Additions Disposals Revaluation At 31 March 2026 At 31 March 2025
ERV psf, Floor area, Capitalisation yields
4,273,340 49,860 (34,434) 231,209
Residential
Capital values psf, Floor area, Annual rental income
£595.00-£1,800.00
–
Office(1)
ERV psf, Floor area, Capitalisation yields
£45.00-£100.00+
4.25-6.00%
4,519,975
Retail
ERV Zone A psf, Floor area, Capitalisation yields
£100.00-£415.00+
4.25-4.50%
4,273,340
Restaurant
ERV psf, Floor area, Capitalisation yields
£85.00-£125.00
4.25%
Educational(1)
ERV psf, Floor area, Capitalisation yields
£45.00-£65.00
5.75-6.00%
Other
ERV psf, Floor area, Capitalisation yields
£nil-£50.00
3.00-8.00%
–
4.25-5.00%
4,248,711 49,860 (34,434) 230,646
24,629 – – 563
24,629
4.00-5.25%
Healthcare(1)
Total £000
4,248,711
£60.00-£105.00+
Key inputs
Leasehold £000
25,192
Yield range %
Property type
Freehold £000
4,494,783
Net effective ERV range/Capital value range £psf
The historical cost of investment properties for the Group at 31 March 2026 was £1,285,509,000 (2025: £1,247,177,000). The valuation of investment properties at 31 March 2026 and 31 March 2025 was jointly overseen by the Executive Property Director and the Head of Investment. The valuations have been prepared on the basis of market value in accordance with the RICS Valuation – Global Standards (‘Red Book Global Standards’). The underlying rent, yield and capital value assumptions used in the valuation were independently reviewed by Newmark and were considered to be appropriate. The key assumptions used to determine the fair value of investment property at 31 March 2026 are shown in the table adjacent.
(2)*
(1)
(1)
(1)
General deferment yields
–
Valuation method: income and capitalisation. Investment value.
(1)
(2) *
Short-term Residential valued by discounting net annual rental income at a rate of 7%.
Investment property rental income earned during the year was £179,357,000 (2025: £164,094,000) (note 4). The Group had contracted future minimum lease receivables as set out in note 25.
55
The Howard de Walden Estate Annual Report 2026 Strategic report
Governance
Financial statements
Notes to the accounts for the year ended 31 March 2026 continued 13. Tangible fixed assets (Group)
14. Investments (Company) Land and buildings £000
Other assets £000
Total £000
Cost At 1 April 2025 Additions Disposals
8,596 (18) –
10,691 807 (68)
19,287 789 (68)
At 31 March 2026
8,578
11,430
20,008
Depreciation At 1 April 2025 Charge for the year Eliminated upon disposal
– – –
4,648 1,356 (30)
4,648 1,356 (30)
At 31 March 2026
–
5,974
5,974
Net book value At 31 March 2026
8,578
5,456
14,034
At 31 March 2025
8,596
6,043
14,639
The Group’s office building included within land and buildings is held at cost as detailed above. Depreciation is not charged as detailed in note 2.6. The Directors consider the fair value of our office building to be £27,164,000 (2025: £27,164,000) as determined using the same assumptions and basis as detailed in note 12. No provision has been made for the tax which would arise should the Group dispose of its office building at the fair value listed above. Tax would be payable on disposal to the extent that rollover relief would not be available. The potential tax liability which would arise on the sale of the Group’s office building, at the latest substantively enacted rate of corporation tax, is approximately £4,475,000 (2025: £4,470,000).
Shares in subsidiary undertakings £000
Loans to subsidiary undertakings £000
Total £000
Cost At 1 April 2025 Net advances
1,331 –
138,727 5,828
140,058 5,828
At 31 March 2026
1,331
144,555
145,886
At 31 March 2025
1,331
138,727
140,058
Interests in subsidiaries The Company holds 100% of the shares and voting rights of Howard de Walden Estates Limited, which directly and indirectly holds all of the other interests in the subsidiary companies. At the year end, the Company had interests in the following subsidiaries which are all registered in England and Wales: Company
Type of business
Howard de Walden Estates Limited Portland Industrial Dwelling Company Limited*1 18 Marylebone Mews Limited Howard de Walden Telecommunications Limited*1 Marylebone Village Limited*2 Howard de Walden Estates (TLC) Limited*1 Howard de Walden Estates (TLC LP2) Limited*1 The London Clinic Limited Partnership Howard de Walden Estates (TLC GP) Limited*1 60 Portland Place Tenants Management Limited*2 Howard de Walden Management Limited*2
Property investment Property investment Property investment Property investment Dormant Property investment Property investment Property investment Property management Dormant Dormant
Interest held
100% 100% 100% 100% 100% 100% 100% 100%*3 100% 100% 100%
Company is exempt from the requirements of the Companies Act 2006 relating to the audit of the individual accounts by virtue of section 479A. Company is exempt from the requirements of the Companies Act 2006 relating to the audit of the individual accounts by virtue of section 480. *3 Proportion of voting rights held only. *1
*2
The registered office for each subsidiary is 23 Queen Anne Street, London, W1G 9DL. Loans to subsidiary undertakings Loans to subsidiary undertakings bear interest quarterly at SONIA plus a margin of 1.6193%. The loan is unsecured and repayable 1 year and 1 day following notice from the Company that repayment is required.
56
The Howard de Walden Estate Annual Report 2026 Strategic report
Governance
Financial statements
Notes to the accounts for the year ended 31 March 2026 continued 15. Debtors (Group)
16. Creditors
Due after more than one year
2026 £000
2025 £000
Other debtors Derivative financial assets (note 24)
381 –
501 11,067
381
11,568
10,513 784 22,613 78 10,067
9,675 4,093 24,944 186 8,399
44,055
47,297
Due within one year Trade debtors Other debtors Prepayments and accrued income Capitalised arrangement fees Derivative financial assets (note 24)
Amounts falling due within one year (Group) Trade creditors Other creditors Corporation tax Other taxation and social security Accruals and deferred income Bank loans and other borrowings (note 18)
2026 £000
2025 £000
5,704 324 70 2,665 55,057 55,348
7,849 188 – 1,047 50,115 66,609
119,168
125,808
5 70
21 54
75
75
2026 £000
2025 £000
633,635 1,414 –
590,425 838 2,334
635,049
593,597
Amounts falling due within one year (Company) Trade creditors Accruals and deferred income
17. Creditors Amounts falling due after more than one year (Group) Bank loans and other borrowings (note 18) Accruals and deferred income Derivative financial liabilities (note 24)
57
The Howard de Walden Estate Annual Report 2026 Strategic report
Governance
Financial statements
Notes to the accounts for the year ended 31 March 2026 continued 18. Analysis of borrowings (Group) Unsecured loan notes (A): Amounts falling due within one year Issued 25 August 2010 $86m loan notes expiring 16 July 2025 – 5.23%
2026 £000
2026 £000
2025 £000
2025 £000
–
66,609
Issued 16 September 2011 $73m loan notes expiring 16 September 2026 – 4.66%
55,348
–
Total unsecured borrowings due within one year
55,348
66,609
58
The Howard de Walden Estate Annual Report 2026 Strategic report
Governance
Financial statements
Notes to the accounts for the year ended 31 March 2026 continued 18. Analysis of borrowings (Group) Amounts falling due in more than one year
2026 £000
Issued 25 August 2010 £25m loan notes expiring 16 July 2030 – 5.61% Issued 16 September 2011 $73m loan notes expiring 16 September 2026 – 4.66% Issued 9 October 2014 £40m loan notes expiring 16 October 2029 – 3.58% £40m loan notes expiring 16 October 2034 – 3.79% Issued 14 September 2016 £40m loan notes expiring 14 September 2031 – 2.54% £60m loan notes expiring 14 September 2036 – 2.74%
2026 £000
2025 £000
24,972
24,966
–
56,528
39,980 39,952
39,974 39,946 79,932
39,959 59,884
79,920 39,952 59,873
99,843 Issued 9 January 2019 £40m loan notes expiring 9 January 2034 – 3.01% £30m loan notes expiring 9 January 2039 – 3.11% £45m loan notes expiring 9 January 2044 – 3.20% £45m loan notes expiring 9 January 2049 – 3.29% £35m loan notes expiring 14 November 2034 – 3.11% £10m loan notes expiring 14 November 2039 – 3.21% £15m loan notes expiring 14 November 2044 – 3.30% £30m loan notes expiring 9 September 2042 – 3.61% £30m loan notes expiring 9 September 2048 – 3.57% Issued 15 October 2020 £15m loan notes expiring 9 July 2055 – 2.51% £35m loan notes expiring 9 July 2055 – 2.56% Issued 9 July 2025 £50m loan notes expiring 9 July 2032 – 5.43% £50m loan notes expiring 9 July 2037 – 5.83% Total unsecured borrowings due more than one year
2025 £000
39,957 29,947 44,889 44,858 34,951 9,978 14,954 29,921 29,892
99,825 39,951 29,943 44,883 44,851 34,945 9,976 14,952 29,916 29,887
279,347 14,955 34,930
279,304 14,954 34,928
49,885 49,877 49,779
49,882 – –
99,656
–
633,635
590,425
59
The Howard de Walden Estate Annual Report 2026 Strategic report
Governance
Financial statements
Notes to the accounts for the year ended 31 March 2026 continued 18. Analysis of borrowings (Group) (continued) Borrowings are repayable as follows: Instalments due: Within one year Two to five years Greater than five years
2026 £000
2025 £000
55,348 64,952 568,683
66,609 96,502 493,923
688,983
657,034
(A) Unsecured loan notes On 25 August 2010, the Group issued unsecured loan notes in a private placement. The Group has entered into derivative contracts in respect of the fixed rate US dollar loan notes totalling $111 million (£75 million equivalent), swapping the payments on the loan notes into sterling floating rates at a blended margin of 1.28% over LIBOR (1.56% over SONIA following the Interest Rate Benchmark Reform). At the year end, both US dollar loan notes issued on 25 August 2010 had matured. Accordingly, the corresponding derivative contracts matured. On 16 September 2011, the Group issued unsecured loan notes in a private placement. The Group has entered into derivative contracts in respect of the fixed rate loan notes swapping the payments on the loan notes into sterling floating rates at a blended margin of 1.15% over LIBOR (1.41% over SONIA following the Interest Rate Benchmark Reform). At the year end, the derivative contracts in place fix the amount of borrowings repayable on the final remaining tranche at £45.2 million. On 9 October 2014, the Group issued a total of £100 million fixed rate unsecured loan notes in a private placement with an average rate payable of 3.63%. During the prior year, the £20 million tranche of the unsecured loan notes matured and was repaid. On 14 September 2016, the Group issued £100 million of unsecured loan notes in a private placement with £40 million at a fixed rate of 2.54% and £60 million at a fixed rate of 2.74%. On 9 January 2019, the Group agreed a total of £280 million of unsecured loan notes at different fixed rates of interest in a private placement with two tranches of deferred funding. £160 million was drawn on 9 January 2019 with £40 million at 3.01%, £30 million at 3.11%, £45 million at 3.20% and £45 million at 3.29%. A further £60 million was drawn on 14 November 2019 with £35 million at 3.11%, £10 million at 3.21% and £15 million at 3.30%. The final £60 million was drawn on 9 September 2021 with £30 million at 3.61% and £30 million at 3.57%.
On 15 October 2020, the Group agreed £50 million of unsecured loan notes in a private placement comprised of two tranches of deferred funding. Both tranches attract fixed rates of interest, £15 million at 2.51% and £35 million at 2.56%. The £15 million tranche was drawn on 11 July 2022 and the £35 million tranche was drawn on 11 September 2023. On 9 July 2025, the Group agreed £100 million of unsecured loan notes in a private placement with £50 million at a fixed rate of 5.43% and £50 million at a fixed rate of 5.83%, maturing in 7 and 12 years, respectively. Unsecured loan notes denominated in US Dollars are retranslated at the rate prevailing at the reporting date. Arrangement fees are capitalised and once the loan notes are drawn, amortised up to the expiration of the loan notes. Arrangement fees relating to undrawn loan notes are included in debtors due within one year at the year end. The Group’s borrowings are made up of: Drawn loan debt in a mixture of US dollars and pounds sterling at forward contracted rates Foreign currency exchange adjustments on the US dollar debt Capitalised arrangement fees
2026 £000
2025 £000
680,229 10,124 (1,370)
638,337 19,823 (1,126)
688,983
657,034
(B) Bank loans and overdrafts The Group aims to have a minimum of 75% of current net debt subject to fixed interest rate protection. The fixed rate protection is achieved via the use of interest rate swaps which attract varied levels of interest and fixed rate unsecured loan notes. On 2 July 2021, the Group entered into an amendment and restatement agreement to vary the terms of the existing revolving credit facility of £150 million. The Group took up the option to extend the facility to December 2026 on existing terms. The margin payable remains dependent on the level of utilisation with non-utilisation fees of 35% of the prevailing margin. The minimum margin payable on this facility is 1.20% and the highest margin payable is 1.55%. At the year end for both the current and previous year, the facility was undrawn. Subsequent to the year end, on 7 August 2026, the Group entered into a new £100 million revolving credit facility. This facility replaces the Group’s previous revolving credit facility and has an initial term of five and a half years, with two further one-year extension options available.
60
The Howard de Walden Estate Annual Report 2026 Strategic report
Governance
Financial statements
Notes to the accounts for the year ended 31 March 2026 continued 19. Called up share capital (Group and Company)
Allotted, called up and fully paid 2,661,780 ordinary shares of £1 each
20. Reserves (Group and Company) 2026 £000
2025 £000
2,662
2,662
Merger reserve The consolidated financial statements are prepared under the principles of merger accounting. This reserve is used to record the difference between the costs of the investment in the subsidiary companies and the nominal value of the share capital acquired that arose upon the group reconstruction. Revaluation reserve This non-distributable reserve is used to record: — Cumulative unrealised fair value gains and losses on investment properties, excluding permanent diminutions in value recognised as impairments and retained within the Profit and loss account reserve. — Cumulative deferred tax on fair value gains and losses on investment properties. Other reserves This reserve is used to record cumulative realised profits and losses on property sales including enfranchisement property sales. It is also used to record both capital redemption reserve and share buyback reserve balances. At the year end, the value of the capital redemption reserve aggregated to £33,330,000 (2025: £33,330,000). Profit and loss account The Profit and loss account is used to record the cumulative retained profit and losses recognised in the Statement of Comprehensive Income less dividends and items transferred to the above reserves.
61
The Howard de Walden Estate Annual Report 2026 Strategic report
Governance
Financial statements
Notes to the accounts for the year ended 31 March 2026 continued 21. Notes to the Statement of Cash Flows (Group) (A) Reconciliation of profit to net cash inflow generated from operating activities
Profit for the year after tax
(C) Analysis of change in net debt
2026 £000
2025 £000
251,797
132,680
Adjustments to reconcile profit for the year after tax to cash generated from operations: Gain on revaluation of investment properties Depreciation of tangible fixed assets Asset write down Gain on disposal of tangible fixed assets Profit on sale of investment properties Difference between pension charge and cash contributions Interest receivable and similar income Interest payable and similar charges Fair value loss/(gain) on derivative financial instruments Gain on foreign currency exchange Decrease in debtors Increase in creditors Tax on profit
(231,209) 1,356 1,436 (2) (7,751) (801) (3,038) 26,701 9,399 (9,699) 2,033 6,708 83,974
(87,028) 1,221 – – (6,391) (282) (1,436) 25,683 (148) (2,711) 1,311 5,800 39,272
Cash generated from operations
130,904
107,971
83,448
27,794
(B) Cash and cash equivalents Cash and cash equivalents comprise the following: Cash at bank and in hand
Cash and cash equivalents Cash Borrowings Debt due within one year Debt due after one year
Total
Cash flows £000
Other non-cash changes £000
At 31 March 2026 £000
27,794
55,654
–
83,448
(66,609) (590,425)
58,108 (99,628)
(46,847) 56,418
(55,348) (633,635)
(657,034)
(41,520)
9,571
(688,983)
(629,240)
14,134
9,571
(605,535)
At 1 April 2025 £000
62
The Howard de Walden Estate Annual Report 2026 Strategic report
Governance
Financial statements
Notes to the accounts for the year ended 31 March 2026 continued 22. Pensions (Group)
Reconciliation of opening and closing balances of the present value of the scheme liabilities
Defined benefit pension scheme The Group operates a defined benefit scheme in the UK. The major assumptions used by the actuary as at 31 March 2026 are shown on the following pages. The Group paid contributions at the rate of 73.2% of pensionable earnings from 1 April 2025 through to 31 December 2025. From 1 January 2026, the Group paid contributions at the rate of 32.0% of pensionable earnings. With effect from 31 March 2026, all remaining members withdrew from the Scheme, therefore the Group does not expect to pay any contributions in the year commencing 1 April 2026. Amounts recognised in the Statement of Financial Position
Fair value of plan assets Present value of scheme liabilities Defined benefit pension liability
2026 £000
2025 £000
23,968 (23,968)
23,398 (23,398)
–
–
Reconciliation of opening and closing balances of the fair value of scheme assets 2026 £000
2025 £000
Fair value of scheme assets at start of year* Interest income Actuarial losses Contributions by the Group Benefits paid and expenses Adjustment to cumulative surplus not recognised
23,398 1,654 (125) 482 (999) (442)
26,802 1,508 (3,640) 549 (1,244) (577)
Fair value of scheme assets at end of year*
23,968
23,398
* Fair value of scheme assets stated net of cumulative irrecoverable surplus of £(5,335,000) (2025: £(4,893,000)).
The actual return on the scheme assets over the year ending 31 March 2026 was £(1,529,000) (2025: £(2,132,000)).
2026 £000
2025 £000
Scheme liabilities at start of year Current service cost Past service cost Interest expense Actuarial losses/(gains) Benefits paid and expenses
23,398 219 (538) 1,358 530 (999)
26,802 267 – 1,283 (3,710) (1,244)
Scheme liabilities at end of year
23,968
23,398
63
The Howard de Walden Estate Annual Report 2026 Strategic report
Governance
Financial statements
Notes to the accounts for the year ended 31 March 2026 continued 22. Pensions (Group) (continued)
Key assumptions
Amounts recognised in the Statement of Comprehensive Income
Discount rate RPI inflation
Current service cost Past service cost Net interest income
2026 £000
2025 £000
219 (538) (7)
267 – (14)
(326)
253
Amounts recognised in Other comprehensive income 2025 £000
(125) (863)
(3,640) 202
333
3,508
(655) 289 (442)
70 211 (577)
(808)
(296)
2026 £000
2025 £000
Equity instruments Debt instruments Other Property Cash and cash equivalents
5,633 19,094 2,051 1,373 1,152
8,201 15,462 2,413 1,495 720
Total assets
29,303
28,291
Gains/(losses) arising on:
Interest on irrecoverable surplus Adjustment to cumulative surplus not recognised
2025
6.20% 3.35%
5.90% 3.15%
Salary escalation Deferred pension revaluation — RPI 5%
N/A
4.65%
3.35%
3.15%
Pension increases — Post 1 April 2003 (RPI max 5%) — Pre 1 April 2003 (Fixed 5%)
3.20% 5.00%
3.05% 5.00%
25.7 27.0 27.5 29.0
25.2 26.6 27.3 28.7
Mortality assumptions 2026 £000
Return on plan assets Effect of experience adjustments Effects of changes in the demographic and financial assumptions underlying the present value of the plan liabilities
2026
Assets
None of the fair values of the assets shown above include any of the Group’s own financial instruments or any property occupied by, or other assets used by, the Group.
Implied life expectancy at age 62 — Male currently aged 62 — Male currently aged 42 — Female currently aged 62 — Female currently aged 42
Group Personal Pension Plan The Group makes contributions to a Group Personal Pension Plan. Contributions for the financial year were £929,000 (2025: £983,000).
64
The Howard de Walden Estate Annual Report 2026 Strategic report
Governance
Financial statements
Notes to the accounts for the year ended 31 March 2026 continued 23. Financial instruments (Group)
24. Derivative financial instruments (Group)
The carrying value of the Group’s financial assets and liabilities are summarised by category below:
Due within one year:
Financial Assets Measured at fair value through profit or loss: — Derivative financial assets Financial Liabilities Measured at fair value through profit or loss: — Derivative financial liabilities
2026 £000
2025 £000
10,067
19,466
2025 £000
10,067
8,399
2026 £000
2025 £000
Assets Cross currency interest rate swaps (note 15)
–
11,067
Liabilities Interest rate swaps (note 17)
–
2,334
Assets Cross currency interest rate swaps (note 15)
Due after more than one year: –
The Group gains and losses in respect of financial instruments are summarised below: Fair value (losses)/gains On derivative financial assets measured at fair value through profit and loss On derivative financial liabilities measured at fair value through profit and loss
2026 £000
(9,399) – (9,399)
2,334
In assessing fair value, the Directors use their judgement to select suitable valuation techniques and make assumptions which are mainly based on market conditions existing at the year end (897) date. The fair value of interest rate swaps and cross currency interest rate swaps is determined by using an independent pricing service which discounts estimated future cash flows based on the 1,045 terms and maturity of each contract and uses market interest rates for similar instruments at the 148 measurement date. These values are tested for reasonableness against counter party quotes. In February 2026, the Group exercised an option to terminate the interest rate swaps early for £2,725,000.
65
The Howard de Walden Estate Annual Report 2026 Strategic report
Governance
Financial statements
Notes to the accounts for the year ended 31 March 2026 continued 25. Lease commitments (Group)
26. Control and related party transactions
The Group had annual commitments due under non-cancellable operating leases in respect of investment properties for each of the following periods:
The principal family trust which controls the Group is the Lord Howard de Walden and Seaford’s Marriage Settlement Children’s Trust (‘the Trust’). The Trust received dividends on ordinary shares of £28,880,000 (2025: £27,524,000) and dividends on ‘A’ shares of £nil (2025: £2,359,000) during the year.
Due: Within one year Two to five years More than five years
2026 £000
2025 £000
13 50 80
13 50 93
143
156
The Group had future minimum operating lease receivables due under non-cancellable operating leases in respect of investment properties for each of the following periods: Due: Within one year Two to five years More than five years
2026 £000
2025 £000
157,099 397,840 2,403,920
139,273 341,352 1,493,658
2,958,859
1,974,283
A reduction in future minimum lease receivables is expected from the subsequent financial year following the introduction of the Renters’ Rights Act on 1 May 2026. The move from fixed-term assured shorthold tenancy agreements to assured periodic tenancies, under which tenants may give two months’ notice to terminate their tenancy, shortens the contractual commitment period for residential tenancies and consequently reduces the future minimum lease receivables disclosed. The Group had annual commitments due under non-cancellable operating leases in respect of other assets for each of the following periods: Due:
2026 £000
2025 £000
Within one year Two to five years
137 138
210 133
275
343
During the year, £256,000 (2025: £198,000) was paid by the Group in respect of costs incurred by the Howard de Walden Estates Limited Retirement Benefit Scheme.
66
The Howard de Walden Estate Annual Report 2026 Strategic report
Governance
Financial statements
Five year summary
Based on the financial statements for the years ended 31 March
2026 £m
2025 £m
2024 £m
2023 £m
2022 £m
Rental income
179.4
164.1
152.2
147.8
135.4
Revenue profit before tax*
96.5
75.7
74.6
74.9
64.2
Investment properties
4,520.0
4,273.3
4,168.4
4,449.1
4,635.8
Shareholders’ funds
3,091.5
2,889.0
2,806.9
3,071.1
3,191.2
Gearing
19.3%
21.1%
21.5%
18.0%
17.9%
Group Statement of Comprehensive Income
Group Statement of Financial Position
* E xcludes profits and losses from sale of investment properties, and gains or losses on investment properties, derivative financial instruments and foreign exchange.
67
The Howard de Walden Estate Annual Report 2026 Strategic report
Governance
Financial statements
Definitions
Annual General Meeting (AGM) Gathering of the Directors and shareholders once a year to discuss the previous year’s activities and accounts. Building Research Establishment Environmental Assessment Method (BREEAM) Science-based suite of validation and certification systems for the sustainable built environment. Conservation area An area of special architectural interest. Planning permission is required to carry out external alterations to buildings in a conservation area whether or not they are listed. Considerate Constructors Scheme (CCS) A non-profit-making, independent organisation founded in 1997 by the construction industry to improve its image. Construction sites, companies and suppliers voluntarily register with the Scheme and agree to abide by the Code of Considerate Practice, designed to encourage best practice beyond statutory requirements. Derivative financial instrument Includes currency and interest rate swaps, used to exchange US dollar debt to sterling. Estimated rental value (ERV) The open market rent which, on the valuation date, could be expected to be obtained on a new letting or rent review of a property. Gearing Net debt as a percentage of Shareholders’ funds. Harley Street Health District (HSHD) A concentrated area of medical excellence in Marylebone. Home to hundreds of independent practitioners, small clinics and full scale hospitals, covering an unrivalled array of medical specialties and related professions. Health and Safety Executive (HSE) The body responsible for the encouragement, regulation and enforcement of workplace health, safety and welfare, and for research into occupational risks in the UK. Institution of Occupational Safety and Health (IOSH) Chartered body for health and safety professionals.
Interest cover Operating profit before capital items divided by net finance costs. Interest rate swap A financial instrument where two parties agree to exchange an interest rate obligation for a pre‑determined period of time. These are used to convert floating rate debt to fixed rates.
Redevelopment Substantial works undertaken which fundamentally alter the structure of properties, or parts thereof, to prevent them from becoming obsolete. Refurbishment Works undertaken to repair and maintain properties, or parts thereof, without significant structural changes, to prevent them from becoming obsolete.
Investment property A property that is held for the purposes of earning rental income or for capital appreciation or both.
Renewable Energy Guarantees of Origin (REGO) Certificates evidencing the renewable origin of electricity supplied.
Key performance indicators (KPIs) Measures used by the Group to ensure that our business model is effective and our strategic objectives are met.
Renewable Gas Guarantees of Origin (RGGO) Certificates evidencing the renewable origin of gas supplied.
Last year The financial year ended 31 March 2025. Leasehold Reform Legislation Legislation derived from the Leasehold Reform Act, including subsequent amendments and additions, which allows for the lessee of a residential property to extend the lease or acquire the freehold under certain provisions. National Australian Built Environment Rating System (NABERS) An assessment method which provides simple, reliable and comparable sustainability measurement across building sectors. Net debt Total borrowings at forward contracted rates minus cash held. Net finance costs Interest payable excluding the finance charge relating to pensions, less interest receivable excluding the finance income relating to pensions. Passing rent The annual rental income receivable as at the year end date. Excludes rental income where a rent free period is in operation. Private placement Borrowings sourced from financial institutions other than banks, where loan notes are issued to investors.
Rent roll The annual contracted rental income at a particular point in time. Revenue profit before tax A measure of the recurring profit performance. Excludes profits and losses from the sales of investment properties, gains or losses on revaluation of investment properties, gains or losses on derivative financial instruments and gains or losses on foreign exchange. Scope 1, 2 and 3 emissions Scope 1 refers to direct emissions from sources owned or controlled by the Group. Scope 2 refers to indirect emissions from purchased electricity. Scope 3 refers to all other indirect, upstream and downstream value chain emission sources not owned or controlled by the Group. Scope 1 & 2 (location-based) A location-based method reflects the average emissions intensity of grids on which energy consumption occurs, using mostly grid-average emission factor data. Scope 1 & 2 (market-based) A market-based method reflects emissions from electricity that the Group have purposefully chosen. Shareholders’ funds The value of shareholders’ investment in the Group.
Shareholder value A measure of the Group’s ability to generate net asset increases for shareholders. It is represented by the increase in shareholders’ funds, plus dividends paid during the year, expressed as a percentage of opening shareholders’ funds. Sterling Overnight Index Average (SONIA) The average of the interest rates that banks pay to borrow sterling overnight from other financial institutions and other institutional lenders. This year The financial year ended 31 March 2026. UK Corporate Governance Code The UK Corporate Governance Code is sponsored by the Financial Reporting Council (FRC). The FRC monitors the implementation of standards and promotes best practice by companies, by issuing guidance, such as the Code. The Code covers such issues as Board composition and effectiveness, the role of Board committees, risk management, remuneration and relations with shareholders. WELL Building Standard (WELL) A roadmap for creating and certifying spaces that advance human health and wellbeing. Yield The anticipated income return from an investment property.
Strategic report
Howard de Walden Estates Holdings Limited The Howard de Walden Estate 23 Queen Anne Street London W1G 9DL Contact us: +44 (0)20 7580 3163 enquiries@hdwe.co.uk hdwe.co.uk Company registered number 06439246
Governance
Financial statements