
7 minute read
Red SimAngus Bulls


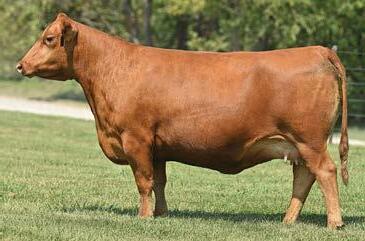
BC1 MR. 209J

Advertisement
Lht Mr Cowboy 480j
Red | 1/2
1/4 AR. Fall bull from a cow we purchased from Bar CK in Idaho. Thick made bull with excellent
4% and 10%
Red | PB SM. Purebred fall bull with an outcross red pedigree that goes back to Cowboy Cut. Gentle, very long strided, long spined bull who should be able to cover a lot of cows.

Reference Sire
Hxc Grindstone 9908g 4099632
Modest birth weight, elite growth and carcass merit in one complete package. A power bull loaded with muscle and depth of rib on a 6.2 frame score. Ranks in the top 1 percent of breed for both ProS and GridMaster indexes, top 6 percent for REA, and top 3 percent for Marbling. Posted growth ratios of 115 WW, 115 YW, 115 ADG. His dam has a 106 MPPA with excellent udder quality and feet.


FULL BROTHERS LOTS 76-80
Five ET full brothers from our A115 donor cow and the Red Angus bull, Grindstone. All dark red, big hipped bulls who should sire great daughters as well as growthy steers.
BC1 MR. K2124
BC1 MR. K219
LEACHMAN PLEDGE A282Z
100Y
BC1 MR. K262
FULL BROTHERS LOTS 76-80

BC1 MR. K298
BC1 MR. K271
BC1 MR. K275
Reference Sire
KJL/CLZB COMPLETE 7000E 3782419
BC1 MR. K249
| 1/2
1/2 AR. Heavy muscled 1/2 blood son of Complete. An absolute powerhouse with top 25% and 15% WW and YW, 20% Marb, and 20% TI.
| 1/4 SM 3/4 AR. Very good Complete son who should work on heifers or cows. Really attractive profiled, free moving bull that still has some power. Top 10% BW and Marb, 20% API and TI.


BC1 MR. K2139
3/4 AR. Another calving ease/maternal option from a good Redemption daughter. Top 20% and BW, 4%
10% API and 25% TI. Long sided bull from a solid cow family. Ratiod 122 for IMF.

Expected Progeny Difference (EPD) , is the prediction of how future progeny of each animal are expected to perform relative to the progeny of other animals listed in the database. EPDs are expressed in units of measure for the trait, plus or minus. Interim EPDs may appear on young animals when their performance has yet to be incorporated into the American Angus Association National Cattle Evaluation (NCE) procedures. This EPD will be preceded by an “I”, and may or may not include the animal’s own performance record for a particular trait, depending on its availability, appropriate contemporary grouping, or data edits needed for NCE.
Calving Ease Direct (CED), is expressed as a difference in percentage of unassisted births, with a higher value indicating greater calving ease in first-calf heifers. It predicts the average difference in ease with which a sire’s calves will be born when he is bred to first-calf heifers.
Birth Weight EPD (BW), expressed in pounds, is a predictor of a sire’s ability to transmit birth weight to his progeny compared to that of other sires.
Weaning Weight EPD (WW), expressed in pounds, is a predictor of a sire’s ability to transmit weaning growth to his progeny compared to that of other sires.
Yearling Weight EPD (YW), expressed in pounds, is a predictor of a sire’s ability to transmit yearling growth to his progeny compared to that of other sires.
Maternal Milk EPD (Milk), is a predictor of a sire’s genetic merit for milk and mothering ability as expressed in his daughters compared to daughters of other sires. In other words, it is that part of a calf’s weaning weight attributed to milk and mothering ability.
Cow Energy Value ($EN), expressed in dollar savings per cow per year, assesses differences in cow energy requirements as an expected dollar savings difference in daughters of sires. A larger value is more favorable when comparing two animals (more dollars saved on feed energy expenses). Components for computing the cow $EN savings difference include lactation energy requirements and energy costs associated with differences in mature cow size.
Carcass Weight EPD (CW), expressed in pounds is a predictor of the differences in hot carcass weight of a sire’s progeny compared to progeny of other sires.
Marbling EPD (Marb), expressed as a fraction of the difference in USDA marbling score of a sire’s progeny compared to progeny of other sires.
Ribeye Area EPD (RE), expressed in square inches, is a predictor of the difference in ribeye area of a sire’s progeny compared to progeny of other sires.
Fat Thickness EPD (Fat), expressed in inches, is a predictor of the differences in external fat thickness at the 12th rib (as measured between the 12th and 13th ribs) of a sire’s progeny compared to progeny of other sires.
$Indexes: an economic selection index allows multiple change in several different traits at once pertaining to a specific breeding objective. The $Value is an estimate of how future progeny of each sire are expected to perform, on average, compared to progeny of other sires if the sires were randomly mated to cows and if calves were exposed to the same environment.
Maternal Weaned Calf Value ($M) , an index, expressed in dollars per head, predicts profitability differences from conception to weaning with the underlying breeding objective assuming that individuals retain their own replacement females within herd and sell the rest of the cull female and all male progeny as feeder calves. The model assumes commercial producers will replace 25% of their breeding females in the first generation and 20% of their breeding females in each subsequent generation. Traits included are as follows: calving ease direct, calving ease maternal, weaning weight, milk, heifer pregnancy, docility, mature cow weight, claw set and foot angle.
Weaned Calf Value ($W), an index, expressed in dollars per head, to predict profitability differences in progeny due to genetics from birth to weaning. The underlying objective being producers will retain 20% of the female progeny as replacements and sell the rest of the cull females and their male counterparts as feeder calves. Traits included are as follows (in no particular order): birth weight, weaning weight, milk, and mature cow weight.
Feedlot Value ($F), an index, expressed in dollars per head, to predict profitability differences in progeny due to genetics for postweaning feedlot merit compared to the progeny of other sires. The underlying objective assumes producers will retain ownership of cattle through the feedlot phase and sell fed cattle on a carcass weight basis, but with no consideration of premiums or discounts for quality and yield grade. Traits contributing directly to the index are as follows: yearling weight (gain), carcass weight and dry-matter intake.
Grid Value ($G), an index, expressed in dollars per carcass, to predict profitability differences in progeny due to genetics for carcass grid merit compared to progeny of other sires. The underlying objective assumes producers will market cattle on an above-industry-average carcass grid. Traits included in the index are as follows (in no particular order): carcass weight, marbling, ribeye area, and fat.
Beef Value ($B), a terminal index, expressed in dollars per carcass, to predict profitability differences in progeny due to genetics for postweaning and carcass traits. This terminal index assumes commercial producers wean all male and female progeny, retain ownership of these animals through the feedlot phase and market these animals on a carcass grid. Traits included in the index are as follows: yearling weight, dry-matter intake, marbling, carcass weight, ribeye area and fat.
Combined Value ($C), an index, expressed in dollars per head, which includes all traits that make up both Maternal Weaned Calf Value ($M) and Beef Value ($B) with the objective that commercial producers will replace 20% of their breeding females per year with replacement heifers retained within their own herd. The remaining cull heifer and steer progeny are then assumed to be sent to the feedlot where the producers retain ownership of those cattle and sell them on a quality-based carcass merit grid. Expected progeny differences (EPDs) directly influencing a combined index: calving ease direct (CED) and maternal (CEM), weaning weight (WW), yearling weight (YW), maternal milk (Milk), heifer pregnancy (HP), docility (DOC), mature cow weight (MW), foot angle (Angle), claw set (Claw), dry matter intake (DMI), marbling (Marb), carcass weight (CW), ribeye area (RE) and fat thickness (Fat).
We appreciate your interest in our programs!
Expected Progeny Difference (EPD) , EPDs are the most accurate and effective tool available for comparing genetic levels. In using EPDs, the difference between two sires’ EPDs represents the unit difference expected in the performance of their progeny. For example, if sires A and B have EPDs of +10 and –5, a 15-unit difference would be expected in their progeny (moving from -5 to +10 yields 15 units). Key to using EPDs is knowing what units they are expressed in. For example, if the above case referred to weaning weight EPDs, A would be expected to sire 15-pounds more weaning weight than B. If calving ease were the trait, A would be expected to sire 15-percent more unassisted births in first-calf heifers; in other words, if B sired 30 assists in a group of 100 heifers, we’d expect A to require 15 assists. A percentile-ranking chart is required to determine where a bull’s EPDs rank him relative to other bulls in the breed.
Maternal Weaning Weight (MWW): Pounds of weaning weight due to milk and Yield grade score.

Pounds of carcass weight. Marbling score. Back Fat (BF): Inches of backfat. Square inches of ribeye.
Though EPDs allow for the comparison of genetic levels for many economically important traits, they only provide a piece of the economic puzzle. That’s where $ indexes come in. Through well conceived, rigorous mathematical computation, $ indexes blend EPDs and economics to estimate an animal’s overall impact on your bottom line. The same technology that led to the dramatic progress in swine, poultry and dairy genetics over the last several decades was used to develop the following $ indexes:
Evaluates sires for use on the entire cow herd (bred to both Angus first-calf heifers and mature cows) with the portion of their daughters required Evaluates sire for use on mature Angus cows with all offspring put on feed and sold grade and yield.
First, determine which index to use; if you’re keeping replacements use API, if not, TI. Then, just as with EPDs, zero in on the unit difference between bulls. (As described above, index units are in dollars per cow exposed.) The difference can be used to determine how much a bull is worth compared to another. Or, put another way, how much you can pay for one bull compared to another. For example, when buying an all-purpose type sire, you can quickly figure a bull scoring +100 for API is worth an extra $6,000 over a +50 bull if both are exposed to 30 cows over 4 years ($50 diff. x 30 hd. x 4 yr. = $6,000). A percentile-ranking chart is required to determine where a bull’s index value ranks him relative to other bulls in the breed. For percentile rankings or more detailed information about EPDs and $ indexes visit www.simmental.org.


