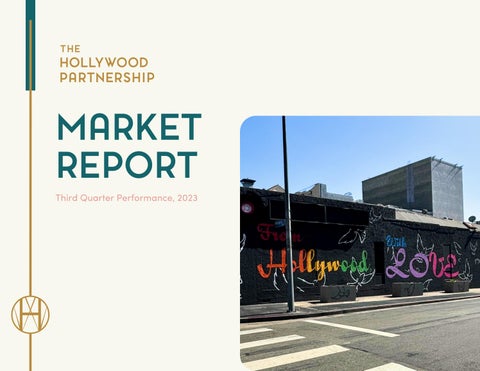
MARKET REPORT Third Quarter Performance, 2023
Table of Contents 2
The District
3
Executive Summary
4
At A Glance
5-6
Top Stories
7-10
Working In Hollywood
11-16
Living In Hollywood
17-22
Visiting Hollywood
23-25
Retail In Hollywood
26 1
Upcoming Development
The Hollywood Entertainment District
The Hollywood Partnership (THP) is a non-profit organization that manages the public realm within the Hollywood Entertainment District (HED), which is a Property Based Business Improvement District (PBID). Simply, this means that the organization is funded by property owners within the district to provide enhanced services to promote the cleanliness, safety, beautification, and economic vitality of our neighborhood.
2
Executive Summary Amidst cloudless skies and sunny days, a shadow descended over the Hollywood community this summer as the prolonged writers and actors strike significantly impacted the industry that is so crucial to the health and vitality of our destination. It is on a rare occasion that you walk the streets of Hollywood without seeing those familiar yellow signs pointing the way to a production site nearby. We are hopeful that our neighbors working in film and television will reach an equitable agreement so they can soon get back to work, and we are eagerly looking forward to a prosperous end to 2023. This moment in Hollywood has left an indelible mark on us, proving that there is very little business in our City of Angels, without show business. The production industry is a vital contributor to our local economy and provides employment opportunities for hundreds of thousands of talented Angelenos. As always, the show must go on. We were thrilled by the Governor's decision to extend the state's $330 million Film and TV Tax Credit program in July. And, in Hollywood, local development like the expansion at Sunset & Gower Studios is adding one million SF of new studio space in the neighborhood, while the much anticipated grand re-opening of the historic Egyptian Theater by Netflix will continue the celebratory tradition of premiering new film and television projects on Hollywood Blvd. this November. Perhaps missing their favorite shows and stars, visitors flocked to Hollywood this summer to stroll the Walk of Fame, pose awkwardly with costumed characters and wax figures, and experience all the entertainment, dining, and rooftop options Hollywood has to offer. The neighborhood welcomed more than 15 million visitors in Q3, totaling 44.9 million visitors YTD. Summer Fridays have always been a somewhat "optional" work day in Los Angeles, and 2023 did not disappoint. The majority of employees in Hollywood are now working from home at least two days a week. In-office trips are most popular on Wednesdays and Thursdays, while Fridays, well... you may want to pick another day for that meeting. Office vacancy rates were up slightly in Q3, while Class A office continues to be most popular when it comes to new leasing opportunities. Despite our intense challenges, Hollywood is moving forward. There is no doubt that we have much more work to do, and the tasks ahead will not be easy. But, together, we will carry on. Please enjoy the following Market Report for Q3 2023.
3
Q3 AT A GLANCE HED DEMOS
HED VISITS 44.9 Million
57.1 Million
Domestic Visits Jan-Sept 2023
Domestic Visits Sept 2022-2023
47,936 Daytime Population 2023
Residents
Average Income: $80K Median Income: $55K Population: 31,469 Pop. Density: 22,478 / Sq. Mi.
Employees Average Income: $74K Median Income: $49K Population: 35,227
Visitors Average Income: $103K Median Income: $66K
Source: ESRI Community Analyst, LATCB, STR, The Hollywood Partnership
4
Q3 TOP STORIES HP Update: HOLLYWOOD ON STRIKE
Throughout Q2 and Q3, the ongoing labor strikes in Hollywood had a widespread impact on both resident’s livelihoods and the local economy. In July, striking members of the Writers Guild of America (WGA) were joined by members of SAG/AFTRA, practically bringing all production to a halt, affecting the film and television industry workers in Los Angeles and beyond. Late July saw thousands of hotel workers initiate a series of rolling strikes to demand better working conditions. And, in August, 11,000 LA City Workers walked off the job for a day in an effort to force the City to address its longterm staffing shortages. Finally, in early October, the WGA reached a tentative agreement with studio executives, resulting in the writer returning to work.
HP Update: SELMA ENCAMPMENT CLEANUP In August, a major encampment on Selma Ave. between Schrader St. and Las Palmas Ave. was successfully cleaned up by Mayor Karen Bass, County Supervisor Lindsey Horvath, City Councilmember Hugo Soto-Martínez, and the LAPD. Their efforts resulted in over 60 individuals in need being provided with interim housing. After the initial cleanup, our Hollywood Partnership Ambassador Teams took action, thoroughly cleaning the sidewalk, streets, and Selma Park. Furthermore, we collaborated with Selma Ave. Elementary school to install planters on the sidewalk, which helps to maintain the area's cleanliness.
5
Q3 TOP STORIES
HP Update: CHIEF MOORE VISITS HOLLYWOOD On Friday, September 29, The Hollywood Partnership welcomed LAPD Chief Michel Moore to our Community Dispatch Center. Chief Moore sat with a small group of board members, Captain Craig Heredia and officers from the LAPD Hollywood Division, and THP staff to engage in an important conversation about public safety in Hollywood. The Chief emphasized the significance of community collaboration in addressing crime-related issues. He acknowledged the role of programs such as THP's Dispatch Center and the clean, safe, and hospitality services it provides, which have significantly reduced the number of non-emergency calls to LAPD, thus to View theonReport enablingClick beatHere officers to focus more significant crimes.
HP UPDATE: WALK OF DAMES GETS A MAKEOVER The iconic Walk of Dames art program, originally installed on utility boxes along Hollywood Blvd. in 2018, has been restored showcasing 35 extraordinary women who have made an indelible mark on on the entertainment industry. Each of the 15 utility boxes in the program were sanded and repainted. The original artist made minor updates to the artwork and new wraps have been printed on a specialized material resistant to stickers, tape, and graffiti.
6
Working in Hollywood At its heart, Hollywood is a mecca for creativity and storytelling. Buoyed by a robust entertainment production ecosystem and brandishing a priceless name representing a neighborhood and an industry, Hollywood combines the best of laid-back Southern California culture with dedicated work, creative energy, and drive. While the community is home to a substantial share of entertainment production jobs consistent with its global brand, Hollywood features a diverse employment base. Other major employment clusters include information and technology firms, healthcare, personal and professional services, and abundant retail and food & beverage industry jobs. That diversity of employment translates directly to the diversity of the workforce, which is always on display throughout the neighborhood.
47,936 Daytime Population In HED
5 Million Annual Employee Visits to HED
7
Source: ESRI Community Analyst, Placer. ai
35,227 Employees In HED
Employee Race + Ethnicity White 30% Latinx 47%
$72,000 Average Employee Income In HED
Black 7% Asian 12%
Working Continued Diverse Employment Base 13%
12%
12%
10%
10%
8%
Professional, Scientific & Technical Services
Information
Accommodation & Food Services
Arts, Entertainment, Recreation
Retail
Education Services
7%
Finance, Insurance & Real Estate
6% Health Care
Q3 HED Employee Visits 2018-2023 The HED received 1.3 million employee visits during Q3, increasing slightly over Q2 figures. Hollywood continues to inch toward Q3 pre-pandemic levels, which averaged 1.62 million annually. However, national trends indicate that while employees are returning to their workplaces, they are opting to work in-office fewer days a week, which could ultimately impact the growth of annual employee visits in the long-term. 2,000,000
1,500,000
1,000,000
500,000
0
Q3 2018
Q3 2019
Q3 2020
Q3 2021
Q3 2022
Q3 2023
Source: ESRI Community Analyst, Placer.ai
8
Hollywood Office Market In Q3 2023, there was 66,953 SF of office leasing activity in Hollywood, bringing the year-to-date total to 251,458 SF. Office vacancy rates saw a modest 0.8% increase from the previous quarter and a 2.3% increase from the prior year. Class A office average asking rents increased to $5.15 PSF, over a dollar more than the citywide average. Additionally, in contrast to the citywide vacancy rate of 24%, the vacancy rate for Class A office space in Hollywood remains relatively low at 18%, reflecting the trend of "flight to quality." Businesses are looking for trophy spaces while reducing their footprints or "trading up" while "pairing down.”
4.9M SF
$4.82
$3.76
$5.15
$4.04
Hollywood Office Inventory
Hollywood Overall Avg. Monthly Asking Rent PSF
L.A. Overall Avg. Monthly Asking Rent PSF
Hollywood Class A Avg. Monthly Asking Rent PSF
L.A. Class A Avg. Monthly Asking Rent PSF
YTD Net Absorption Greater Hollywood Office Market: Q2 2023
9
200,000
$5.15
+12.% from Q2 2023 +4.9% from Q3 2022 Compared to $4.04 Citywide
-100,000
23.9%
+0.8% from Q2 2023 +2.3% from Q3 2022 Compared to 23.5% Citywide
Class A Asking Rents (PSF/monthly)
100,000 0
-200,000 -300,000 -400,000
Q 12 Q 020 2 2 Q 020 3 20 Q 20 4 20 Q 20 12 Q 021 2 2 Q 021 3 2 Q 021 4 2 Q 021 12 Q 022 2 2 Q 022 3 2 Q 022 4 20 Q 22 12 Q 023 2 2 Q 023 3 20 23
$4.82
Source: Cushman and Wakefield
300,000
+2.1% from Q2 2023 +3.9% from Q3 2022 Compared to $3.76 Citywide
Overall Asking Rents (PSF/monthly)
Overall Vacancy Rate
400,000
OFFICE DEVELOPMENT
Gr. Hollywood + HED
HED
2
6
1,418,571
15
Projects Under Construction
Projects Entitled
Total SF Entitled or Under Construction
Projects Proposed
2
3
1,325,524
5
Projects Under Construction
Projects Entitled
Total SF Entitled or Under Construction
Projects Proposed
OFFICE TRENDS: OFFICE AS A DESTINATION, NOT A REQUIREMENT As we gradually move towards a post-pandemic world, many companies are redefining their approach to office space. With the rise of remote work, the return to office is no longer seen as a strict requirement but rather a destination that employees will work from, likely for an abbreviated schedule of 2-3 days per week. This shift has led to a renewed focus on creating dynamic and engaging office environments that offer employees a sense of community and collaboration, as well as the tools and resources they need to do their best work. In Hollywood, proposed office developments such as 6000 Hollywood Blvd., are set to provide elegant open space options, mixed-use amenities, iconic views, and modern Class A office experiences to cater to employee needs.
Source: The Hollywood Partnership
10
Living in Hollywood Few places carry the same immediate name recognition or intrigue as Hollywood, attracting a diverse mix of people from all over the globe to live and work in the world's creative capital. With its central location, modern amenities, and reputation as the "most walkable neighborhood" in Los Angeles, Hollywood has its own unique character that appeals to modern-day creatives. The Hollywood population is primarily renters, has a median age of 36.5, and is upwardly mobile, with 54% having a bachelor’s degree or higher and with a median household income of $55,000. Hollywood residents are more likely to take transit, walk or work from home compared to citywide averages. As a result, there is high demand for living in Hollywood, particularly in the HED.
$55,053 Median Household Income In HED
31,469 Residential Population In HED
94% Renter Occupied In HED
22,478 Population Density (per square mile)
Higher Clickthroughs vs. 36.5 Time of Day
Median Residential Age Presentations are communication Intools HED that can be used as demonstrations.
11
Source: ESRI Community Analyst
54% Bachelors Degree or Higher In HED
1.67
Higher Avg. Household Size Clickthroughs vs. In HED Time of Day Presentations are communication tools that can be used as demonstrations.
LIVING CONTINUED Greater Hollywood Generations Hollywood's residential population includes a diverse mix of people from all age groups and generations, with millennials being the most well-represented group.
Greatest Generation 4.7%
Baby Boomer 14.8%
Race + Ethnicity
Alpha 4%
Millenial 39.9%
Black 9%
White 45%
Latinx 35%
Gen Z 17.7%
It is worth noting that figures indicate that residents desire to remain in their current homes for the next five years.
Gen X 19%
Asian 9%
Resident Commute Drive Alone
HED
City of LA
LA County
Carpool
48.8%
65.2
Public Transportation
Walk
6.7%
11.8%
Bicycle
19.5%
8.8%
8.9%
70%
Work From Home
7.7%
9.3%
3.2%
4.9%
2.5%
12.4%
10.9%
Source: ESRI Community Analyst
12
Multifamily Market Conditions While both the HED and Greater Hollywood boast higher monthly rents than the citywide average, they also exhibit slightly higher vacancy rates.
13
HED
Greater Hollywood
City of LA
7,363
46,621
488,836
Existing Units In HED
Existing Units In Greater Hollywood
Existing Units In City of LA
$2,841
$2,295
$2,137
Monthly Avg. Asking Rent
Monthly Avg. Asking Rent
Monthly Avg. Asking Rent
7%
6%
6%
Vacancy Rate
Vacancy Rate
Vacancy Rate
Source: CoStar Group, The Hollywood Partnership
MULTIFAMILY MARKET CONTINUED HED
Greater Hollywood
City of LA
LA County
Total Residential Inventory (Units)
7,363
46,261
488,836
1.3 Million
Avg. Residential Vacancy Rate (%)
6.8%
6.2%
5.5%
4.5%
Avg. Asking Rent PSF/Monthly
$3.66
$3.16
$2.98
$2.76
Avg. Asking Rental Rate Per Unit
$2,841
$2,295
$2,197
$2,137
Cap Rate (YTD)
5.5%
5.56%
5.08%
4.46%
Multifamily Residential Vacancy Rates (2010-2023) HED
While multifamily residential vacancy rates in the HED are higher than Greater Hollywood and Los Angeles, they often spike in correlation with an increase in deliveries. According to the latest report, HED vacancy rates have remained stable at 6-9% since Q4 of 2021. However, when analyzing the vacancy rates for Q3 over the years, it was found that 2023 has marked the lowest vacancy rate since 2015.
Gr. Hollywood City of LA
20 15 10 5
20 23 Q 3
20 22 Q 3
20 21 Q 3
20 20 Q 3
20 19 Q 3
20 18 Q 3
20 17 Q 3
20 16 Q 3
20 15 Q 3
20 14 Q 3
20 13 Q 3
20 12 Q 3
20 11 Q 3
Q 3
20 10
0
Source: CoStar Group
14
Hollywood Residential Development Greater Hollywood has 34 residential projects under construction or entitled, 41% of which are located in the HED. The HED boundaries contain 54% (2,769) of the approximately 5,171 residential units under construction or entitled in Greater Hollywood, reflecting the district's high density and population growth. Within the HED, 9% (261) of the total residential units planned will be affordable, while 12% (637) will be designated for affordable housing in the Greater Hollywood area.
Greater Hollywood + HED
13
21
5,171
37
Projects Under Construction
Projects Entitled
Total Units Entitled or Under Construction
Projects Proposed
2
12
2,769
10
Project Under Construction
Projects Entitled
Total Units Entitled or Under Construction
Projects Proposed
HED
15
Source: The Hollywood Partnership
RESIDENTIAL DEVELOPMENT CONTINUED Market Rate vs. Affordable Units Planned or Under Construction Proposed
Entitled
Under Construction
Market Rate Market Rate (75%)
HED
1,379
Affordable ( 25%) Affordable
3,245
1,176
Market Rate Market Rate (87%)
373
1,573 326
Affordable Affordable (13%) Rate Market Market Rate (91%)
453
Affordable Affordable (9%)
50 25 0
Gr. Hollywood
2,197
236 311
1,000
2,000
3,000
4,000
5,000
Development Highlight: 1201 Gower Street Address: 1201 Gower St. Developer: California Landmark Group Architect: PK Architecture Total SF: 216,259 SF
This proposed project will expand a 1940s apartment complex near Sunset Gower Studios, adding a total of 180,055 SF. The project plans to build a new 8-story building with 108 units of 1BR, 2BR, and 3BRs by demolishing 28 existing apartments. However, a 2-story, 44-unit apartment building at 36,104 SF will be retained. The architectural plan for the new building shows a Mediterranean-style structure with a tiered roofline that will provide ample space for courtyards and terrace decks. The project will feature 90 units at market rate and 18 affordable units. Source: The Hollywood Partnership
16
Visiting Hollywood For decades, Hollywood has brought joy to so many through the magic of its bedrock roots in entertainment. The neighborhood's unique blend of creativity and commerce continues to offer one-of-a-kind experiences for both visitors and residents. While constantly on the cutting edge, Hollywood retains a timeless glamour that permeates our hotels, restaurants, and attractions. Those who visit Hollywood hail from nearby California cities and faraway countries, as this neighborhood's many hotels and entertainment destinations appeal to all walks of life.
HED
Greater Hollywood
Walk of Fame
36.5 Million
102.2 Million
6.7 Million
Local/Domestic Visitors 2022
Local/Domestic Visitors 2022
Local/Domestic Visitors 2022
3.6 Hours
4.5 Hours
1 Hour
Average Stay 2023
Average Stay 2023
Average Stay 2023
The number of visits to the HED has steadily increased each year following the pandemic. From January to September 2023, the district welcomed over 44.9 million domestic visitors, almost as many as the yearly average before the pandemic. Looking at the total number of visits in the previous 12 months (Sept 2022-Sept 2023), which amounts to 57 million, it is highly probable that the HED's visitation will recover with a rate of over 100%, surpassing pre-pandemic levels. 17
Source: Placer.ai
VISITING CONTINUED HED Monthly Visits Over Time HED Total Annual Visits 2019
45.3M
2020
20.2M (Covid Hits)
2021
27.9M (61% Recovery)
2022
36.5M (80% Recovery)
6,000,000
4,000,000
2,000,000
Jan-Sept 2023 44.9M (99% Recovery)
0 Jan
Visitor Household Income 12%
Feb
Mar
Apr
May
$102,000 Average HH Income
10% 8%
Jun
Jul
Aug
Sep
Oct
Nov
Dec
Visitor Race + Ethnicity Black 7% Asian 13% White 38%
6% 4% 2%
<1 0 10 K K15 K 15 K20 K 20 K2 25 5K K3 30 0K K3 35 5K K4 40 0K K4 45 5K K5 50 0K K6 60 0K K7 75 5K K1 10 00 0K K -1 12 25K 5K 15 150 0K K -2 00 K >2 00 K
0%
Latinx 38% Source: Placer.ai
18
Hotel Market Conditions Over time, the average daily room rate for hotels in Hollywood has steadily increased and consistently remains higher than the citywide averages. The hotel occupancy rate in Hollywood saw a slight positive change in Q3 2023, with a 1% increase from the previous quarter and staying consistent year over year.
81%
$246
$200
433.7K
$88.7M
Occupancy Rate
ADR
RevPAR
Supply
Room Revenue
+0.1%
-1%
-1%
+2%
+1%
vs. Q3 2022
vs. Q3 2022
vs. Q3 2022
vs. Q3 2022
vs. Q3 2022
-8%
+3%
5.5%
+19%
+13%
vs. Q3 2019
vs. Q3 2019
vs. Q3 2019
vs. Q3 2019
vs. Q3 2019
Hollywood Hotel Average Daily Room Rate (Q3 2008- Q3 2023)
Gr. Hollywood City of LA
$250 $200 $150 $100 $50
19
Source: LATCB, STR
20 23 Q 3
20 22 Q 3
20 21 Q 3
20 20 Q 3
20 19 Q 3
20 18 Q 3
20 17 Q 3
20 16 Q 3
20 15 Q 3
20 14 Q 3
20 13 Q 3
20 12 Q 3
20 11 Q 3
20 10 Q 3
20 09 Q 3
Q 3
20 08
$0
Q 12 Q 01 2 0 2 Q 01 3 0 Q 201 4 0 2 Q 010 12 Q 01 2 5 2 Q 01 3 5 Q 201 4 5 2 Q 015 12 Q 01 2 6 2 Q 01 3 6 Q 201 4 6 2 Q 016 12 Q 01 2 7 2 Q 01 3 7 Q 201 4 7 2 Q 017 12 Q 01 2 8 2 Q 01 3 8 Q 201 4 8 2 Q 018 12 Q 01 2 9 2 Q 01 3 9 Q 201 4 9 Q 201 12 9 Q 02 2 0 2 Q 02 3 0 Q 202 4 0 2 Q 020 12 Q 02 2 1 2 Q 02 3 1 Q 202 4 1 2 Q 02 12 1 Q 02 2 2 2 Q 02 3 2 Q 202 4 2 2 Q 02 12 2 Q 02 2 3 2 Q 02 3 3 20 23
HOTEL MARKET CONTINUED
Hollywood Hotel Market Over Time
$0 2010 2011 2012 2013 2014 2015
Occupancy Rate
2016 2017
Hotel Occupancy Rate Hollywood vs. City of LA 2018 2019 2020 2021 2022
Gr. Hollywood
RevPAR
$200 100%
$150 75%
$100 50%
$50 25%
2023 0%
City of LA
100%
75%
50%
25%
0%
Source: LATCB, STR
20
Hollywood Hotel Development There are currently 15 hotel projects underway or approved in Greater Hollywood, which will offer a combined total of around 1,724 hotel rooms. Among these, 12 projects are exclusively hotels, while the remaining 3 are mixed-use developments. The HED region accounts for 9 of these projects, including Citizen M, The Hyatt Hotel Nue, and Ivar Gardens. Additionally, Level Hollywood's 36 suites are expected to open in Fall 2023, as part of the SMB Hollywood development located on Santa Monica Blvd.
Greater Hollywood + HED
2
8
1,724
5
Projects Under Construction
Projects Entitled
Total Hotel Rooms Entitled or Under Construction
Projects Proposed
1
7
1,380
3
Projects Under Construction
Projects Entitled
Total Hotel Rooms Entitled or Under Construction
Projects Proposed
HED
21
Source: The Hollywood Partnership
Top Travel Trends DOMESTIC TRAVELERS According to The 2023 State of American Survey via LA Travel & Convention Bureau (LATCB), there is currently strong consumer interest in travel, despite varying financial challenges. Domestic travelers have specific motivations when choosing when and where to invest their money. Here are some top domestic travel trends for 2023 and beyond.
Travel Motivation:
Trip Types:
Trip Activities - LA:
Domestic Markets - HWD:
1. Relaxation 2. Visit Friends & Fam 3. Escaping Daily Life Stress 4. Self-Care 5. Enjoying the Outdoors 6. Exploration
1. Family Trips 2. Romantic Getaways 3. Girlfriend Trips 4. Solo Trips
1. Dining 2. Shopping 3. Sightseeing 4. Amusement Parks 5. Beach/Waterfront 6. Art Gallery/Museum 7. Nightlife
1. New York City 2. San Francisco 3. San Diego 4. Riverside 5. Phoenix
INTERNATIONAL TRAVELERS Los Angeles continues to be a popular destination around the globe, ranking as the #2 most desired U.S. city to visit by international travelers. This is evidenced by a significant increase in international travel to LAX which saw a 24% YoY increase in Q3 alone.
Most Desired U.S. Destinations:
Top International Markets - LA County:
1. New York 2. Los Angeles 3. Las Vegas 4. Miami 5. San Francisico
1. China 2. United Kingdom 3. Australia 4. France 5. South Korea Source: LATCB
22
Retail in Hollywood
Hollywood's retail market plays a crucial role in the vibrancy of the neighborhood. It offers a vast inventory of 6.8 million SF of retail space, with half of it (3.4 million SF) located in the HED. Currently, The HED has around 505K SF of available retail space, with an average asking rent of $56.18 per SF annually. Although both Hollywood and the HED have higher retail vacancy rates when compared to LA's rate of 6%, their average rents PSF are higher than the citywide average of $38.84 per SF. Furthermore, mixed-use development projects are continuously emerging, bringing a significant future retail presence totaling 496,099 SF entitled or under construction in Hollywood, with 43% (211,624 SF) of that within the HED.
23
HED
Greater Hollywood
City of LA
3.4 Million
6.8 Million
100.3 Million
Retail Inventory (SF)
Retail Inventory (SF)
Retail Inventory (SF)
9.7%
7.8%
6.1%
Retail Vacancy Rate
Retail Vacancy Rate
Retail Vacancy Rate
$41.88
$46.92
$42.62
Retail Rent PSF/ Annually
Retail Rent PSF/Annually
Source: CoStar Group
Retail Rent PSF/Annually
RETAIL CONTINUED New HED Businesses - Q3
RDEN Bar & Restaurant - 6280 Hollywood Blvd.
Waku Waku - 1511 Cahuenga Ave.
UKA Restaurant at Japan House - Ovation Hollywood
Hoookah Headz - 6547 Sunset Blvd.
Ugo Cafe - 6933 Hollywood Blvd.
Dogdrop: Dog Daycare - 1724 Highland Ave.
MGD (Meat, Grille, Drink) - 1777 Ivar Ave.
Shirley Brasserie - Hollywood Roosevelt Hotel
Retail Vacancy Rates Over Time (2010-2023) The Q3 2023 retail vacancy rate in the HED increased slightly from Q2 to 10%. The Greater Hollywood rate is 8%. Mirroring Greater Hollywood’s trajectory, the HED’s retail vacancy rate rose between Q2 2020 to Q2 2021, decreased from Q3-Q4 2021, and then increased again from Q1 2022 to the Q3 2023.
HED Gr. Hollywood City of LA
10% 7.5% 5% 2.5%
20 20 10 Q 10 3 20 Q 20 11 Q4 2011 Q 1 20 11 Q2 2011 Q 3 20 12 4 Q 2012 Q 1 20 12 Q2 1 20 2 Q 3 20 13 4 Q 2013 Q 1 20 13 Q2 1 20 3 Q 3 20 14 4 Q 2014 Q 1 20 14 Q2 1 20 4 Q 3 20 15 4 Q 2015 Q 1 20 15 Q2 1 20 5 Q 3 20 16 4 Q 2016 Q 1 20 16 Q2 1 20 6 Q 3 20 17 4 Q 2017 Q 1 20 17 Q2 1 20 7 Q 3 20 18 4 Q 2018 Q 1 20 18 Q2 1 20 8 Q 3 20 19 4 Q 2019 Q 1 20 19 Q2 2019 Q 3 20 20 4 2020 Q1 Q 20 20 2 Q 2 200 Q 3 20 21 4 Q 2021 Q 1 2 20 1 Q2 2021 Q 3 20 22 4 Q 2022 1 Q 2 20 2 2 2 Q 20 2 Q 3 20 23 4 Q 2023 1 23 Q2 Q 3
0%
Source: CoStar Group, The Hollywood Partnership
24
Hollywood Retail Development Mixed-use development is a golden standard in Hollywood. Right now, 59 projects proposed, entitled, or under construction include a retail component. In the HED, this equates to 496K SF of retail.
Greater Hollywood + HED
8
21
Projects Under Construction
Projects Entitled
496,099
30
Retail SF Entitled or Under Construction
Projects Proposed
3
17
211,624
12
Projects Under Construction
Projects Entitled
Retail SF Entitled or Under Construction
Projects Proposed
HED
25
Source: The Hollywood Partnership
Upcoming Development The Hollywood Partnership tracks upcoming development regularly to keep you apprised of the latest projects planned or under construction in the HED and Greater Hollywood. Explore our Development Map, or check out our Development Matrix for a quick glimpse.
Higher Clickthroughs vs. Time of Day Click Hereare communication Presentations tools that can be used as To Explore Our demonstrations. Development Map
Higher Clickthroughs vs. Time of Day
Click Here To View Our Development Matrix Presentations are communication tools that can be used as demonstrations.
Click Here To View Our Virtual Economic Development Tour
*The Hollywood Partnership tracks development projects that are proposed, fully entitled, and under construction. Information included here reflects the status of each project as of the current quarter, and The Hollywood Partnership makes no representations as to the likelihood of completion for any individual project in light of market conditions.
26
MARKET REPORT Third Quarter Performance, 2023
The Hollywood Partnership 6922 Hollywood Blvd., Ste. 925 Hollywood, CA 90028 323.463.6767 info@hollywoodpartnership.com hollywoodpartnership.com