

This report captures a moment of real momentum within the Heart of London (HOL) area. Already this year, we have seen major investment activity, exciting redevelopment, and a remarkable return of international visitors, all underscoring the enduring strength of the West End.
Investor confidence has been especially strong. In Q1, over £108 million was transacted across 36 property sales - the highest quarterly total since 2023. A major portfolio purchase by Norges Bank Investment Management, accounted for the majority of these deals, with £51.5 million invested directly in our area. At a time when UKwide real estate investment has slowed, this sends a clear message that global investors continue to see the West End as a safe and attractive market.
Our commercial landscape is evolving too. The demolition of three office buildings marks change, but planned redevelopments will deliver a net gain in floorspace, ensuring capacity for the future. At the same time, office rents have risen by 4.1% to £90.66 per sq ft, signalling sustained demand for premium workspace in the district.
Most striking has been the resurgence of international visitors. Footfall grew by 47% quarter-on-quarter and 59% year-on-year - nearly one million more visitors than the same period last year. While seasonal factors played a part, it is hugely encouraging to see high levels of global audiences in the West End, supporting our hospitality, retail, cultural and arts sectors.
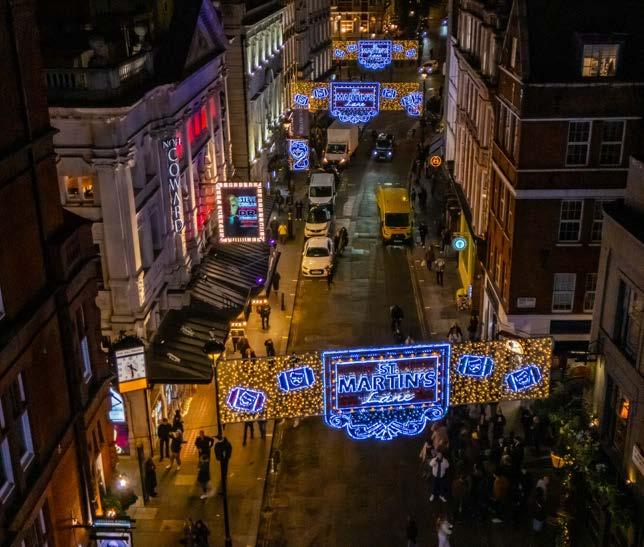
The quarter also brought important public realm developments. The Crown Estate and Westminster City Council launched plans to reimagine Regent Street, Haymarket and Piccadilly Circus, while the Mayor of London unveiled bold proposals to transform Oxford Street into a largely pedestrianised destination. St Martin’s Lane also secured funding for a temporary pedestrianisation scheme, supporting al fresco dining for the streets’ pubs, restaurants and cafés.
At HOLBA, we too continue to champion ambitious, long-term investment. Our report Unleashing Growth Through London’s Experience Economy released in Q1, highlights the West End’s £55.5 billion contribution to London’s GVA — including £9 billion from the Evening and Night-Time Economy — and sets out clear proposals to unlock further growth by aligning infrastructure, safety and policy frameworks.
The HOL area is evolving with pace and purpose. Looking ahead, I am committed to working with Government, investors, businesses and our community to ensure the West End continues to thrive as a world-class centre for commerce, culture and experience.
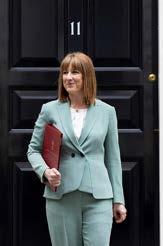
Ros Morgan Chief Executive, Heart of London Business Alliance

Q1 2025-26
The Insights Report provides a detailed look at the economic performance of real estate in the Heart of London area. It is designed for everyone who has an interest or a stake in this space (current or future).
Each quarter, the report uses local data, intelligence and media monitoring to analyse consumer habits and industry performance. It supports this with insights from leading experts. It also collates information, news, reports, consultations and policy changes that apply to the area and relevant industries.
Format: Online
Publishing: Quarterly
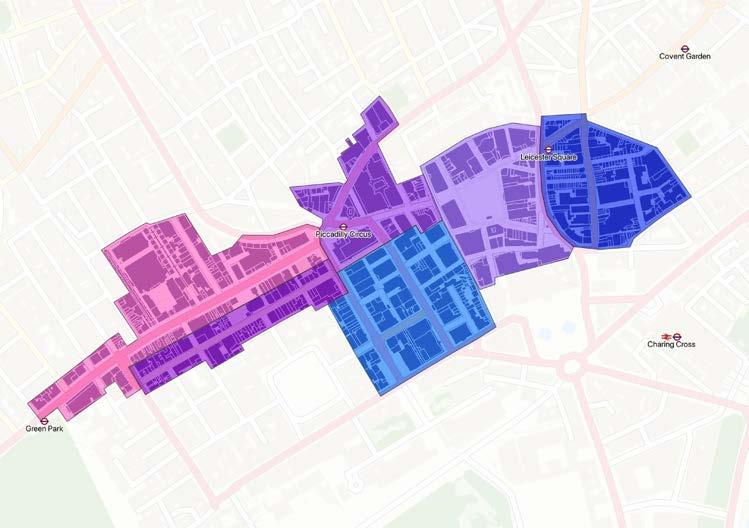
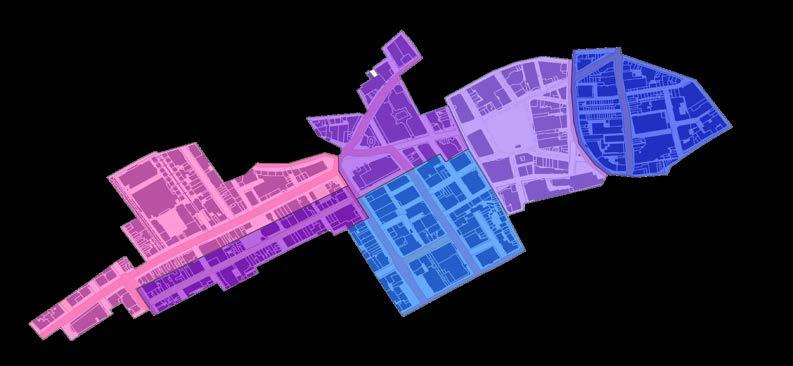
The Heart of London (HOL) area in the City of Westminster covers almost 37 hectares of prime central London real estate. Forming a major part of London’s West End, from Green Park in the west, to the borders of Covent Garden in the east, the HOL area is one of the most culturally rich in the world.
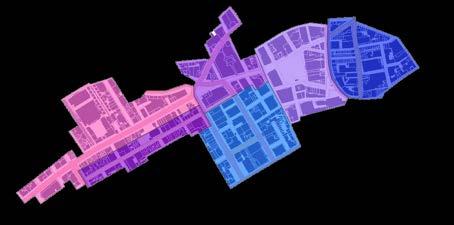
Within this report, the HOL area is classified into six districts: St Martin’s, Leicester Square, Piccadilly Circus, Haymarket, Piccadilly and Jermyn Street.
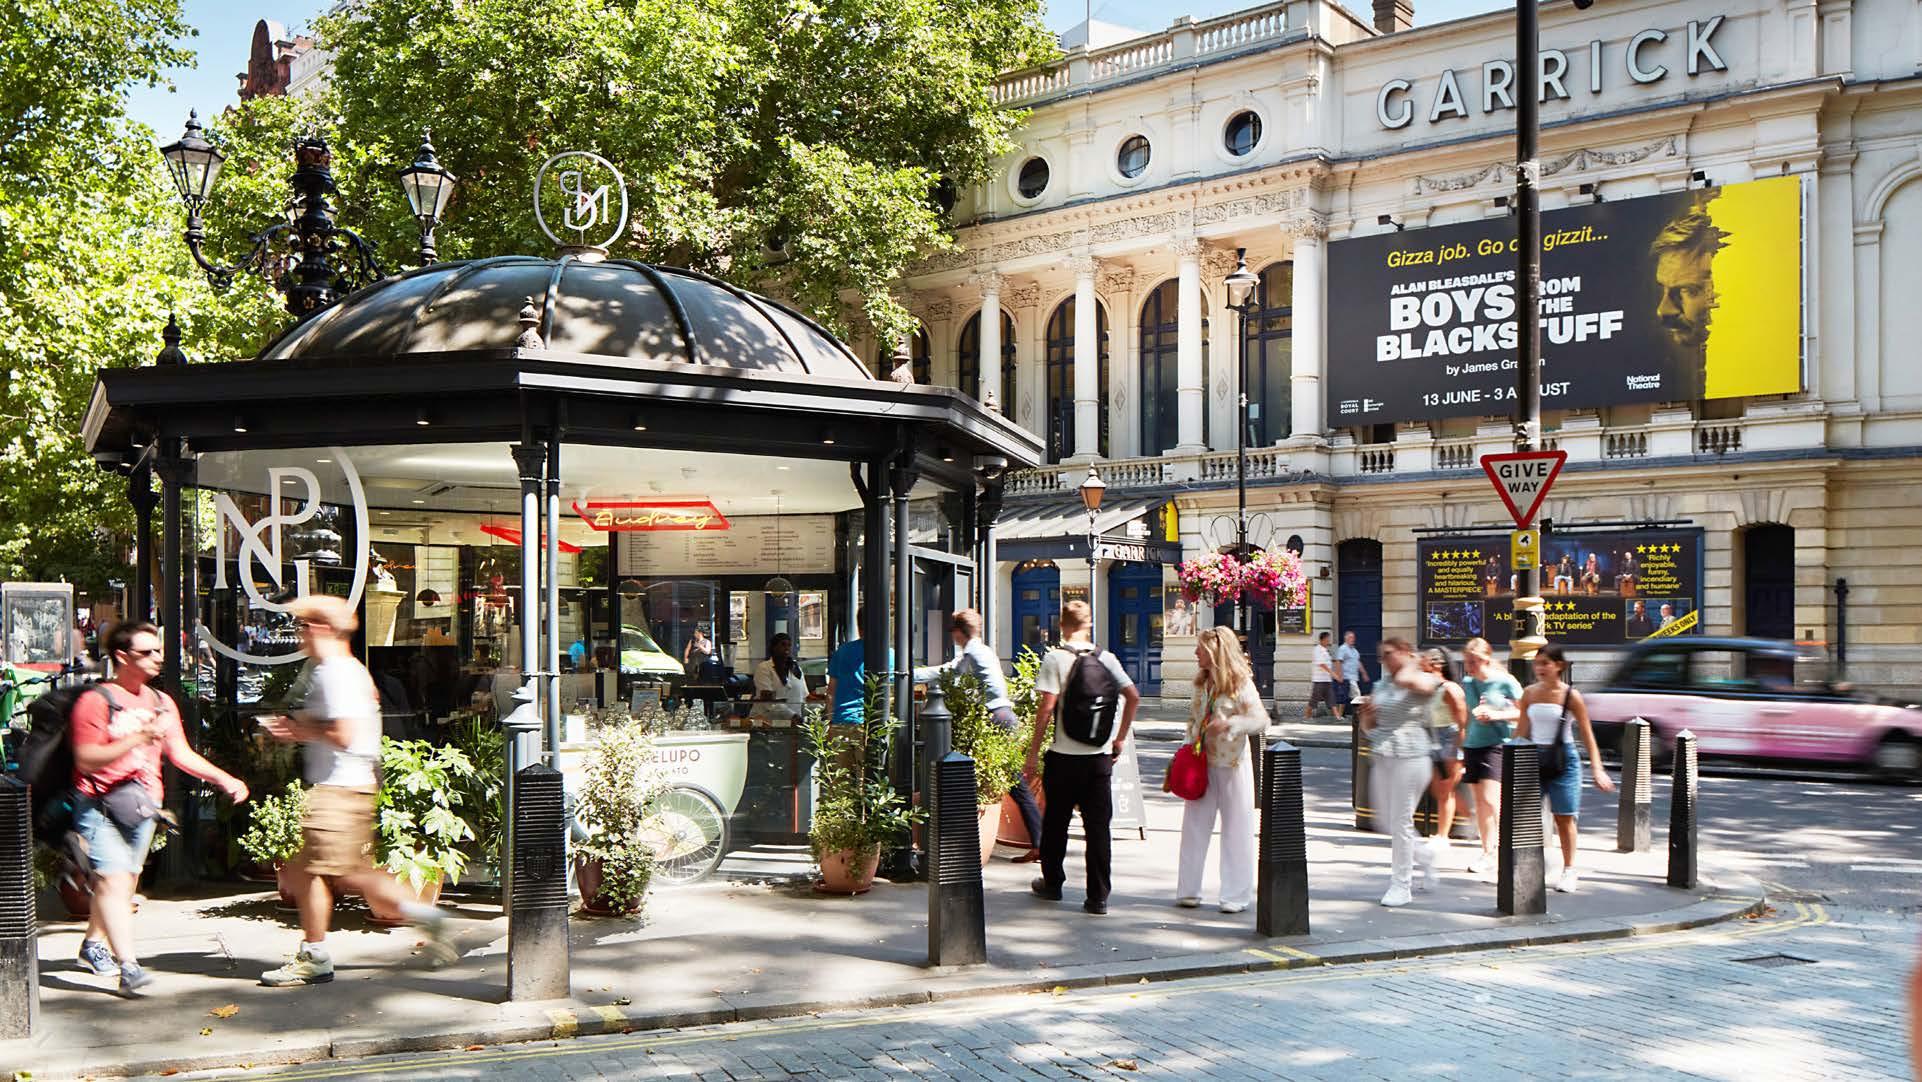
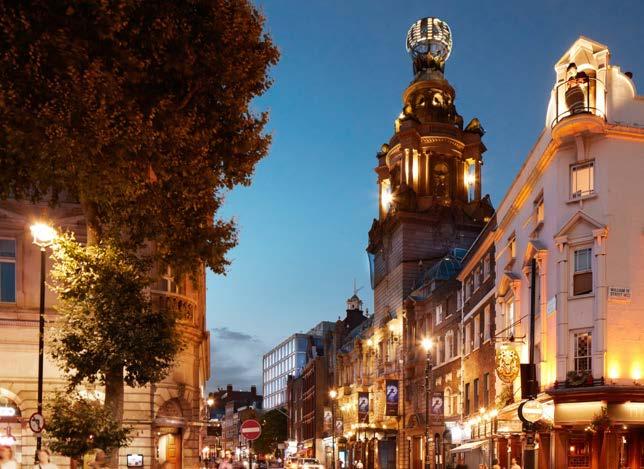
St Martin’s Lane lies between Garrick Street and Charing Cross Road, bordering Covent Garden and Leicester Square. It connects major visitor spots like Trafalgar Square, The National Gallery, The National Portrait Gallery, Shaftesbury Avenue, and Covent Garden. It is one of the capital’s most well-known streets and is home to the English National Opera, renowned theatres, live entertainment and music venues, bars, cafés, independent art and antique dealers, and offices.
Leicester Square is the epicentre of London’s film and entertainment industry. Located next to St Martin’s, it is one of the most famous tourist destinations in London with a wide range of retail and leisure offers. Leicester Square has numerous cinemas, casinos, restaurants, and bars. Located next to Chinatown and Leicester Square, Piccadilly Circus is one of the most iconic areas in London, known for its famous Piccadilly lights,
neon signs and the Anteros statue. As a place for the nation to celebrate, commemorate and commiserate, it is connected to Piccadilly, Regent Street, Shaftesbury Avenue and St James’s.
The Haymarket area is situated between Jermyn Street and Pall Mall East, with Leicester Square to the east and Piccadilly Circus to the north.
Haymarket houses the Theatre Royal, His Majesty’s Theatre, New Zealand House, a cinema complex, cafés, and restaurants.
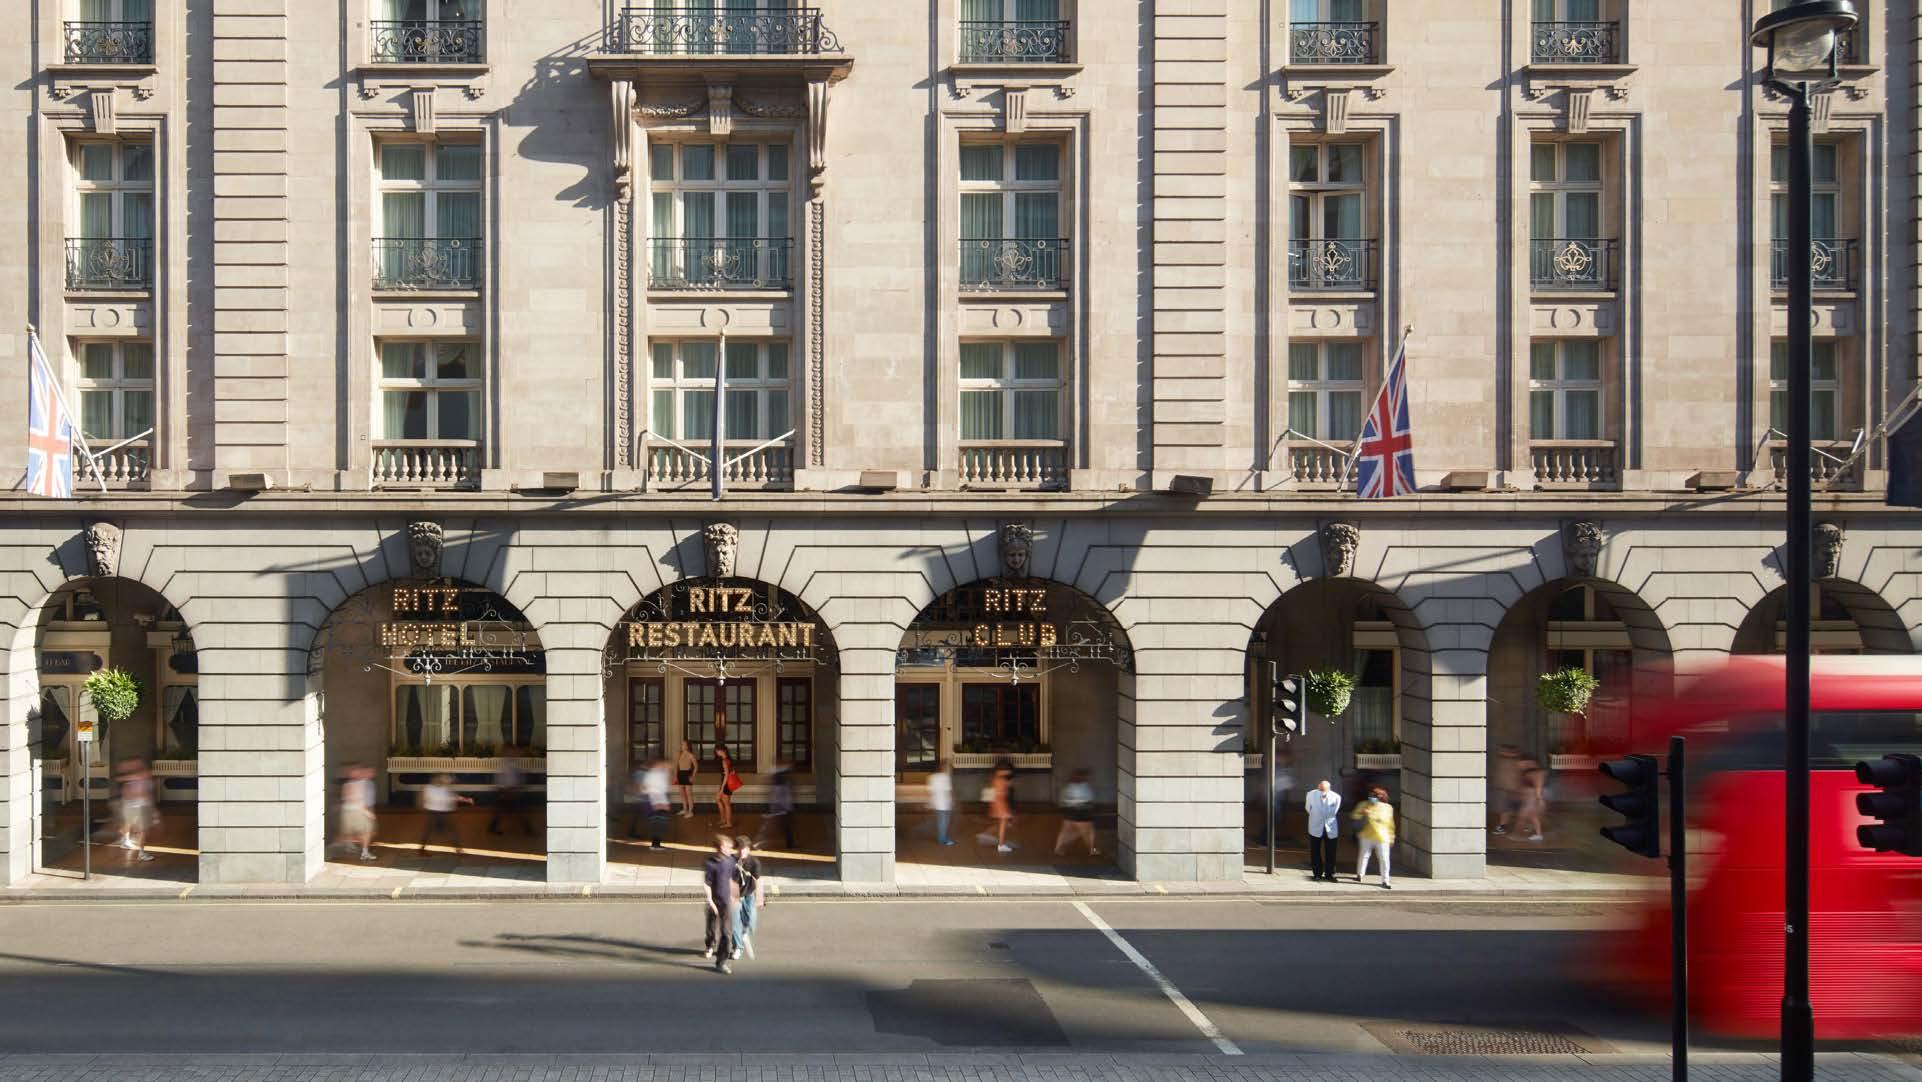
Piccadilly lies between Piccadilly Circus and Stratton Street, near Green Park Underground station. It is viewed as one of London’s primary shopping destinations, hosting world-renowned fashion brands. Fortnum & Mason, The Royal Academy of Arts and luxury hotels like The Ritz,
The Dilly, and Hotel Mayfair are situated on the street, accompanied by offices, cafés, and other retail establishments.
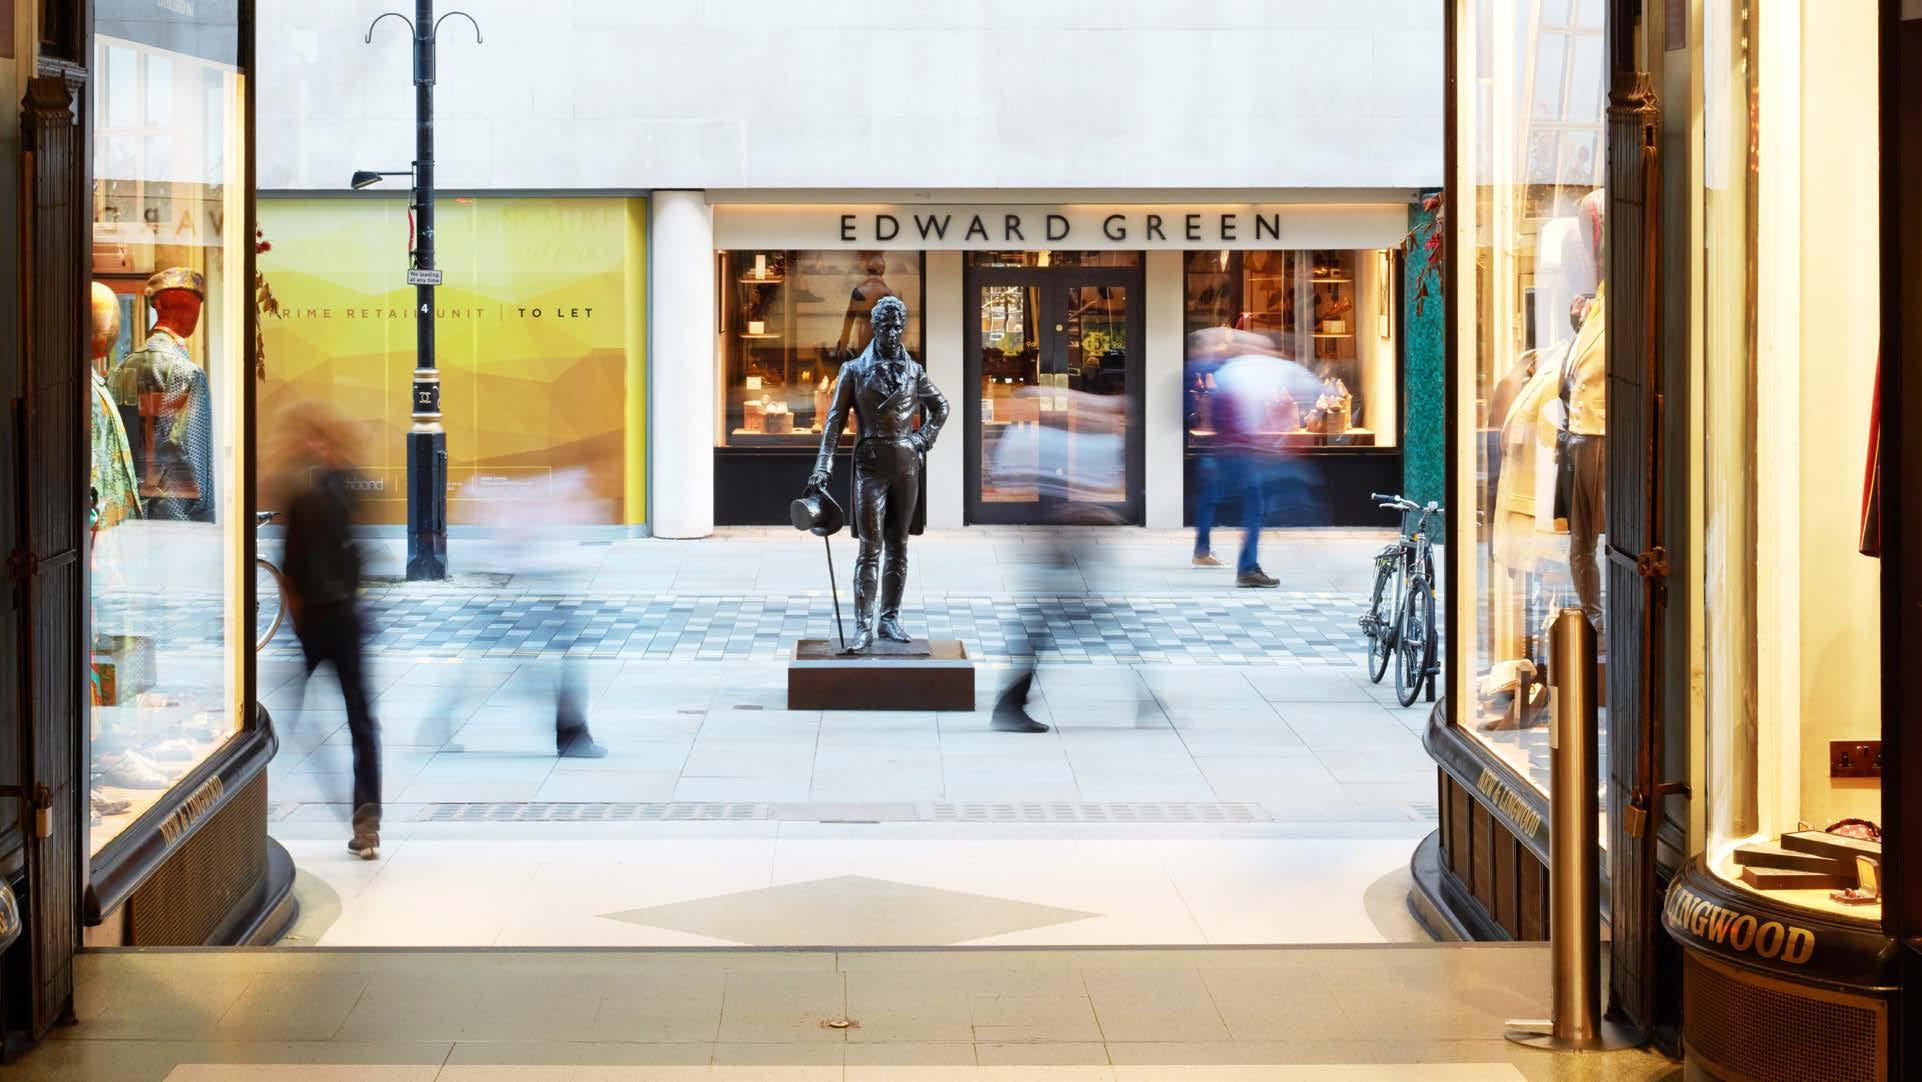
Lastly, Jermyn Street is located between St James’s Street and Lower Regent Street. Famous for its high-quality men’s tailors, many of these stores have operated for decades and have earned a reputation for their exceptional quality and craftsmanship.
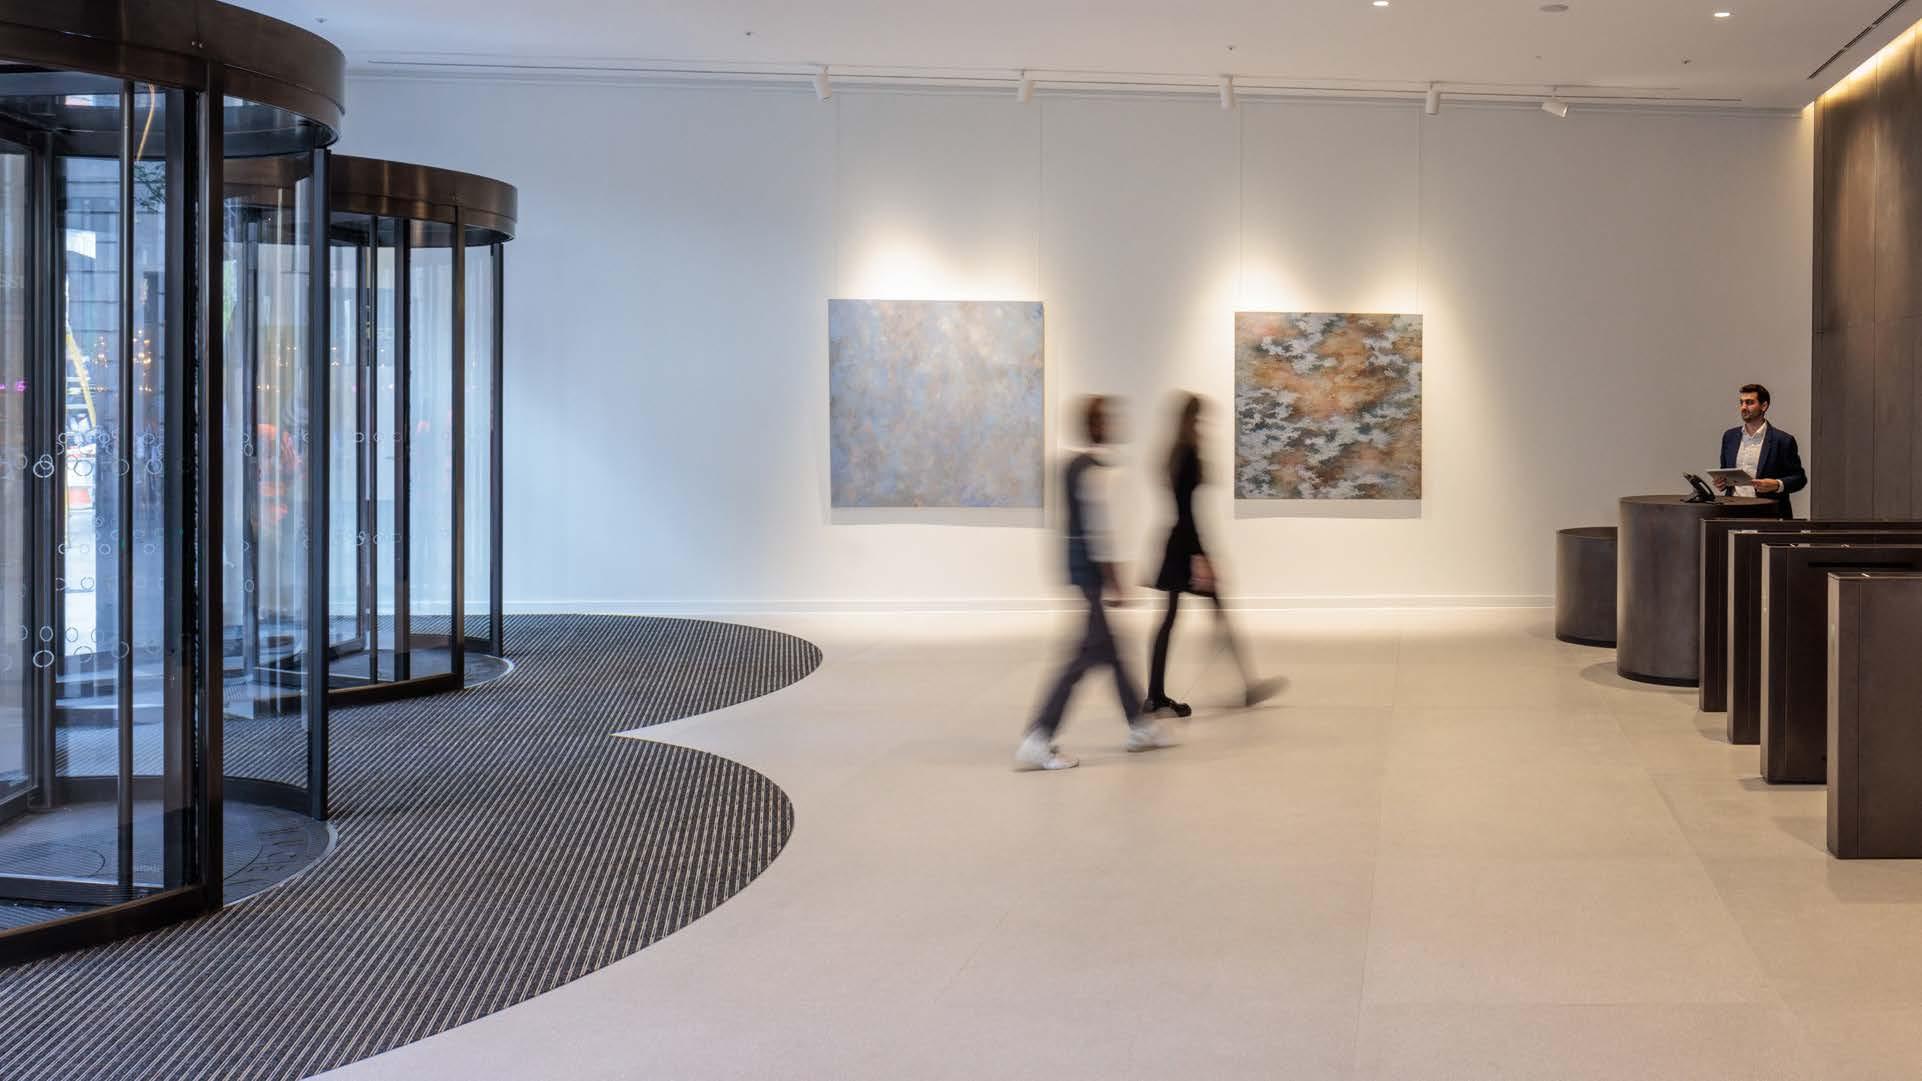
In this report, we study metrics for all office properties in the HOL area, between April and June 2025. We consider the office market within a challenging context, including the impact of the Chancellor’s Spring Statement, elevated construction costs and forthcoming EPC ratings change.
The office market is evolving. Despite the total office take-up across London reaching its highest level since 2019, and Central London seeing a 28% increase quarter-on-quarter, the flexible workspace market has reached one of its lowest levels for a decade. In the West End, flexible provider takeup peaked in 2019 and has struggled to exceed 200,000 sq ft per quarter since. Market intelligence suggests that a significant proportion of the traditional demand for flexible space is now being met by landlords providing fully fitted space. In a market where flexibility has been at the forefront of requirements, with fluctuating levels of in-office attendance and increased cost of borrowing, landlords are needing to be adaptable in their strategy.
Office market indicators across the HOL area have been broadly positive over Q1 2025-26. Market rents have risen by £3.60 per sq ft (+4.1%) since Q4 202425. Occupancy has risen marginally since the previous quarter, up to 93.2% (+0.7%). Availability has also risen marginally, increasing from 5.7% in the previous quarter to 7.1%, although the number of properties with units available (43) is unchanged. At average market leasing rates over the last five years, there is 1.1 years of office supply currently on the market, a slight (0.2 years) increase from the previous quarter. The number of office leasing transactions across Q1 2025-26 was nine (-3 from Q4).
Market dynamics across the wider West End were also broadly positive. While the number of transactions fell slightly from quarter to quarter, market rents rose by £1.74 (1.9%) to £95.52 per sq ft. The supply of available units rose marginally, with the number of years’ supply on the market reaching 1.3, an increase of 0.1 years from the previous quarter. Vacancy in the office sector fell marginally to 7.7% from 7.9% in Q4 2024-25.
Net absorption in the HOL area has been negative for four consecutive quarters for the first time since a period spanning 2020-21. Driving this net loss of occupied floorspace is likely due to the three property demolitions which took place in Q1 2025-26, as tenants
have vacated units in the properties awaiting demolition. The largest building demolished was at 33-35 Piccadilly, totalling 42,000 sq ft. The quantum of office and retail floorspace will increase by 85% based on The Crown Estate’s redevelopment plans, with 3,000 sq ft of ground floor retail and 30,000 sq ft of office spaces on upper floors. The sites of French Railways House (25,700 sq ft) at 177180 Piccadilly and the rear-adjoining 49-50 Jermyn Street (24,400 sq ft) have planning permission, secured by GPE, for an officeled redevelopment delivering 66,800 sq ft of upper-floor offices with two retail/restaurant units on lower floors.
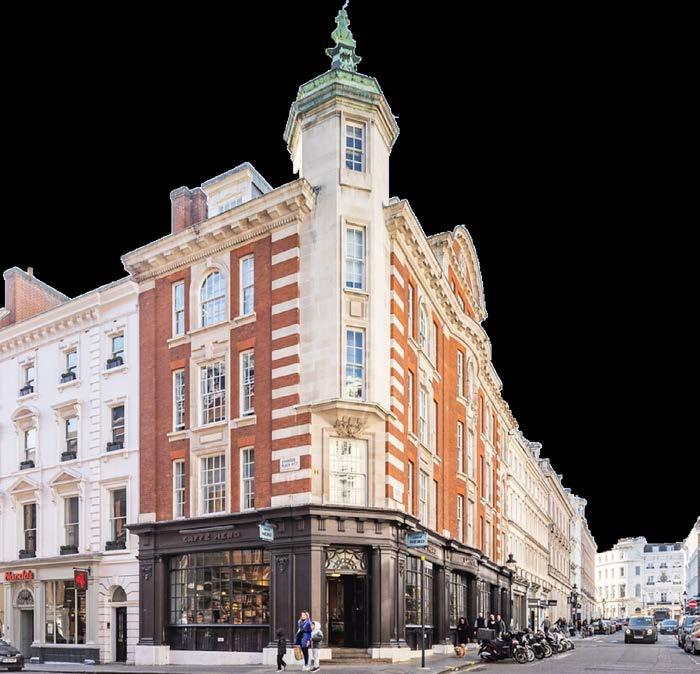
Along with the recent office to hotel conversion of Garrick House at 3-5 Charing Cross Rd (11,743 sq ft), the total quantum of office floorspace in the HOL area has fallen to just over four million sq ft. The planned redevelopments, as well as the office construction projects already underway, will result in a net gain in office floorspace upon completion.
+0.1 from Q4
Camilla Topham Co-Founder, Distrkt Market Insight


The West End continues to thrive as international and domestic tourism has increased and remained strong, with hospitality and leisure driven by people seeking experiences. However, hospitality continues to face significant headwinds as the impact of last October’s budget has increased operating costs, along with consumers feeling more squeezed. Many operators are waiting nervously for the November budget, which may slow decision making, albeit at present demand is strong.
As a result of market conditions, there continues to be closures in the sector and prime restaurant property in the West End has started to be released to the market. There continues to be a ‘flight to quality’, both in terms of consumers choosing to spend more cautiously and seeking excellent quality when dining out, but also for operators, with many exciting requirements from local and international occupiers for the West End. There remains to be high demand for the HOL area, limited supply and high occupancy.
A range of metrics related to the commercial inventory in the HOL area were collated and analysed. The analysis covers transactions, market rents, vacancy, availability, rental growth, new development activity and future supply to understand demand in the local retail and F&B market between April – June 2025. The report also considers the wider hospitality and leisure offer across the HOL area.
Across the West End demand is consistently high, with low vacancy and availability rates driving rental growth. This quarter generally showed limited activity across the West End, however it is anticipated that the low availability levels will tighten even further across prime areas in the second half of 2025.
Despite the quarter’s increase in inflation, consumer spend rose across the UK, by 1.8%, prompted by warm weather and the seasonal shift. Nationally, footfall to key retail areas dipped year-on-year, likely due to the high temperatures discouraging visits to busy shopping areas. Contradicting this national trend, the HOL area actually saw an increase in footfall of 11% year-on-year, showing the area’s sustained and increasing appeal. Footfall within the HOL area is explored in more depth in the Insights section of this report.
The HOL area’s commercial market remained stable in Q1 2025-26. Market rent has grown strongly in the HOL area over recent quarters, reaching a high of £106.01 per sq ft in Q4 2024-25 and remaining relatively stable into the latest quarter, falling marginally to £105.34 per sq ft. This is an increase of £7.28 per sq ft (7.4%) over the same period in the previous financial year and is higher than the current wider West End market rent of £99.93 per sq ft.
There were no commercial leases reported on CoStar throughout the quarter. There is currently 38,494 sq ft of available commercial space across six properties, which makes up 2% of the total commercial inventory in the HOL area. This marks a marginal decrease on the previous quarter, when availability stood at 2.1%, but a marked decrease on the same period in the previous financial year, when availability averaged 3.2%. The six properties with available space in the HOL area represent 1.2 years of supply on the market at current take-up rates.
Net absorption was marginally positive in Q1 2025-26 at +443 sq ft. This marks a significant rebound from the previous quarter, when net absorption was negative at –9,165 sq ft. Across the last four quarters, net absorption has fluctuated but remained positive overall at +13,620 sq ft. This indicates a steady flow
of additional tenants occupying commercial floorspace in the HOL area over the last 12 months.
There is currently one property under construction located at 47-48 Cranbourn Street, with construction ongoing since October 2023. The site is located at the intersection of Bear Street and Cranbourn Street and occupies a notable ‘wedge’ shape. The development will provide 2,000 sq ft of retail floorspace and was originally scheduled for delivery in September 2024.
+1.8 months from Q4

Located within the Sainsbury’s Wing of the National Gallery, Giorgio Locatelli has opened a new Italian restaurant with a menu inspired by the Gallery’s artworks. The restaurant opened on 10 May 2025 after Locatelli announced the closure of his Michelin-starred Locanda Locatelli at the Hyatt Regency London - The Churchill, in early 2025. This blend of high-quality dining and culture is a tried and tested formula, with Jose Pizarro at the Royal Academy of Arts and The Portrait Restaurant by Richard Corrigan at the National Portrait Gallery paving the way.
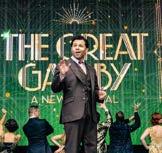
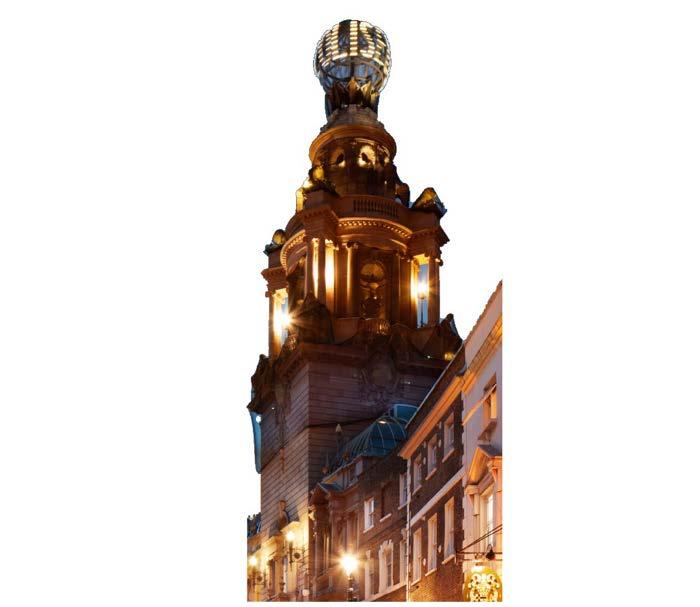
Launching for a limited run between April and September, the London Coliseum played host to this Broadway smash-hit musical adaptation of F. Scott Fitzgerald’s landmark novel across spring and summer 2025. With eight shows per week, including matinees on Thursdays, Saturdays and Sundays, the show attracted up to 2,359 theatre-goers per show to the West End’s largest auditorium in HOL area’s St Martin’s district.
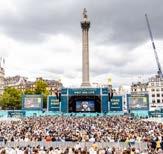
West End Live is a free to attend two-day-long celebration of West End theatre which was held on 21 and 22 June in Trafalgar Square. Organised by the Society of London Theatre (SOLT) and Westminster City Council, 2025 marked the 20th anniversary of the event. To celebrate this milestone a special 20th anniversary concert took place on the Sunday afternoon. Over the weekend, 70,000 people attended and there have been 1.46 million views on the YouTube videos from the event. For the first time the entire event was powered by 100% green energy using grid-supplied electricity and state-of-the-art Stage V backup generators.
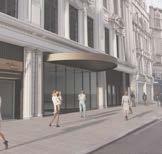
at the
Genting Casinos UK has submitted a planning application to Westminster City Council for alterations to 13 Coventry Street to facilitate change of use to a casino. The Proposed Development will see the change of use of the former Opium nightclub, the first-floor level of the former Bubba Gump restaurant (Class E) and the ground floor of the souvenir shop at 13 Coventry Street to a Casino (Sui Generis). A separate commercial unit is proposed at ground leve. In total, the proposals include the transformation of over 38,800 sq ft of space.
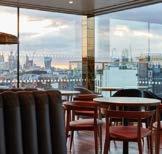
1 Leicester Square Rooftop
This new rooftop bar and restaurant, located on top of Criterion Capital’s Hotel Indigo at 1 Leicester Square, opened on 11 April 2025. It markets itself as London’s first 1920’s themed sky-high speakeasy, serving modern Mediterranean dishes and Gatsby inspired cocktails. Located nine-floors up, the bar and restaurant offers views across the London skyline, with floor to ceiling glazing and a wrap around balcony.
The hotel market overview analyses a range of factors specific to the HOL area and its hotel market, including comparisons to the wider West End. These metrics include occupancy growth, ADR, RevPAR, as well as development and construction activity. This approach aims to understand the performance of the hotel market within the locality and analyse its quarterly performance.
Hotels in the HOL area have performed adequately this quarter, although possibly below expectations. The performance of the market sits within the context of forecasted international visitor numbers for 2025 which exceed 2024 levels. This projection bodes well for the hotels within the HOL area (although it is not yet reflected in the area’s performance), as well international footfall levels (discussed within the insights section). Across England, VisitBritain recorded hotel occupancy in April and June at 77% and 83% respectively, which is consistent with occupancy in April and June 2024. In May, occupancy fell by 1% year-on-year to 79%. While occupancy remained largely consistent, there were notable declines in ADR and RevPAR across Greater London, with ADR and RevPAR down 5%. The HOL area largely mirrored these trends, with occupancy largely consistent with the same period in the previous financial year, while ADR and RevPAR fell by 5.1% and 6.2% respectively.
There are currently 31 hotels and serviced apartments in the HOL area, offering a total of 3,576 rooms. One additional hotel opened during Q1 2025-26: Z Hotel Leicester Square at 3-5 Charing Cross Road. The property, formerly known as Garrick House, was converted from its previous use as a 11,743 sq ft office to the building’s original use as a hotel, becoming operational in June 2025. All hospitality-related indicators saw quarter-to- quarter improvements in Q1 2025-26. Occupancy averaged 85.6% across the quarter, up substantially from the previous quarter’s average of 77.5%. The Average Daily Rate (ADR) for HOL area hotel rooms averaged £250.21 across the quarter, a 22.5% increase from the Q4 2024-25 ADR of £204.20. Similarly, Revenue Per Available Room (RevPAR) averaged £214.87, a 35.6% increase on the previous quarter (£158.44).
These variations in occupancy, daily rates, and per-room revenue are largely seasonal. The final quarter of each financial year is consistently the slowest in the hospitality sector. April and May typically fall in line with year-long average rates for occupancy, revenue and room costs, while June marks the beginning of peak season, with occupancy, room rates and revenue all rising sharply. While these indicators rose in line with these seasonal trends, they fell slightly when compared with the same period in Q1 2024-25. Occupancy was just over 1% lower than the same period in the previous financial year, while ADR and RevPAR fell by respective 5.1% and 6.2%.
This indicates that, while hotels can fill the same number of rooms as the same period last year, they need to offer slightly lower rates to reach the same level of occupancy.
These lower room rates and revenue for hotels may be indicative of consumers with decreased spending power in the wake of a period of acute inflation worldwide, as they seek better deals on accommodation. VisitBritain projections for the number of international visitors and their cumulative spend across 2025 may also have been over-estimated. ADR and RevPAR have, however, naturally fluctuated by anywhere from 2% to 8% in year-on-year terms over the last decade, with room rates increasing to a point where a correction downward is required, before rebounding.
Q1 2025-26
The investments section covers the purchase of real estate within the HOL area across all sectors. Investment activity in the HOL area in Q1 2025-26 was high, with over £108 million transacted across 36 individual property sales. A single portfolio purchase by the Norwegian sovereign wealth fund, NBIM, accounted for 33 of these property sales.
The value of investments in the HOL area in Q1 2025-26 greatly exceeds that of recent quarters (Q4 2024-25: £57.5m; Q3 2024-25: £64.3m) and constitutes the highest cumulative investment values in a single quarter since Q4 2023-24. This strong surge in investment bucks the wider UK trend. According to CBRE’s 2025 UK Real Estate Market Outlook Mid-Year Review, real estate investment in H1 2025 declined year-on-year, with Q1–Q2 activity dampened by economic uncertainty and its effect on UK bond yields. Investors remained cautious in their deployment of capital, but as more deals progress, investment volumes are expected to rise UK-wide in H2 2025.
There was a high volume of investment activity in the HOL area in Q1 2025-26, with 36 individual properties sold with a total value of just over £108 million.
Floorspace transacted (sq ft):
Average price per sq ft:
Total value:
232,129
£1,187.77 £108 m
33 properties sold were part of a 213-property portfolio sale by Shaftesbury Capital to Norges Bank Investment Management (NBIM), the Norwegian sovereign wealth fund, on the 1st of April 2025. NBIM acquired a 25% non-controlling stake in Shaftesbury Capital’s Covent Garden Estate for £570 million, with £51.5 million spent on properties within the HOL area. The largest individual investment was made by Victory Advisors Ltd, who purchased 103-105 Jermyn Street from Northstar Capital for £45 million on the 28th of April. The building comprises 12,812 sq ft of office floorspace and 7,687 sq ft or retail space, with refurbishments planned for completion in October 2026. A two-property portfolio comprising 73-76 Jermyn Street (4,256 sq ft corner ground floor retail unit) and 18-20 Bury Street (14,555 sq ft ground floor retail unit) was sold by the Royal Mail Pension Fund to an international family office for a total price of £11.5 million on the 7th of May.
Mark Shipman
Founder, Michael Elliot Market Insight

Interest in the HOL area remains strong, with prime buildings coming to market typically pre-letting well in advance of completion. As we approach last quarter of the calendar year leasing and transactions typically start to really take shape. Strong interest remains in the HOL area for development opportunities and trophy assets, with significant capital ready to be deployed when opportunities emerge.
The most notable investment in Q1 2025/26 was 30 Duke Street, formerly French Railways House. Leaseholders GPE engaged Make architects to design a 62,500 sq ft office-led redevelopment of the site, with works now underway on-site. The scheme has secured a pre-let with US private equity group Clayton Dubilier & Rice, founded 1978, at an annual rental rate of £190 per sq ft. The Crown Estate owns the freehold of the site.
Our Insights section reviews data and metrics to understand how people are interacting with the HOL area, ranging from footfall and visitor demographics to social media mentions. We also include key publications, announcements and consultations from stakeholders across the HOL area.
The insights are considered against a complex backdrop, with UK politics and economics, the Chancellor’s Spending Review, sustainability and world events all playing a role.
While spending levels and remained stable quarter-to-quarter, visits to the HOL area rose 11% from the previous quarter, including a 47% increase among international visitors.
There are three Underground stations in the HOL area – Green Park, Piccadilly Circus and Leicester Square (the HOL stations). These highly trafficked stations provide visitors with access to five Underground lines: Jubilee, Piccadilly, Victoria, Bakerloo, and Northern Line.
There are a further four stations across the wider West End: Marble Arch, Bond Street, Oxford Circus and Tottenham Court Road. Among these seven total stations, Tottenham Court Road had the highest number of passenger journeys at 15.44 million. Among the HOL stations, Green Park had the highest number of passenger journeys at 7.65 million. The HOL stations accounted for 33.8% of all passenger journeys across the West End in Q1 2025-26, totalling 20.49 million journeys.
Passenger journeys across the HOL stations remained relatively stable overall when compared with the previous quarter, adding approximately 200,000 passenger journeys, a 1% increase. On an individual quarter-to-quarter basis, total journeys increased by 6.8% at Green Park, while decreasing by a respective 2.8% and 1.6% at Piccadilly Circus and Leicester Square.
Compared to the same quarter last year (Q1 2025-26 vs Q1 2024-25), journeys at the HOL stations fell by a marginal 2.4%. Over this period, total journeys across all West End stations rose by 0.8%, although there were large fluctuations by station. Journeys at Marble Arch and Piccadilly
Circus fell by 5.5% and 5.1% respectively, while journeys at Bond Street and Tottenham Court Road rose by 4.9% and 3.4% respectively.
April was the busiest month for the HOL stations, with 6.9 million total passenger journeys recorded. Total journeys fell slightly in May to 6.85 million, before again falling marginally to 6.73 million June. This may be reflective of reduced traffic from people working in the HOL area during the transition to the summer months, as staff take leave in greater numbers.
Total footfall in the HOL area between April and June 2025 reached 19.2 million, an 11% increase on the previous quarter. The number of domestic visitors increased by over a million from quarter to quarter, although the domestic share of total footfall fell: domestic footfall accounted for just over 86% of footfall, down from just under 90% in Q4 2024-25. This is due to a sharp increase in international footfall, which rose from 1.8 million in Q4 2024-25 to 2.6 million in Q1 2025-26 (+47%).
Footfall was highest in the Piccadilly Circus district, reaching 7.3 million across the quarter. Jermyn Street once again recorded the lowest footfall of all districts, at 1.2 million. The month with the highest overall footfall was April, likely due to the Easter bank holidays and school holidays, with footfall lowest during the month of June.
The large increase in international visitors can, in part, be attributed to natural cyclical trends, as international travellers are more likely to visit London as the city transitions from spring into summer, rather than from winter into spring. When compared with the same period the previous year (Q1 2024-25), however, international footfall is up by nearly 990,000, a 59% increase.
The increase of international visitors to the HOL area is reflective of the UK tourism industry’s strong continued recovery in the wake of the
COVID-19 pandemic, in terms of total inbound visits and visitor spend. Provisional data published by VisitBritain for 2024 puts total inbound visits to the UK at 41.2 million, with visitors spending a total of £31.5 billion. These figures are higher than the previous highest annual totals: 41.1 million visits in 2017 and £31.1 billion spent in 2023.
VisitBritain expect further record-setting in 2025, with a projected 43.4 million visits and £33.7 billion spent across the calendar year. This would constitute 5% growth in visits and 4% growth in inflation-adjusted spent compared to 2024.
*The footfall numbers for individual districts may not equal the total footfall across the HOL area. This discrepancy arises because the same person visiting multiple districts will be counted separately in each district’s footfall count. However, when calculating the overall footfall across the HOL area, that person would only be counted once.
Quarter to quarter footfall growth
The HOL area is a unique destination with a wide-ranging appeal. The area’s diverse offer, encompassing retail, entertainment, architectural and cultural landmarks, theatre, and F&B, makes it a 24-hour destination with thriving day-time and Evening and Night-Time (ENTE) economies.
The age of visitors to the HOL area has remained consistent quarter to quarter, with working age visitors predominating. Nearly a third of all visitors are aged between 30 and 44, while just under a quarter are accounted for by the 18-29 and 45-59 age groups respectively, while people aged over 60 account for just under a fifth of all visitors to the HOL area.
Similarly, there has been a negligible quarter to quarter shift in the occupational profile of visitors to the HOL area. Just under half of all visitors to the HOL area are employed in professional, associate professional/technical, or managerial/ directorial roles. This reflects the HOL area’s position within London Central Activities Zone, where there is not only a high density of knowledge-based/office employment within the HOL area itself, but also within all surrounding areas. The remaining 50% of visitors are relatively evenly split in terms of occupation, with all occupational profiles accounting for no less than 5% and no more than 10% of total visits.
Mosaic segmentation categorises the UK population based on employment, education, lifestyle, and other shared characteristics, helping
to clarify local demographic profiles. In the HOL area, the three Mosaic segments below account for half of all visitors, indicating the particular attraction of the area for people within these demographic groupings. There are a further five Mosaic segments accounting for just under 40% of visitors, with the remaining 10% accounted for by predominantly rural or elderly Mosaic segments.
Includes suburban households, ranging from families to retirees, employed in both well-paid city roles and lower-wage jobs. They rely heavily on public transport and often have long commutes.
City Prosperity
Features high-status urban residents with demanding, high-profile roles earning £100k+ frequently commuting to central London by private transport.
Rental hubs
Comprises young university graduates who started promising careers, earning (£30k–£39,999), and living in privately rented accommodations near the city.
Across April, May and June 2025, consumer spending in the HOL area fell by 4.9% compared to the previous quarter. The volume of transactions remained relatively stable, with a marginal 0.9% decrease compared to the previous quarter. Total visits to the HOL area, however, saw a significant 10.7% increase from Q4 2024-25.
There was substantial variation in spend, transactions and visits from month to month across Q1 2025-26. April had the highest level of spend, transactions, and visits, with all three indicators above the 12-month average index. May, by contrast, had the lowest level of spend and transactions across the quarter, while visits were in line with the 12-month average. Spending levels rebounded strongly in June, with a 12-month average level of transactions and a slight decline in overall visits.
International spend and visits followed a similar, though more pronounced, pattern of variation across the quarter. Spend and visits were highest in April, both significantly above the 12-month average. While international visits were above average in May, spend levels were down significantly – 35% lower than the 12-month average. International visits fell in June, although spending rebounded strongly.
Natural seasonal trends likely had a significant influence on the pattern of visits, transactions and spending across the quarter. Easter and its
associated bank and school holidays likely drove the increase in visits, spend and transactions throughout the month, with a substantial number of international visitors likely staying for longer periods with generally higher levels of spending. The significant drop in spend and transactions in May may be indicative of lower budget visitors spending time in London, just outside the summer high season, including international school groups travelling in large numbers – while spending relatively little – as the academic year draws to a close. June, by contrast, marks the beginning of London’s busy summer tourist season, as tourists stay for longer periods and consequently, spend more time and money in the HOL area.
The level of online engagement places receive is indicative of their status and presence in society and culture. The way these places are spoken about, and the topics that people relate to them, reveal how they are perceived and their cultural resonance around the world. In this section, the online engagement with two of the HOL area’s most famous landmarks - Leicester Square and Piccadilly Circus - are tracked.
Social media data published by Meltwater collates posts and comments across a broad range of social media platforms, including X, Instagram, and Facebook, as well various news platforms. These data reflect the level of online engagement and interest in places, events, topics, people and more. Engagement in the HOL area is consistently high, with Piccadilly Circus and Leicester Square receiving thousands of mentions from around the world each quarter.



190
407
Mentions over the quarter

17,316
37,029


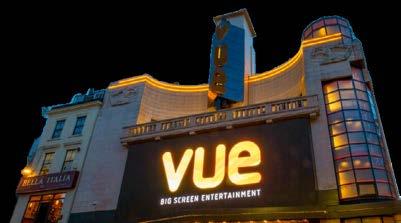
Leicester Square had the higher level of online engagement of the two HOL area destinations analysed, with an average of 407 mentions per day, or 37,029 mentions across the entire quarter. ‘Arts and entertainment’ was by far the most common topic related to Leicester Square’s online engagement, with over twice the number of mentions compared to the topic with the next highest level of engagement (‘news’). This engagement was driven by the film premieres that took place in Leicester Square throughout the quarter (the top two sub-topics within ‘arts and entertainment’ were ‘movies’ and ‘celebrities and entertainment news’), including ‘Sinners’, ‘Mission Impossible: The Final Reckoning’, and ‘28 Years Later’ featuring Hollywood stars including Michael B Jordan, Tom Cruise and Aaron Taylor-Johnson.
Piccadilly Circus’ online engagement in Q1 202526 was lower than that of Leicester Square, with an average of 190 mentions a day, or 17,316 total mentions across the quarter. ‘Arts and entertainment’ was the most common topic related to social media mentions of Piccadilly Circus, although mentions were more evenly distributed across topics, with ‘travel’, ‘news’, and ‘law and government’ also garnering thousands of mentions. The ten countries with the highest level of social media engagement with Piccadilly Circus – and Leicester Square – span five continents, illustrating the global reputation and appeal of these HOL area landmarks.
22,547 mentions
Piccadilly Circus
5,817 mentions
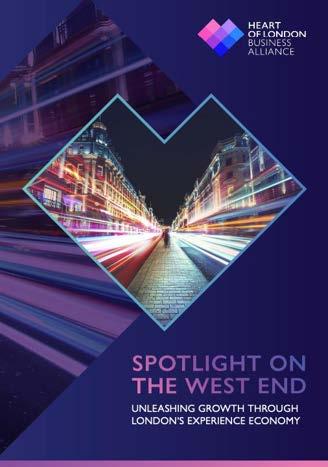
“Unleashing Growth Through London’s Experience Economy” is HOLBA’s response to the publication of the Mayor’s Growth Plan for London. The report examines the West End’s critical role in driving London’s cultural and economic vitality. As a central hub for over 58,000 businesses and a generator of £55.5 billion in annual Gross Value Added (GVA), including £9 billion from the Evening and Night-Time Economy (ENTE), the West End represents a vital part of London’s success.
The report advocates for a new, coordinated, place-based strategy for the West End to sustain and drive growth in the face of rising global competition. Key partners such as the Greater London Authority, Westminster City Council, Transport for London, the Metropolitan Police, and neighbouring Business Improvement Districts are essential to aligning and coordinating infrastructure, safety, and policy frameworks.
The report includes HOLBA’s proposal for a new designation and policy approach for the West End focused on unlocking growth by enhancing governance, tailoring policy, and scaling investment. It also includes insights from key business leaders highlighting specific challenges that include outdated planning laws, inequitable business rates, lack of VAT-free shopping for international visitors, and restrictive licensing policies. These hurdles are inhibiting innovation, discouraging investment, and threatening the West End’s global appeal.
The report concludes that to thrive and remain a world-class destination, the West End needs:
• Polic y differentiation that supports 24-hour economic activity.
• Responsive resourcing that matches its high visitor footfall
• Enhanced public realm, safety, and infrastructure.
• Stronger place management and alignment with national Experience Economy strategies.
Read the report here.
We have rounded up the key announcements, publications and consultations that impact the HOL area into one digest.
Chancellor’s Spending Review
On 11 June 2025, the Chancellor outlined a Comprehensive Spending Review. It sets long-term budgets for all central government departments, establishing funding priorities through to the end of this Parliament. This briefing provided a strategic overview of confirmed allocations, continuing uncertainties, and the implications for key sectors - particularly in Central London.
Key takeaways include:
• Day-to-day departmental spending (e.g. health, policing, education, transport operations): Will grow by 1.2% above inflation annually over the next three years.
• Capit al/infrastructure spending (e.g. transport, equipment, buildings): Will grow by 1.3% above inflation annually over the next four years.
Key issues for Central London:
Infrastructure
The government has confirmed the largest multiyear settlement for London in over a decade, with £2 billion of funding for Transport for London’s capital renewals programme between 2026/27 and 2029–30.
Public Safety and Policing
Police spending power will increase by 2.3% per year in real terms, supported by over £2 billion in additional funding. This includes funding to recruit 13,000 additional officers for neighbourhood policing roles.
£1.2 billion per year, by the end of the Spending Review period, will be allocated to support training and upskilling. This investment will back apprenticeships, adult education, and retrainingthough London-specific allocations have not yet been confirmed.
Along with priorities relating to the NHS, housing and schools, a number of national priorities are key to the HOL area:
R&D funding will rise to £22 billion per year, a record high. £2 billion will allocated to implement the UK’s AI Action Plan. British Business Bank funding is to be increased by two-thirds to support SMEs and scale-ups.
A 10-year Industrial Strategy (published 23 June) sets out long-term priorities for growth, productivity, and innovation. One of the core sectors of this strategy is the creative industries. The release noted that under the industrial strategy there will be a significant increase in funding to support regional growth and drive innovation, develop creative places, and ensure the UK’s creative industries remain world-leading.
Read HOLBA’s full review here
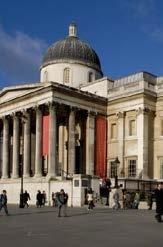
The National Gallery’s Citizens Assembly

The National Gallery has launched a pioneering project to place its audience at the heart of its decision making. The project will begin with a Citizens’ Assembly (NG Citizens) of 50 participants who will be selected by a civic lottery to shape its programmes and priorities. Invitations will be sent out to 15,000 households across the UK, with the final group reflecting the wide diversity of the UK - including individuals who have never engaged with the Gallery before. This project follows the success of the NG200 Bicentenary and marks the start of the National Gallery’s third century. NG Citizens cements the Gallery as a pioneer in audience inclusion and setting a new standard for how national cultural institutions engage with the people they serve.
Read the press release here
On 19 June 2025, the Mayor of London announced available funding to help boost London’s hospitality industry this Summer. HOLBA successfully supported Westminster City Council (WCC) with a submission to have St Martin’s Lane selected as one of the four pilot schemes. Kicking off on the 22nd August, 18 businesses along the street received an al fresco license.
The pilot builds on the popular al fresco programme hosted in the street during the pandemic. From late August to October pubs, bars and restaurants on St Martin’s Lane will be able to provide open air dining and drinking. The street will be car-free from 11am-11pm (except for taxis and accessible drop offs) and al fresco licences will be available for up to 34 businesses. The scheme has been designed as a test phase to inform a permanent public realm improvement project - something HOLBA, the Council, and local businesses are already collaborating to deliver.
Read the announcement here
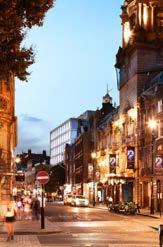
The Mayor of London has launched plans to transform Oxford Street into a world-class, pedestrianised destination for shopping, leisure, and cultural events. In response to challenges from the pandemic, online retail, and declining footfall, the proposals aim to revitalise the UK’s most iconic high street by creating a clean, green and accessible public realm that rivals global destinations like Times Square and the ChampsÉlysées. The project seeks to attract investment, support jobs, and re-establish Oxford Street as a symbol of London’s economic and cultural vitality.
The public were invited to comment on the proposals during Spring 2025. The results of the public consultation were revealed on 17 June, with the Mayor announcing that he will move forward with the plans. Around 70% of respondents backed the proposals, with two-thirds specifically supporting the idea of pedestrianisation. Next steps are expected to include the establishment of a Mayoral Development Corporation by January 2026 and the selection of two design teams who are expected to be commissioned by September 2025.
Read the full announcement here.

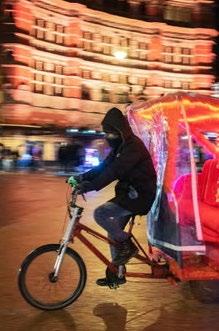
In June, TfL published a report on its consultation to regulate pedicabs in London. The report shows overwhelming support for regulation of the industry, with 75% of respondents stating that they did not feel safe when using a pedicab in London. Pedicabs in the capital are currently unregulated and new regulations are due to come into force in 2026. Feedback from Londoners and stakeholders, including HOLBA, is being used to develop detailed policy proposals which will be subject to further consultation involving the pedicab industry.
HOLB A has campaigned for over a decade for the regulation of pedicabs. TfL consulted on powers to regulate and licence pedicabs in February 2025. In our response, HOLBA highlighted areas we believe should be considered, including designated stopping areas/parking, usage of bus and cycle lanes, charging structures, enforcement procedures, licence plates, insurance, music volumes and use of safety belts. Westminster City Council also launched a consultation in June 2025 on interim measures to address the most problematic behaviours that have been raised. The final TfL consultation on new regulations and a licensing scheme is expected at the end of Summer 2025. Read the full announcement here.
Future of Regent Street, Haymarket and Piccadilly Circus

In July, The Crown Estate and Westminster City Council launched the public engagement campaign for the reimagining of the public realm of Regent Street, Haymarket and Piccadilly Circus. The consultation period ran until 10 August 2025. The public and stakeholders were invited to complete a survey, alongside a suite of engagement events. Events were hosted in person and online, with workshops, guided walkabouts with a focus on women and girls, and inclusive design, as well as a series of pop-ups.
The project marks a key step in delivering a coordinated, future-facing vision for the West End, aligning with wider plans to improve central London’s public realm, including the Mayor’s proposals for Oxford Street. The Council and The Crown Estate are working with key partners to ensure the project benefits residents, businesses and visitors alike. HOLBA has been actively engaging with the project and is part of the Stakeholder Sounding Board.
Visit the project consultation website here.

In July 2025, the Crown Estate published its annual report. Amongst the Crown Estate’s nationwide portfolio, the report highlights the West End’s success as a core focus, with a £490 million development pipeline underway. Key themes include the modernisation and refurbishment of existing assets, the decarbonisation of the business and ensuring the West End remains a global destination.
The Crown Estate have taken the decision to re-design a key London redevelopment, the second phase of a masterplan for St James’s Market, connecting Regent Street and Haymarket. Following the buyout of their joint venture partner and a peer review by industry experts it was concluded that the initial design did not meet the estate’s latest sustainability goals. The newbuild scheme will reduce the project’s carbon footprint and eliminate one of two basement levels.
Alongside progressing plans for the reimagining of Regent Street, Haymarket and Piccadilly Circus, the report highlights the estate’s continuing efforts to attract new groups of people into the West End to continue to grow the value of their assets. Initiatives included inviting the public to watch Wimbledon in St James Market, an open air exhibition in the New Vision Art Gallery’s pavilion space and the Choose Love pop-up store in Regents Street.
The Crown Estate is continuing to invest in important refurbishments to heritage properties with a focus on improving offering to customers and making them more sustainable. A new project at 33-35 Piccadilly is now under construction as part of the first phase of the estate’s London development pipeline. Nearby New Zealand House is also undergoing refurbishment.
Read the report here
ONE TWO THREEFOURFIVE
Undertook a desktop review of HOLBA and AND London’s previous Real Estate Insights Reports. This enabled us to understand in detail the work undertaken to date and understand the current markets and trends.
Collected comprehensive data on real estate, area and sector performance KPIs through CoStar, ONS and AND London’s extensive commercial database, alongside gathering on-the-ground information from conversations with local agents.
Liaised with HOLBA’s other data providers to collate, format, and manage data on area performance as well as relevant updates and intelligence from HOLBA’s advocacy and business engagement teams.
Carried out analysis to provide detailed insight into the HOL area with a particular focus on inward investment and identification of longterm trends.
Monitored and reported on HOLBA’s property owners’ strategies; publications and announcements; relevant key industry reports and thought leadership; and topical deep dive and trend analysis.



Ros Morgan
Chief Executive ros@holba.london

Mark Williams
Deputy Chief Executive mark@holba.london
Dean Wade
Head of Engagement and Partnerships dean@holba.london

Matt Harris
Senior Data and Insights Manager matth@holba.london
AND London is not responsible for nor shall be liable for the consequences of any use made of this Report other than that for which it was prepared by AND London for the Client, unless AND London provides prior written authorisation for such other use and confirms in writing that the Report is suitable for it. It is acknowledged by the parties that this Report has been produced solely in accordance with the Client’s brief and instructions and without any knowledge of or reference to any other parties’ potential interests in or proposals.
HOLBA This report gives information based primarily on AND London data, which may be helpful in anticipating trends in the property sector. However, no warranty is given as to the accuracy of, and no liability for negligence is accepted in relation to the forecasts, figures or conclusions contained in this report and they must not be relied on for investment or any other purposes. This report does not constitute and must not be treated as investment or valuation advice or an offer to buy or sell property. We also accept no responsibility or liability for the personal opinions published in views, blog posts, opinion pieces or articles that comprise opinion pieces.