Regional Labor Review
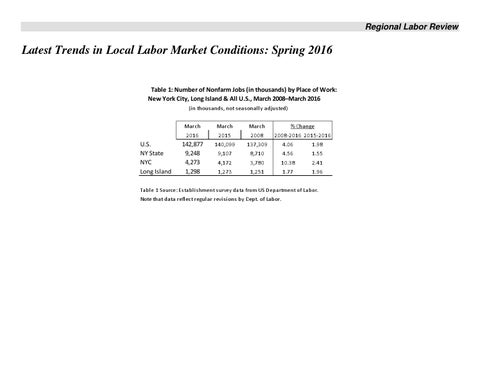
Latest Trends in Local Labor Market Conditions: Spring 2016 Table 1: Number of Nonfarm Jobs (in thousands) by Place of Work: New York City, Long Island & All U.S., March 2008–March 2016 (in thousands, not seasonally adjusted)
U.S. NY State NYC Long Island
March
March
March
% Change
2016
2015
2008
2008‐2016 2015‐2016
142,877 9,248 4,273 1,298
140,099
137,309
9,107 4,172 1,273
4.06
1.98
8,710
4.56
1.55
3,780
10.38
2.41
1,251
1.77
1.96
Ta bl e 1 Source: Es ta bl i s hment s urvey da ta from US Depa rtment of La bor.
Note that data reflect regular revisions by Dept. of Labor.
Table 2: Civilian Labor Force, Employment & Unemployment (i n thous a nds , not s ea s ona l l y a djus ted)
Labor Force
Employed
Unemployed
Unemp. Rate
March
March
March
March
March
March
March
March
2016
2015
2016
2015
2016
2015
2016
2015
AREA U.S.
158,854
156,317
150,738
147,635
8,116
8,682
5.1%
5.6%
NYC Bronx Brooklyn Manhattan Queens Staten Island
4,254.5 624.9 1,258.8 945.4 1,197.5 227.7
4,198.4 617.2 1,243.4 930.8 1,181.8 225.3
4,010.7 575.5 1,185.1 898.1 1,137.2 214.7
3,943.5 565.9 1,165.2 883.0 1,118.1 211.4
243.8 49.4 73.7 47.3 60.3 13.0
254.9 51.3 78.2 47.8 63.7 13.9
5.7 7.9 5.9 5.0 5.0 5.7
6.1 8.3 6.3 5.1 5.4 6.2
LONG ISLAND Nassau Co. Suffolk Co.
1,484.7 701.3 783.5
1,452.0 685.3 766.7
1,422.5 674.1 748.4
1,381.0 654.6 726.4
62.2 27.2 35.1
71.0 30.7 40.3
4.2 3.9 4.5
4.9 4.5 5.3
Table 2 Source: CPS household survey data from NYS Dept. of Labor. Data reflect regular revisions by Dept. of Labor
Figure 1 NYC Job Growth by Industry: March 2015 – March 2016 (in 1,000s of jobs, and percent change)
120 TOTAL 2.4% 100 Services 3.4% 80 GOVT
Constcn.
0.7%
6.9%
60 Jobs 40 20 0 -20
Wh. Trade 1.2%
TWU 3.0%
Manf. 3.6%
Retail -1.3%
FIRE
Information
1.1%
2.7%
Figure 2 Long Island Job Growth by Industry: March 2015 – March 2016 (in 1,000s of jobs, and percent change)
30 Services 3.5%
25 20 15 Jobs 10 5 0 -5 -10
GOVT 1.8%
Constcn. 3.1%
Wh. Trade 0.9%
TWU 0.7%
Manf. 1.7%
Retail -2.5%
FIRE 2.2%
Info -2.4%
TOTAL 2.0%
Table 3: Weekly Wage Growth by County, 2010‐15 Avg. Wage/week AREA
2014
2010
% Chg. Real Wage 2014‐15
2010‐15
$1,048 $1,026 $889
2.18
8.93
Bronx Brooklyn Manhattan Queens Staten Island
$903 $869 $793 815 760 718 2,840 2,746 2,409 934 910 811 824 801 724
4.27 7.61 3.78 2.99 3.23
5.66 5.33 9.39 6.86 5.61
LONG ISLAND Nassau Co. Suffolk Co.
$1,102 $1,091 $984 1,047 1,027 934
1.36 2.30
3.92 4.02
U.S.
2015
Ta bl e 3 Sources : 2010:Q1‐2015:Q1 wa ges i n a l l es ta bl i s hments , from QCEW es ta bl i s hment s urvey. Wa ges a djus ted for i nfl a ti on by na ti ona l & Northea s t Regi ona l CPI: www.bl s .gov