DATA FILE
Latest Trends in Key Labor Market Indicators: Fall 2020
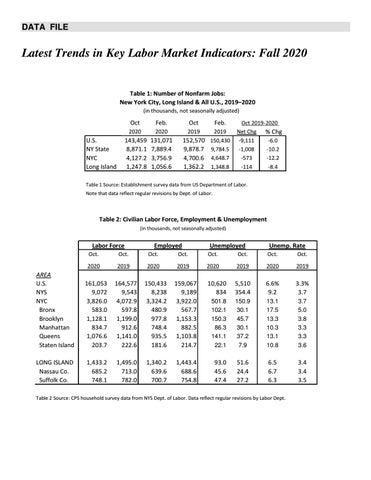
Table 1: Number of Nonfarm Jobs: New York City, Long Island & All U.S., 2019–2020 (in thousands, not seasonally adjusted)
Oct
U.S. NY State NYC Long Island
Feb.
Oct
Feb. 2019 150,430 9,784.5 4,648.7 1,348.8
2020
2020
2019
143,459 8,871.1 4,127.2 1,247.8
131,071 7,889.4 3,756.9 1,056.6
152,570 9,878.7 4,700.6 1,362.2
Oct 2019-2020 Net Chg % Chg -9,111 -6.0 -1,008 -10.2 -573 -12.2 -114 -8.4
Table 1 Source: Establishment survey data from US Department of Labor. Note that data reflect regular revisions by Dept. of Labor.
Table 2: Civilian Labor Force, Employment & Unemployment (in thousands, not seasonally adjusted)
Labor Force
Employed
Unemployed
Unemp. Rate
Oct.
Oct.
Oct.
Oct.
Oct.
Oct.
Oct.
Oct.
2020
2019
2020
2019
2020
2019
2020
2019
AREA U.S. NYS NYC Bronx Brooklyn Manhattan Queens Staten Island
161,053 9,072 3,826.0 583.0 1,128.1 834.7 1,076.6 203.7
164,577 9,543 4,072.9 597.8 1,199.0 912.6 1,141.0 222.6
150,433 8,238 3,324.2 480.9 977.8 748.4 935.5 181.6
159,067 9,189 3,922.0 567.7 1,153.3 882.5 1,103.8 214.7
10,620 834
5,510 354.4
6.6% 9.2
3.3% 3.7
501.8 102.1 150.3 86.3 141.1 22.1
150.9 30.1 45.7 30.1 37.2 7.9
13.1 17.5 13.3 10.3 13.1 10.8
3.7 5.0 3.8 3.3 3.3 3.6
LONG ISLAND Nassau Co. Suffolk Co.
1,433.2 685.2 748.1
1,495.0 713.0 782.0
1,340.2 639.6 700.7
1,443.4 688.6 754.8
93.0 45.6 47.4
51.6 24.4 27.2
6.5 6.7 6.3
3.4 3.4 3.5
Table 2 Source: CPS household survey data from NYS Dept. of Labor. Data reflect regular revisions by Labor Dept.