LOCAL LABOR CONDITIONS – NYC & LONG ISLAND
Fall 2016
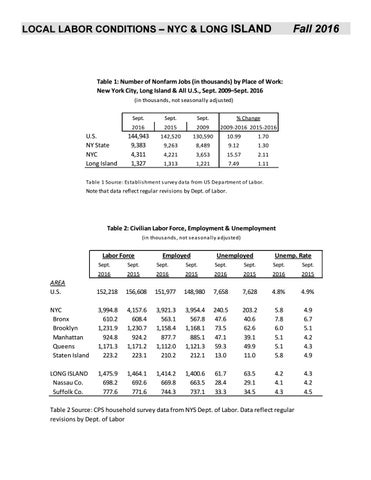
Table 1: Number of Nonfarm Jobs (in thousands) by Place of Work: New York City, Long Island & All U.S., Sept. 2009–Sept. 2016 (in thousands, not seasonally adjusted)
U.S. NY State NYC Long Island
Sept.
Sept.
Sept.
% Change
2016
2015
2009
2009-2016 2015-2016
144,943 9,383 4,311 1,327
142,520
130,590
10.99
1.70
9,263
8,489
9.12
1.30
4,221
3,653
15.57
2.11
1,313
1,221
7.49
1.11
Ta bl e 1 Source: Es tabl i s hment s urvey da ta from US Depa rtment of La bor.
Note that data reflect regular revisions by Dept. of Labor.
Table 2: Civilian Labor Force, Employment & Unemployment (i n thous a nds , not s ea s ona l l y a djus ted)
Labor Force
Employed
Unemployed
Unemp. Rate
Sept.
Sept.
Sept.
Sept.
Sept.
Sept.
Sept.
Sept.
2016
2015
2016
2015
2016
2015
2016
2015
AREA U.S.
152,218
156,608
151,977
148,980
7,658
7,628
4.8%
4.9%
NYC Bronx Brooklyn Manhattan Queens Staten Island
3,994.8 610.2 1,231.9 924.8 1,171.3 223.2
4,157.6 608.4 1,230.7 924.2 1,171.2 223.1
3,921.3 563.1 1,158.4 877.7 1,112.0 210.2
3,954.4 567.8 1,168.1 885.1 1,121.3 212.1
240.5 47.6 73.5 47.1 59.3 13.0
203.2 40.6 62.6 39.1 49.9 11.0
5.8 7.8 6.0 5.1 5.1 5.8
4.9 6.7 5.1 4.2 4.3 4.9
LONG ISLAND Nassau Co. Suffolk Co.
1,475.9 698.2 777.6
1,464.1 692.6 771.6
1,414.2 669.8 744.3
1,400.6 663.5 737.1
61.7 28.4 33.3
63.5 29.1 34.5
4.2 4.1 4.3
4.3 4.2 4.5
Table 2 Source: CPS household survey data from NYS Dept. of Labor. Data reflect regular revisions by Dept. of Labor