
3 minute read
Establishing the Flory-Fox Equation for Polymethyl Methacrylate (PMMA) using Differential Scanning Calorimetry (DSC) and Determining Relative Tacticity using Quantitative Proton Nuclear Magnetic Resonance Spectroscopy (qHMNR)

Dr. Ronald P. D’Amelia and Evan H. Kreth Chemistry Department, Hofstra University, Hempstead, NY 11549-0151
Advertisement
Introduction
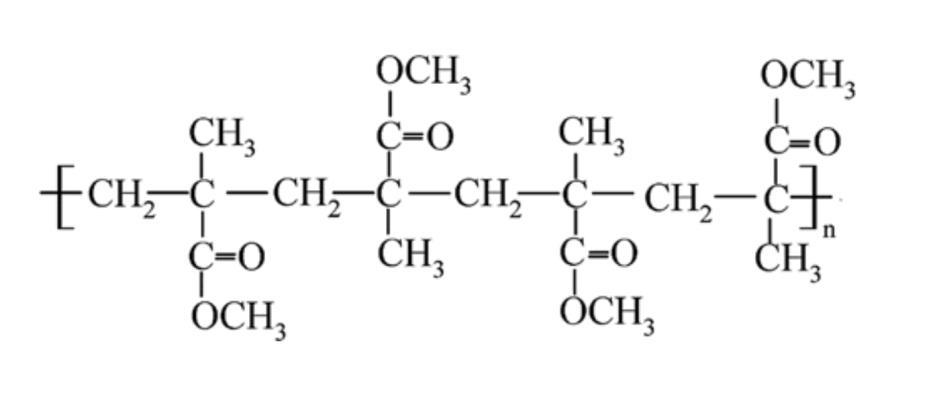
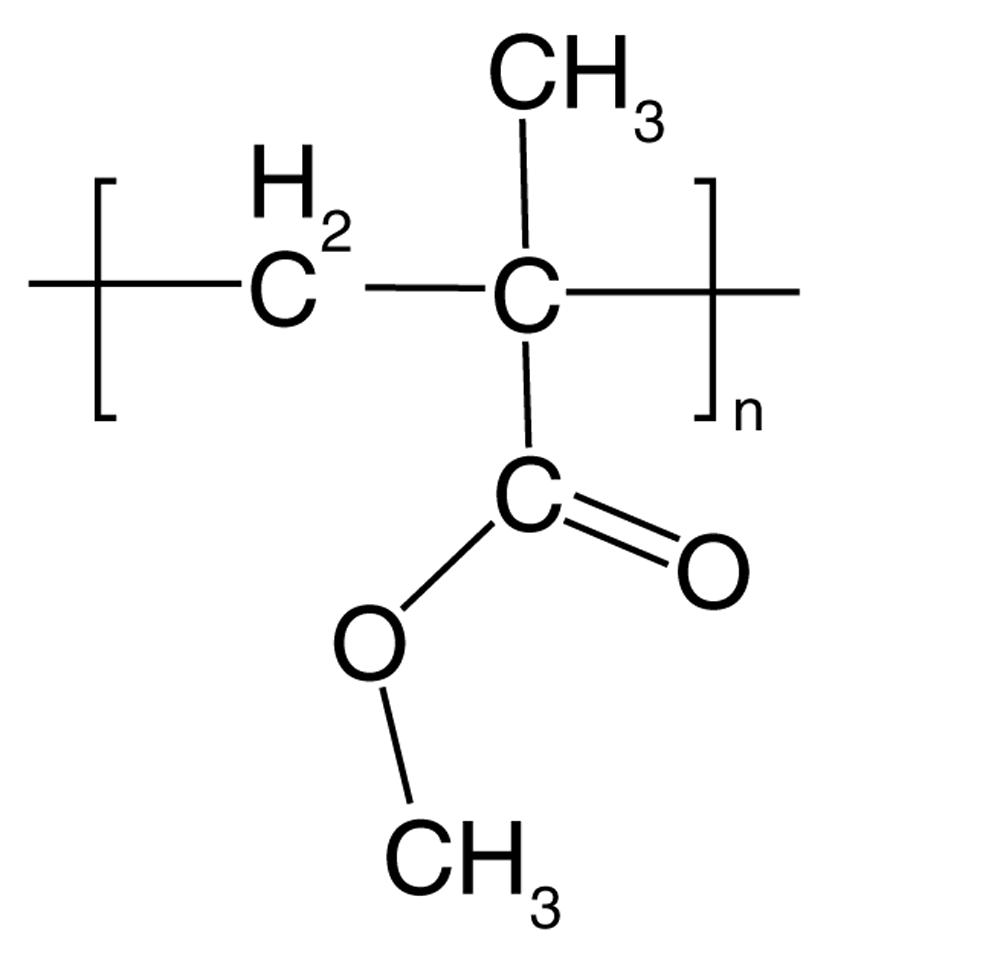
Polymethyl methacrylate (PMMA), best recognized by its trade names of Perspex, Lucite, and Plexiglass, is a transparent and rigid thermoplastic. It commonly serves as a substitute for glass due to its lightweight, shatterproof, and scratch-resistant properties.
Results
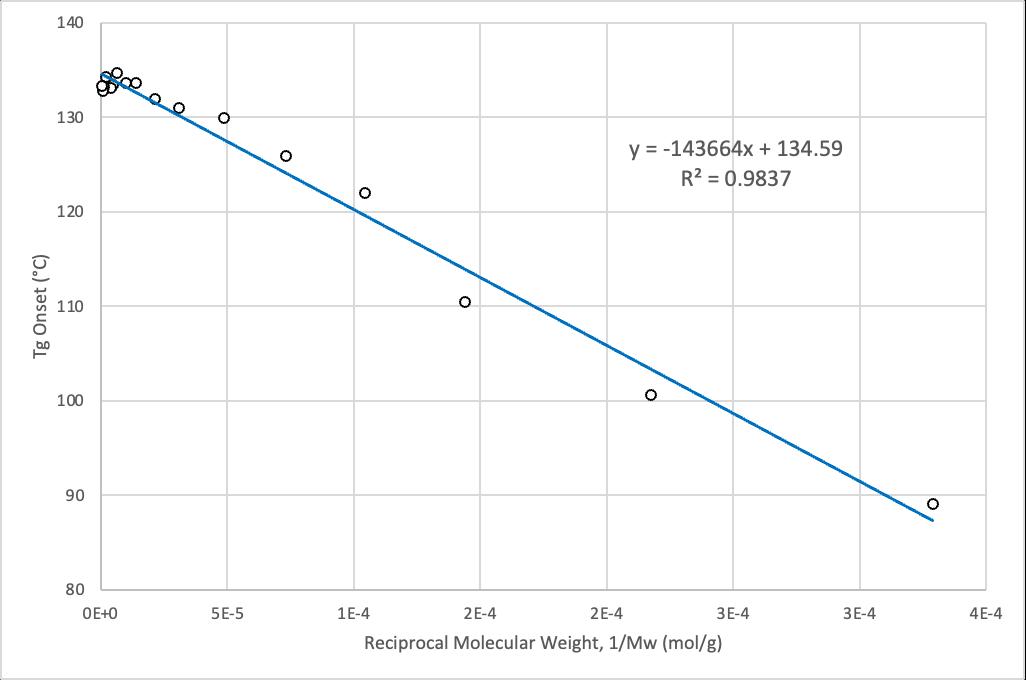
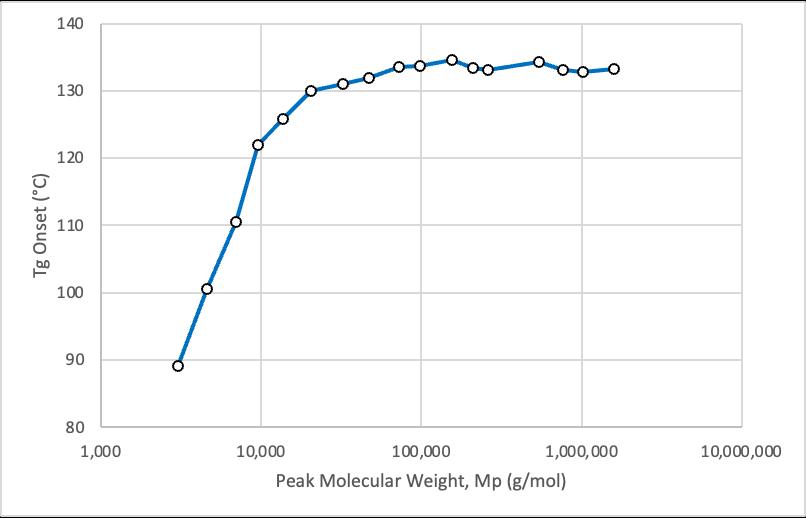
Glass transition temperature (Tg), termed the “melting point of amorphous materials” is the temperature at which an amorphous polymer changes from a hard, glassy state to a soft, rubbery one. As the number-average molecular weight (Mn) of the amorphous polymer increases, its Tg also increases but ultimately levels off at a maximum value labeled Tg∞. The Flory-Fox equation relates these parameters for amorphous polymers and is given below.
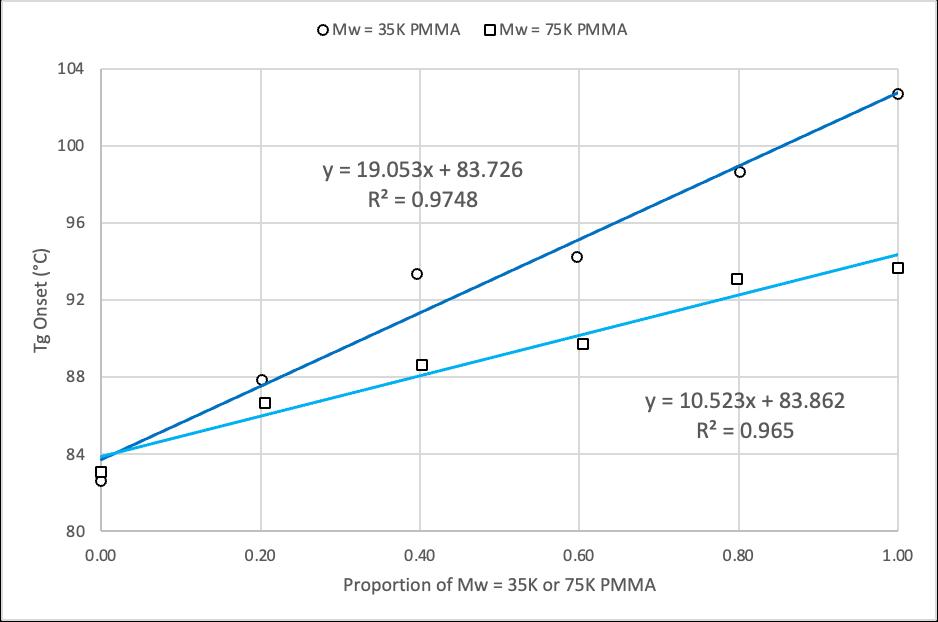
The Tg of a binary mixture of amorphous polymers changes with the weight percent of the components of the binary mixture. This relationship is described by the Fox equation shown below, where w indicates the weight percent of each amorphous polymer.
Proton nuclear magnetic resonance spectroscopy (HNMR) serves as a fundamental tool in determining the structure, and therefore identity, of organic compounds. When applied quantitatively (qHNMR), it can also be used to determine relative concentrations of compounds in solution, and the stereochemistry associated with polymers, or tacticity.
Research Goals
1. To establish the Flory-Fox Equation, and associated values of Tg∞ and K, for the examined polymer, polymethyl methacrylate (PMMA).
2. To verify the Fox equation with various binary mixtures of PMMA of different numberaverage molecular weights.
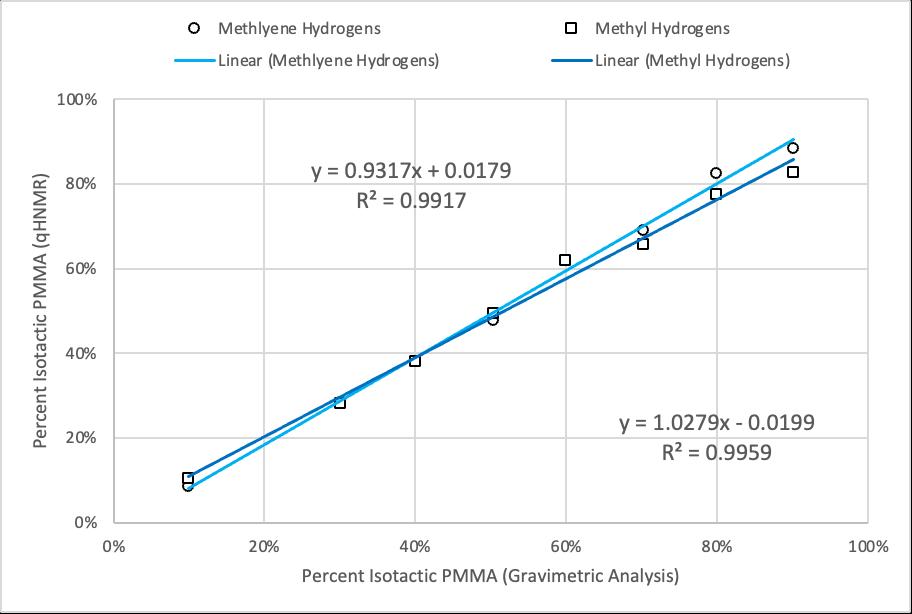
3. To evaluate the effectiveness of quantitative proton Nuclear Magnetic Resonance spectroscopy (qHNMR) as a method for determining relative tacticity in PMMA.
Experimental
Polymethyl Methacrylate(PMMA)

Seventeen, predominantly syndiotactic PMMA samples of various molecular weights were used to establish the Flory-Fox equation and its linear plot (Figures 4 and 5). These samples were sourced fromAgilent Technologies and all boasted low polydispersity indices (Table 1). The PMMA samples utilized in the binary mixtures (Table 2 and Figure 7) were sourced from Scientific Polymer Products and did not contain any high degree of tacticity.
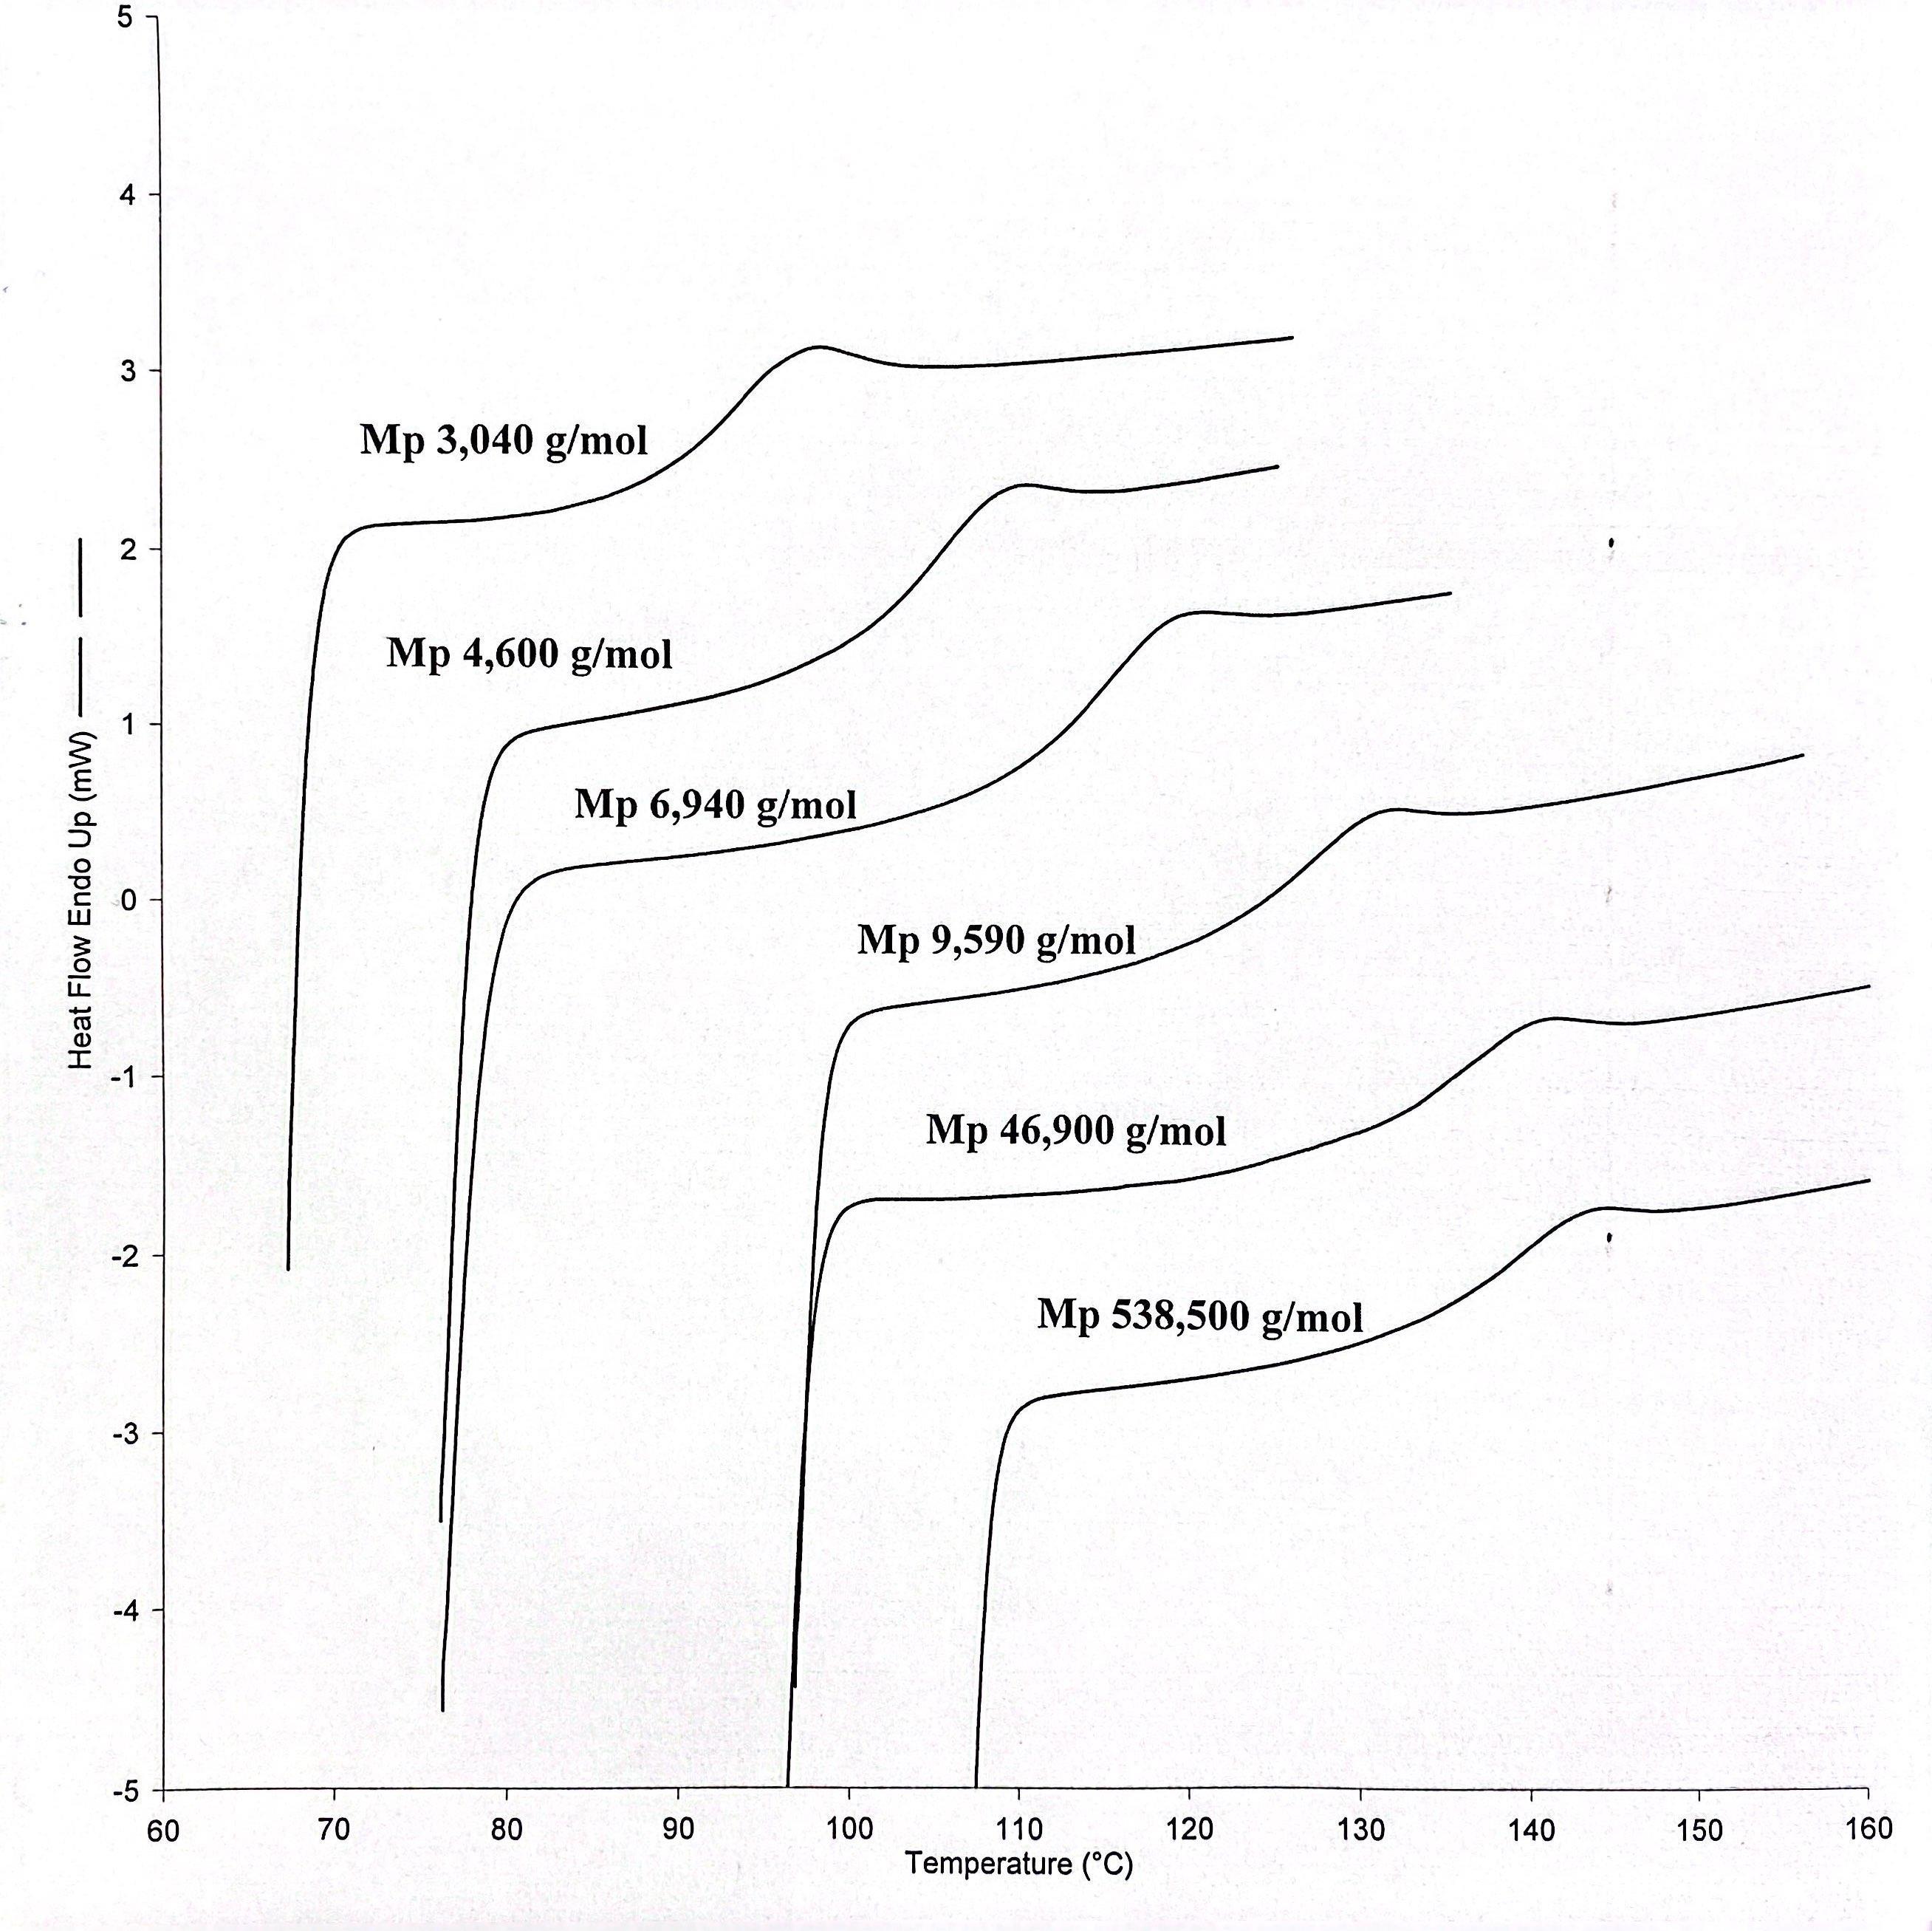
Differential ScanningCalorimetry(DSC)
Each PMMA sample was packed into a standard aluminum pan and the lid was left laying on top of the sample, unpressed. These samples were analyzed using a Perkin Elmer Pyris 1 DSC with nitrogen serving as the purge gas flowing at 20 mL/min. Each thermogram was obtained at a rate of 10°C per minute and each glass transition temperature was calculated using the “Tg” option found in the Pyris DSC software package. Selected thermograms for various PMMA samples are shown in Figure 6. An indium metal standard was used to calibrate the temperature and enthalpy measurements of the DSC.
Hot Melt Blend Technique
In order to achieve uniform binary mixtures or blends, used in Table 2 and Figure 7, a hot melt blend technique was adopted. This technique involved utilizing a hot plate to heat both PMMA samples until they were fluid, and mechanically mixing them until a homogeneous blend was obtained. The PMMA blend was then cooled rapidly and placed into a standard aluminum pan for thermal analysis, where a single Tg was observed, confirming the validity of the technique.
Nuclear MagneticResonance Spectroscopy (NMR)
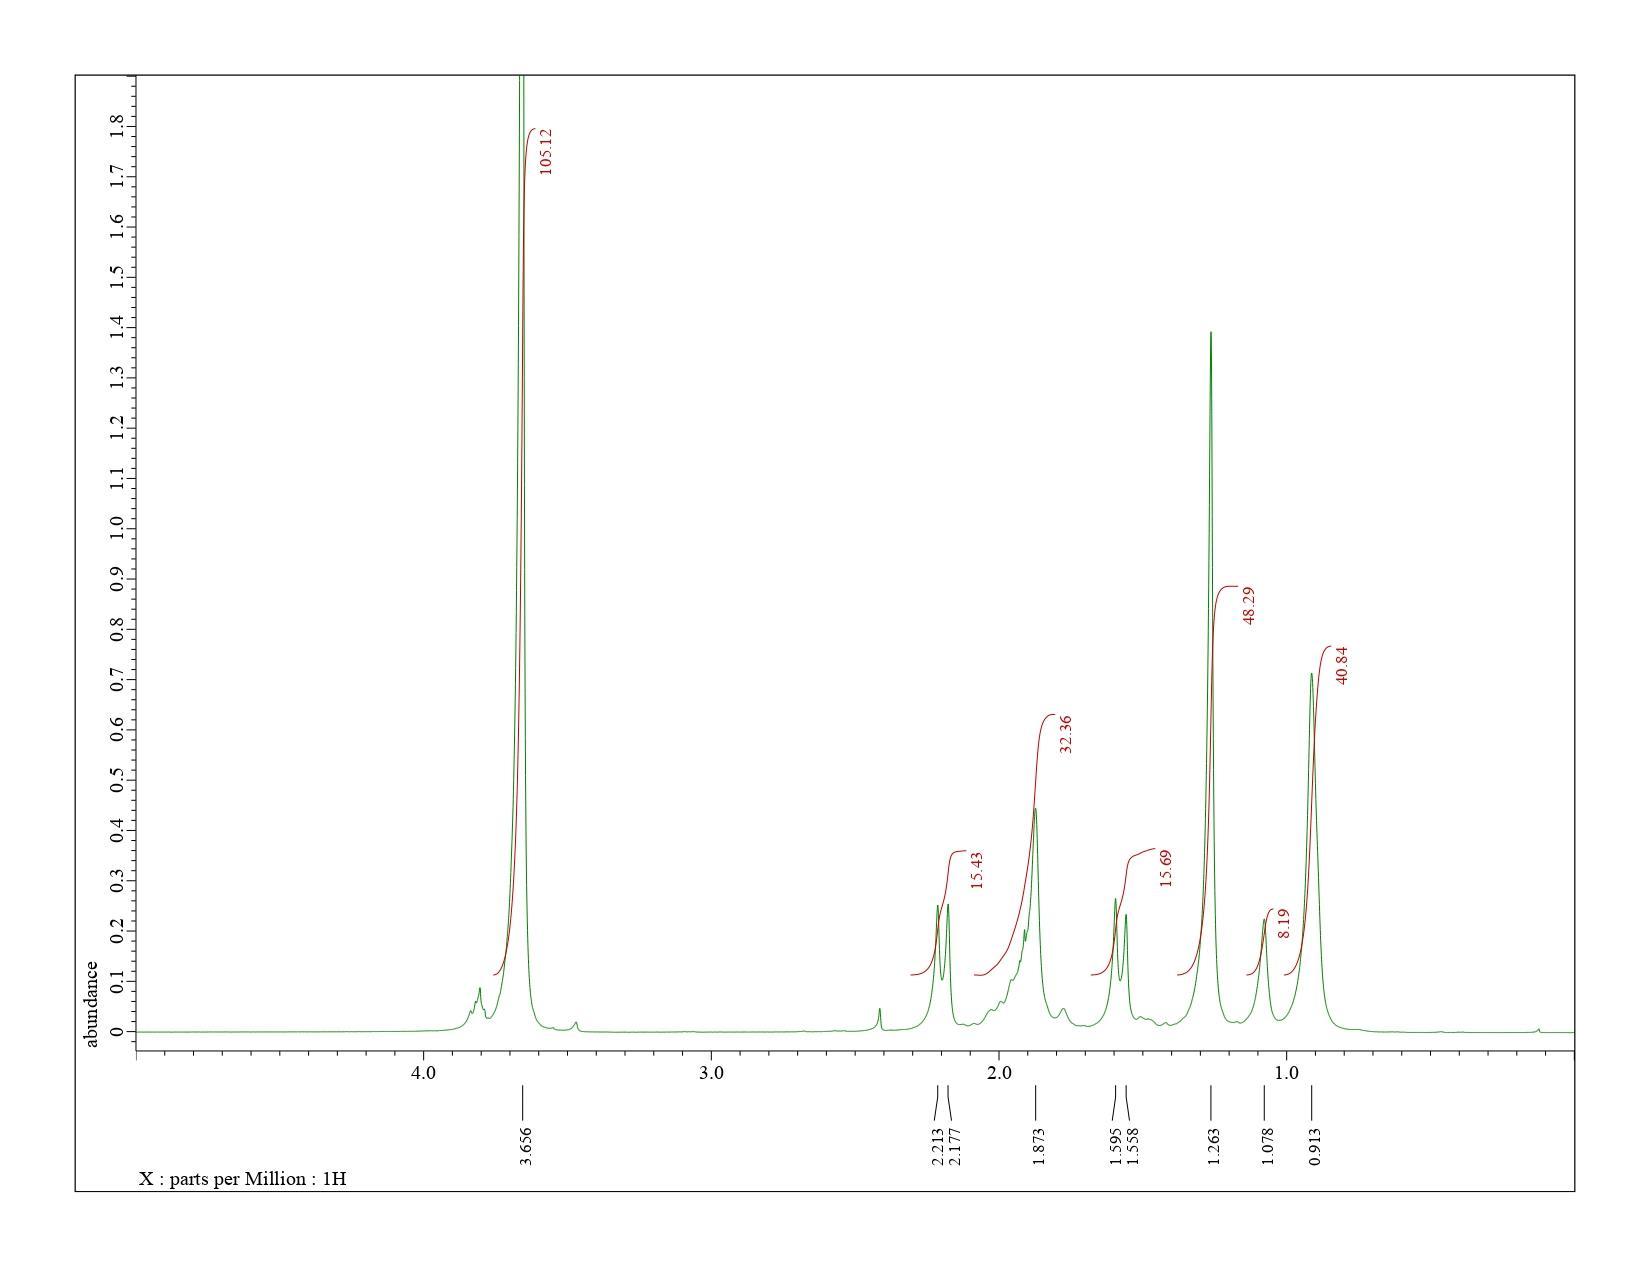
The proton NMR spectra were obtained using a 400 MHz JEOL model ECS-400 NMR spectrometer. The PMMA samples were dissolved in deuterated chloroform (CDCl3) at concentrations ranging from 25-30 mg/mL. The JEOLDelta NMR software version 6.0.0 (Windows) was used to analyze the individual spectra. Atypical NMR spectrum for a 50:50 binary mixture of isotactic to syndiotactic PMMA is shown in Figure 9. The corresponding chemical shifts for the hydrogens in isotactic and syndiotactic PMMA are shown in Table 4.
Conclusions
1. The Flory-Fox equation for PMMA was evaluated to be: Tg = 135°C – 1.4 x 10⁵ °C gmol-1/Mn.
2. Tg∞ and K were evaluated to be 135°C and 1.4 x 10⁵ °C gmol-1 respectively for predominantly syndiotactic PMMA.
3. The Fox equation, 1/Tg = w1/Tg1 + w2/Tg2, was verified for various binary mixtures of PMMA.
4. HNMR can be used to differentiate between primarily isotactic or syndiotactic PMMA samples.
5. Peak integrations of the methylene or methyl hydrogens in qHNMR spectra of PMMA can be used to determine relative isotacticity or syndiotacticity in PMMA samples.
References
[1] D’Amelia, R.P.; Khanyan, B. An Experimental Review: Evaluation of the Flory-Fox Equation for the Relationship of Glass Transition Temperature (Tg) vs Molar Mass of Polystyrene Using Differential Scanning Calorimetry (DSC). JPBPC 2022, 10 (1), 10-17.
[2] Fox Jr., T. G.; Flory, P. J. Second-Order Transition Temperatures and Related Properties of Polystyrene. I. Influence of Molecular Weight. Journal of Applied Physics 1950, 21 (6), 581-591. [3] Ober, C.K. Polymer tacticity in simulated NMR spectra. Journal of Chem. Ed. 1989, 66 (8), 645.
