1 minute read
Heat Vulnerability


Heat Vulnerability
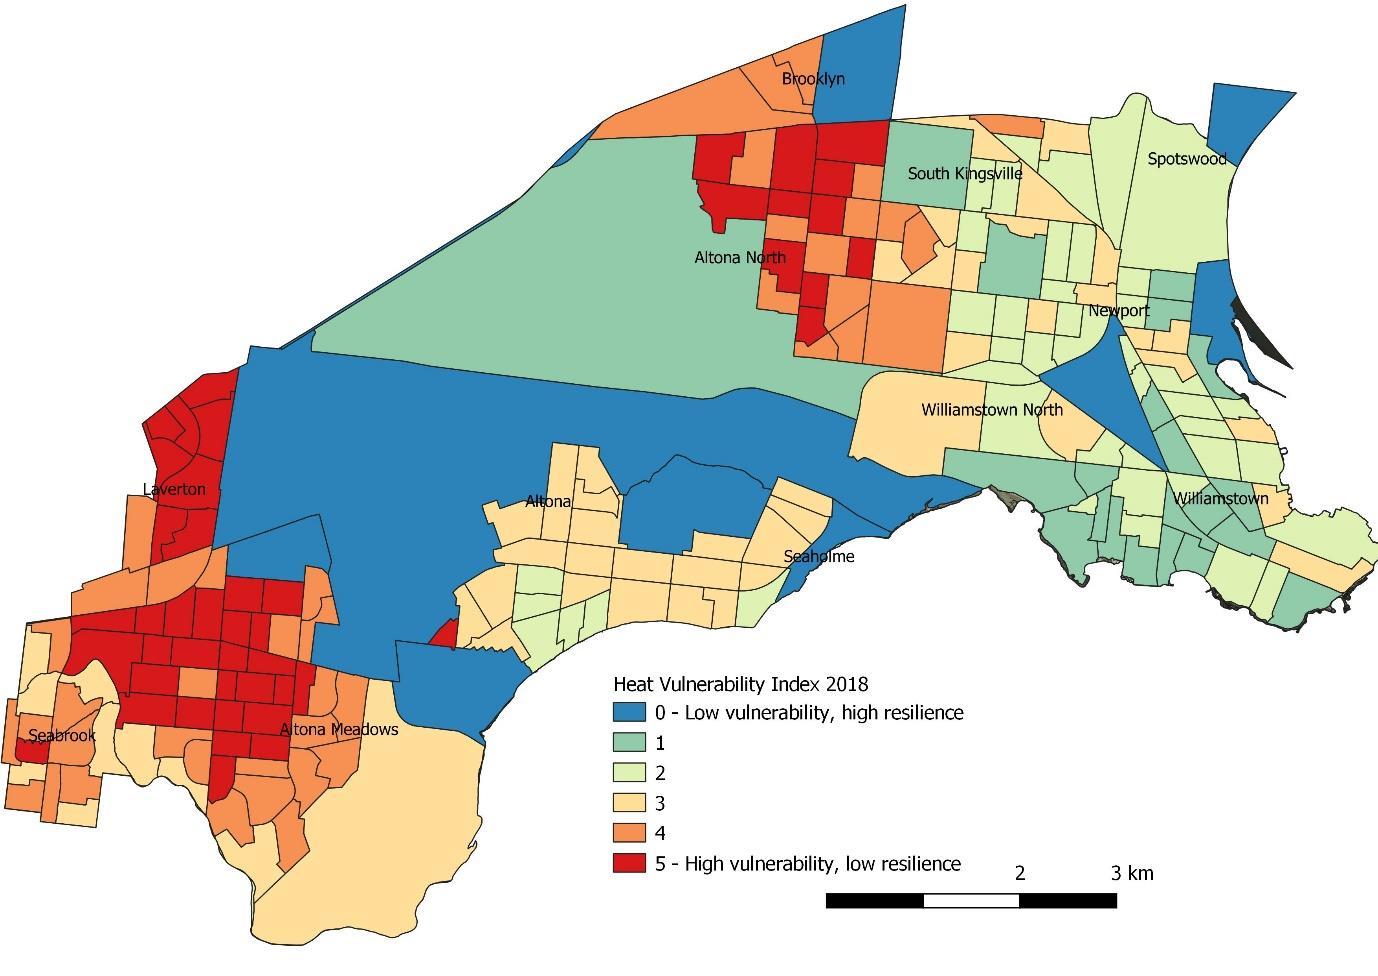
Image 6: Urban heat vulnerability by SA1 by for 2018. Source: DELWP, 2021, Spatial Data mart.
Some members of our communities are more vulnerable to these heat impacts than others due to their age, health, quality of housing and ability to cool their homes.
Image 4 helps us to understand where the more vulnerable communities are. Again, they occur in Altona Meadows, Seabrook and around the industrial areas of Altona North and Kingsville.
These areas should be targeted for increased canopy cover to help support these vulnerable communities in managing the impacts of urban heat.


