1 minute read
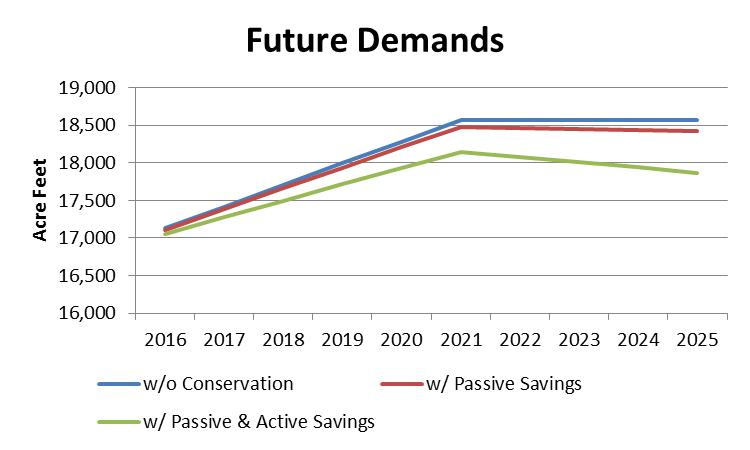
Figure 9 - Modified Demand Forecast


Reuse Study – The District is studying alternatives to increase its reuse of wastewater effluent, including the alternative of direct potable reuse. Aquifer storage and recovery using available free-river water and excess WISE water. Other cooperative initiatives through the South Metro Water Supply Authority.
The District also aggressively protects its decreed and leased water rights against other water rights applications that would cause injury to the District’s rights.
Another strategy is to develop a more aggressive approach to water efficiency. Since reliable, costeffective, renewable water supplies are becoming scarcer, an alternative to acquiring new water supplies will be to reduce water demand. Water saved through implementation of water efficiency activities will reduce the amount of new water supply needed to meet future demands.
In order for the District to provide its customers with a long-term, reliable, high-quality product, the District will implement an approach that combines improving treatment capacity and managing customer demand. An evolving and proactive water efficiency plan will help to reduce total demand, enabling the District to achieve the objectives of a high quality, renewable surface water supply without compromising desired water services.
ModifiedDemand Forecast After the evaluation and selection of water efficiency activities described in Section 4, a modified demand forecast was created. Figure 9 shows demand forecasts with and without future water savings.
conservation, and demands with both passive and active conservation.
Baseline demands at build-out are estimated to be 18,600 AF, decreasing to 17,850 AF with future water savings. The modified demand will allow the District to provide customers with 80 percent surface water at build-out with current average-year yields. With the Chatfield Reallocation and WISE projects adding an additional 3,500 AF of average-year yield, future demands can be met with 100 percent surface water in average and wet years.
Figure 9 - Modified Demand Forecast